The Effect of Implementing Accounting Standards
on Swiss Companies’ Cost of Equity Capital
Author: Simon Steinhoff
University of Twente
P.O. Box 217, 7500AE Enschede
The Netherlands
ABSTRACT
The aim of this paper is to examine whether the cost of equity capital of a company can be
influenced by the disclosure requirements imposed by different accounting standards (IFRS/US
GAAP and Swiss GAAP FER). By analyzing several changes made by Swiss companies of their
adopted accounting standards, this paper will discuss the question of whether these changes
resulted in economic benefits. The results of this paper are in line with findings of previous
research on the effect on cost of equity by different accounting standards. When changing the
accounting standard back to the local Swiss accounting standard, Swiss GAAP FER, the
observed Swiss companies displayed a higher cost of equity capital. Further this paper
documents an interesting discussion with additional regression variables for risk and size.
Supervisors:
Dr. Xiaohong Huang, Dr. Samy A.G. Essa and Professor Dr. Rezaul Kabir
Keywords
Cost of Equity Capital, (Internationally Accepted) Accounting Standards, IAAP, IAS/IFRS, US GAAP, local GAAP, Swiss companies’ Accounting Standards, Swiss GAAP FER
Permission to make digital or hard copies of all or part of this work for personal or classroom use is granted without fee pr ovided that copies are not made or distributed for profit or commercial advantage and that copies bear this notice and the full citation on the first page. To copy otherwise, or republish, to post on servers or to redistribute to lists, requires prior specific permission and/or a fee.
7th IBA Bachelor Thesis Conference, July 1st, 2016, Enschede, The Netherlands.
1. INTRODUCTION
Companies which have their shares traded on public stock exchanges are required to conform with one of several global sets of accounting standards1. These standards are primarily intended to provide transparency into a company’s financials and operations to help stakeholders and investors to understand it better, and to increase the quality of financial reporting (Ding et al., 2007). Key global standards include US General Accepted Accounting Principles (US GAAP) and the from the European Union required International Financial Reporting Standards (IFRS)2. Apart from the global standards, US-GAAP and IFRS, country specific regulations exist, which are often referred to local GAAP, such as the national accounting standard Swiss GAAP FER. Swiss GAAP FER is the main national accounting standard in Switzerland recommended by the FER. The FER defines the accounting and reporting regulations for Swiss companies3. The main difference between these accounting standards is the level of disclosure requirements. Further, they differ from each other in the valuation and recognition of revenue and expense, assets and liabilities, and business combination. The two widely international recognized accounting standards US GAAP and IFRS are representative of a higher level of disclosure and a requirement of preparing more information for investors and shareholders (Daske, 2006). Local GAAP standards, do not require disclosure of such a wide range of financial information. Swiss GAAP for example focuses more on the needs of debtors than creditors (Dumontier and Raffournier, 1998).
In Switzerland, standards have developed over the past decade. Historically, disclosure requirements by law were relatively low and companies were able to choose between adopting a domestic accounting standard or one of the two major international standards, IFRS or US GAAP. Dumontier and Raffournier (1998) conducted research on the topic of why firms would chose to voluntarily comply with International Accounting Standards (IAS is the predecessor of IFRS). In analyzing a data set of Swiss companies, they found that those that had adopted IAS benefitted through increased cross-border activity and greater investor attention. On average the benefits outweighed the cost in terms of monetary means, time and effort to apply these new but also more elaborate reporting standards.
In 2005, Swiss regulators established a requirement for all companies listed on the Swiss Exchange (SWX)4 to adopt IFRS or US GAAP reporting (Byard at al., 2011). However, a number of companies over the following years decided to change their accounting standard back to Swiss GAAP FER even though this required them to remove their listing from a main stock index in Switzerland (a drop out of the index level). Between 2008-2013
1 An Example for Europe where listed companies have to comply with a recognized accounting standard, in general IFRS http://eur-lex.europa.eu/legal-
content/EN/TXT/?uri=URISERV:l26040
2 The IFRS framework (ex. IAS 39) is legally binding for all member states in the European Union and all listed companies have to comply with this standard. The European Commission considers and endorses all new changes by the IASB (International Accounting Standard Board, accounting-setting body responsible for IFRS) and makes them legally binding. http://ec.europa.eu/finance/accounting/ias/index_en.htm 3 http://www.fer.ch/inhalt/allgemeines/aufbau-und- inhalt/konzept.html
4 ‘From 2005, companies listed on the SWX will have to carry out their accounting according to IFRS or US
32 companies made this step including large global companies such as Swatch Group, which is still listed and counts as exception5.
The change of disclosure standards from local GAAP to a set of international accounting principles and its impact on financial performance has been an important topic in research over the last two decades. To date, the research results do not provide conclusive evidence on whether the choice of accounting standard is priced by capital markets6.
The aim of this paper is to further examine whether the cost of equity of a firm can be influenced by the disclosure requirements imposed by different accounting standards, IFRS which is mainly used by Swiss companies and US GAAP stand for high disclosure while Swiss GAAP FER firms disclose comparatively less financial information. In this context cost of equity is an important determinant also when calculating the value of a company. It is the internal rate of return or discount rate, that market participants apply to a firm’s future cash flow to determine its current market value. Expressed differently, it is the required rate of return given the market’s perception of a firm’s riskiness. If the choice of accounting standard affects the riskiness of a firm, it will impact its cost of equity accordingly. Research suggests that the higher the level of disclosure standard becomes, the lower the cost of equity of a firm will be through the reduction in agency problems and through lowering the asymmetrical distribution of information between company insiders and investors (Botosan, 1997). Hail (2002) conducted research on this topic by considering what impact IFRS adoption had on Swiss companies’ cost of equity capital. In his research he found that disclosure levels and the cost of equity capital were negatively correlated, as would be supported in theory (better disclosure leads to less risk). Following the theoretical framework of Merton (1987), the empirical study below hypothesizes that ceteris paribus, companies applying a stricter and known accounting standard, e.g. US-GAAP or IFRS have lower cost of equity capital as opposed to companies following local Swiss GAAP. In order to compute a company’s cost of equity, the paper adopts elements of Hail’s (2002) approach of using a residual income model to calculate ex ante cost of equity implied by analyst earnings forecasts and stock prices. This has the advantage that differences in growth rates and expected future cash flows are modelled when calculating the value of the company, unlike more traditional measures of the value of a company such as Tobin’s Q (Hail and Leuz, 2006)7. This required shareholder return is then assessed to determine, whether the voluntary reversal of 32 companies to move away from IFRS standards impact its value. The analysis focuses on data and statistical testing of cost of equity for firms that were IFRS compliant continuously from 2005 to 2014 with data for
firms that were under IFRS in 2005 but chose to voluntarily switch back to Swiss GAAP by 2014 and give up their main index listing status8. By 2014 all firms that switched back to Swiss GAAP FER had done so 1 year ago, providing sufficient time for cost of equity to have fully adjusted to the company’s new disclosure methods.
This paper seeks to answer the research question “What is the
impact of firms opting out of IFRS accounting standards on their cost of equity?”
The first part of the paper reviews existing literature on the topic of accounting standards and their link to cost of equity. There is a wealth of existing knowledge on the subject for global markets. This paper contributes to an evaluation of modern day Swiss accounting standards. The following section discusses the methodology adopted and details the formulas used to calculate cost of equity as well as statistical testing performed on collected data. This is followed by a presentation of data and then a conclusion which supports the hypothesis that the cost of equity is negatively affected by companies opting out of IFRS reporting.
2. PRIOR LITERATURE
Academics have evaluated Accounting Standards and their different attributes in the past. There are two main sets of accounting standards globally, the Internationally Accepted Accounting Standards (IAAP) like IFRS and US GAAP or the Generally Accepted Accounting Standards (GAAP) which are specific national or local standards. The accounting in Continental European countries such as Germany, France or Switzerland have originally a more stakeholder oriented disclosure policy with granted privileges for debt holders (Bartov et al., 2005). This contrasts with IAAP standards which are influenced by Anglo-Saxon accounting methods. IAAPs are more shareholder-oriented and have led to more disclosure for market participants. It is claimed by literature and economics that more transparency of financial reporting with a higher amount of available information leads to higher information quality (Harris et al., 1994). Information obtained by the same rules and standard have a higher comparability and provides consistency in quality (Daske, 2006). These advantages of IAAP standard can provide economic benefits for companies such as more liquidity and lower cost of equity (Hung and Subramanyam, 2007). However, additional disclosure also means more sensitive information that might be used by competitors are available for public and make a company vulnerable. Companies should also consider the additional amount of time and work they need to invest to fulfill all mandatory disclosure requirements in their accounting and reporting departments (Christensen, 2012). Globalization however, has motivated many companies to adopt an international recognized accounting standard (Daske, 2006). IFRS became the most accepted financial accounting standard in the world since the adoption by all countries in the European Union in 2005 (Hung and Subramanyam, 2007).
8 The historical sequel more explicit explained: 2002 The Swiss Stock Exchange (SIX) announces the required change of the accounting standard for 2005
2005 Companies at the Swiss Exchange (SWX – main indexes) have to comply with IFRS or US GAAP
2008-2013 several companies change their reporting from IFRS back to Swiss GAAP FER
2015 Annual Reports and data for fiscal year 2014 are available (Sample: 29 companies IAS and 16 Swiss GAAP)
9 A study from Bloomfield and Wilks (2000) shows that an improvement in disclosure quality drives investors to
Extensive research has been conducted on the topic of accounting standards and their impact on a company’s Cost of Equity Capital. Many authors have used a variety of methodologies and cost of equity calculation methods. This could partially explain why conclusions presented in existing research are not always in agreement. Ernstberger and Vogler (2008) for example, through a methodology using the Capital Asset Pricing Model (CAPM) suggests cost of equity is lower in Germany when firms adopt an international recognized accounting standard. It is argued that investors see a lot benefits in companies adopting a standardized accounting standard. To them, company numbers become more transparent and this allows better risk assessment of potential investments (Byard et al., 2011). In contrast, Danske (2006) employs a Residual Income Model to test the impact on cost of equity of international companies adopting IFRS. His tests covering 1993-2002 fail to identify a causal link between the two variables.
A key publication covering Swiss Standards specifically is Hail’s (2002) work on Swiss companies’ move to IFRS and the impact this had on their cost of equity capital at the turn of the 21st century. From a theoretical view Hail (2002) mentions two perspectives of research which support his hypothesis that the correlation between disclosure level and cost of equity capital is negative; 1) The stock market liquidity perspective, where companies try to attract investors by disclosing previously private information to reduce their cost of capital in illiquid markets. Diamond and Verrecchia (1991) acknowledge that increased disclosure can indeed lead to an improvement in investor demand for shares as well as trading liquidity. Subsequently it is argued that this leads to a reduction in the cost of equity capital, especially for large companies. 2) The second perspective is the estimation risk perspective of investors regarding future returns and payoffs. For the non-diversifiable part of the estimation risk better disclosure and more information regarding the security should lower the investor’s risk as he or she is able to better understand a company’s operations and strategy. This is valued by the market which leads to lower cost of equity9. In support of this perspective, the Arbitrage Pricing Theory model by Handa and Linn (1993) highlights that low information disclosure in a market raises systematic risk levels for the investor and thus leads to lower priced securities as a discount is sought to compensate for this. This theory is supported by later empirical evidence from Botosan (1997). Additional research focused specifically on Swiss accounting highlights that the number of non-index listed companies that chose to voluntarily adopt IFRS as their primary accounting standard is high (Dumontier & Raffournier, 1998). Christensen (2012) mentions that in his sample 69% of all voluntary adopters globally are located in Germany and Switzerland. Most other adopters faced mandatory changes in switching to IFRS to comply with national laws10 and requirements of local stock exchanges. This research suggests a heightened awareness among Germanic countries of the importance of accounting
trade shares at higher prices (since additional information are priced by the market). This lead to the conclusion that higher share prices – lowering cost of capital and provide more liquidity.
10 Obligatory reporting following an international standard required by law. Germany: HGB § 315a http://www.gesetze- im-internet.de/hgb/__315a.html
standards which will be a consideration for the hypothesis formation of this paper.
The literature review gives an in depth view on benefits and drawbacks of the different accounting standards, their impact on the companies’ cost of equity and the accounting and reporting situation in Switzerland. The compiled empirical evidence should strengthen this paper to answer the research question
“What is the impact of firms opting out of IFRS accounting
standards on their cost of equity?”. Based on the reviewed
literature it can be expected that higher disclosure requirements (IFRS) lead to more information available to investors, allowing them to better assess a company’s risks, hereby lowering the cost of equity. Therefore, to answer the research question, the following hypothesis will be tested;
H: The choice of a company to opt out of IFRS accounting
standards raises its cost of equity.
3. RESEARCH METHOD & DATA
3.1 Research Design and Regression Model
To examine the relation between accounting standards and the cost of equity on the Swiss market the following research design allows to compare accounting numbers of larger Swiss firms, all listed on the Swiss Main Index (SMI Expanded, index for the 50 largest companies in Switzerland), in this study. Switzerland is of special interest since many firms had been early adopters of international accounting standards in the past (Dumontier and Raffournier, 1998, and Christensen, 2012). However, during the period of 2008-2013 several firms decided to switch back to the national accounting standard Swiss GAAP FER.A regression modelwill be established. Selected indicators that have an impact on cost of equity capital will be included. The regression model in this paper will contain the independent variable accounting standard and further measures of risk and the valuation of the company. This approach is related to pervious work of El Ghoul et al. (2011) and Hail (2002) who both researched different effects of accounting disclosure on cost of equity. Both used models containing similar control variables such as historical beta, leverage and a measures of company size (total assets and market capitalization). El Ghoul et al. (2011) extended their model by the relation of a company’s market and book value. These approaches have supported the process to derive the following regression model:
Cost of Equity Capitaljt =
α
0 + β1 * ASjt + β2 * BETAjt+ β3 * LEVjt + β4 * SIZEjt + β5* MARKETjt + β6* PtBjt +
ε
jtThe dependent variable COEjt in this test refers to cost of equity
capital of company j at time t. This is a continuous variable with several states. The first addend is the intercept of the regression line α which indicates the value of CoE at the point where the independent variable equals zero. The explanatory variable ASjt
is the choice of voluntarily opting out of IFRS and adopt the Swiss domestic standard, or not and to continuo with an international accounting standard by company j at time t. This independent variable to test the hypothesis is a dichotomous variable (it has only two states, i.e. yes or no)11. Risk variables in
11 Either a Company continues to comply with the IFRS framework [IAS] or between 2008-2013 the management decided to change the accounting standard back to Swiss GAAP FER [DAS].
12 R2 - the Coefficient of Determination, gives some information on how well data fit a statistical model – numerical
the regression are BETAjt and financial LEVjt which is the ratio
of debt to equity. The regression specification for the valuation of the company are SIZEjtwhich are the company’s total assets,
the MARKETjt capitalization of equity, and the equity price to
book value PtBjt. εjtis an idiosyncratic error term.
3.2 Variables
3.2.1 Dependent Variable – Cost of Equity Capital
Cost of equity capital (CoE) is the dependent variable in this research. There is ongoing debate in literature about the right or most suitable method to estimate cost of equity. A challenge is that this cost is not directly observable (Botosan, 2006). Cost of equity capital can be defined as the minimum return an investor requires for providing capital/equity. It consists of both a risk-free return and a premium spread that is the return an investor seeks for the non-diversifiable risk they are incurring (Botosan, 2006). The Capital Asset Pricing Model (CAPM) takes the risk-free rate and adds it to the required premium spread multiplied by a market beta. Literature on CAPM criticizes that this method is not descriptive and that in practice the link between estimation risk and the calculated market beta is weak (Botosan, 2006) & (Lakonishok, 1993). Fama and French (1993) proposed the addition of two factors to control for size and valuation of a company which statistically has shown a more reliable cost of equity number than CAPM. Their method too is not without fault however as (R2)12 is not sufficient for many tests. An alternative is the use of a Residual Income model. This is used by several authors e.g. Gebhardt et al. (2001) and Hail (2002) to compute prospective cost of capital by adopting a version of the accounting based residual income formula. These formulas project into the future a company’s residual income, i.e. the earnings it retains after paying its cost of capital. These future values are discounted to a present value, summed up and added to the company’s current book value after subtracting dividends to arrive at an implied value per share. They then determine the cost of equity for their residual income formula that equates the implied value to the real current share price. Both authors Gebhardt et al. (2001) and Hail (2002) argue that this is the cost of equity the market is pricing into the stock. This method also has limitations, e.g. hard to forecast companies’ dividend payouts when this company has a history of volatile dividend payments. Existing literature suggests both the CAPM and Residual Income models have limitations and the choice of which method to use needs to consider the characteristics of the companies being analyzed.
Various formulas are available and authors that have researched similar topics adopt a version of a Discounted Cash Flow formula, most typically Residual Income or Dividend Discount formulas, to serve their specific research purpose. Hail’s (2002) specific approach is adopted as he identifies and applies the formula13 for the purpose of relating a cost of equity to disclosure quality which suggests he used the same independent variable of a company’s choice regarding accounting standards as in this paper. Further it is argued by Hail and Leuz (2006, 2009) that the implied cost of capital approach better highlights effects on cost of equity and distinguishes them from growth or cash flow effects. A residual income model is used as adopted by Hail (2002). The basis of the residual income model (Appendix B
Figure 4) is derived from the dividend discount formula (Appendix B - Figure 2) and the book value (Appendix B - Figure 3). However, this version is not able to estimate dividends into perpetuity. Therefore, an adjusted version of the residual income model (Figure 5 – below) is defined by current market price and analyst forecast by using the residual income model through two stages. Firstly, by fading the consensus earnings forecast for T+1 and T+2 to a long-term growth rate. The last year’s residual income value is calculated into perpetuity using the sustainable long-term growth rate as it can be assumed to be average in a mature economy. To reduce estimation errors an additional approach for the terminal value is taken into account, where the residual income will decline to the long run level in line with mature industries derived from the forecasted price to book ratio. This additional assumption (Appendix B - Figure 6) is applied in this paper too, to receive more data on cost of equity. The average from the values of both formulas will be used to work with a more accurate cost of equity figure. A more detailed analysis and example of the implemented residual income model is provided in Appendix B.
𝑃𝑡= 𝑏𝑣𝑡+ ∑
(𝑥̂𝑡+𝜏− 𝑟𝑒∙ 𝑏𝑣𝑡+𝜏−1)
(1 + 𝑟𝑒)𝜏 𝑛
𝜏=1
+ ∑ (𝑥̂𝑡+𝜏− 𝑟𝑒∙ 𝑏𝑣𝑡+𝜏−1) (1 + 𝑟𝑒)𝜏 Τ
𝜏=𝑛+1
+(𝑥̂𝑡+Τ+1− 𝑟𝑒∙ 𝑏𝑣𝑡+Τ 𝑟𝑒(1 + 𝑟𝑒)Τ
Figure 5 - Adjusted Residual Income Model (Hail, 2002) Signs and variables for this and all other calculation models are explained in Appendix B.
3.2.2 Independent Variable – Accounting Standard
The accounting standard proxy (AS) is a binary variable inferential the rating is 0 or 1. The focus of the independent variable is on the company’s choice of whether it follows an International Accounting Standard [IAAP] or the domestic standard Swiss GAAP FER [DAS]. Between the fiscal years 2005 – 2007 all Swiss companies in the sample followed an international accounting standard (IFRS or US GAAP). IAAPs require from companies to release large amount of information in favor of investors and are seen as high disclosure standards (Daske, 2006). However, several firms changed their accounting standard back to Swiss GAAP FER in recent years. This paper will investigate whether this choice has an impact on a company’s cost of equity capital, for the sample of 45 companies with financial data as of end of fiscal year 2014.
3.2.3 Control Variables – Control Variables
Selected controls will be used in this multivariate analysis to affect the variable cost of capital. Controls are held constant in order to measure changes in a test subject and to determine their significance towards the dependent variable. The applied variables have proven their effectiveness in previous research of
14 ‘Raw/unadjusted beta is used, as is common practice in accounting literature’ (Hail, 2002) and in CAPM formula. A beta between 0-1 indicates that the company’s price is less volatile than the market, a value above 1 indicates that the company is more volatile than the market. Historical equity raw beta is retrieved from Bloomberg. 15 A company that has significantly more debt than equity is highly leveraged, higher interest payments and can more often face financial distress. It is possible however, that companies exhibit their financial leverage of one or more (Hail, 2002).
Hail and Leuz (2006) and Gebhardt et al. (2001). There will be two kinds of controls. One group of variables focuses on risk. Systematic risk is represented by equity beta (BETA) 14 which is determined by comparing the movements of the security to the Swiss Performance Index (SPI) over the past two years of weekly data. These common historical information is expected to be positively associated with cost of equity (+). A positive correlation between market beta and cost of equity capital is explained by the capital asset pricing model CAPM and also in prior research (e.g., Sharpe, 1964 and Lintner, 1965) where a positive correlation with expected stock returns was found. Financial leverage (LEV) 15is included to observe a company’s riskiness especially in debt financing (Modigliani and Miller, 1958). This measures the ratio of a company’s total debt and the market value of outstanding equity. This variable is also positively associated with cost of equity (+). A company that has significantly more debt than equity is highly leveraged. However, it was found by Fama and French (1992) that levered companies earn higher stock returns. Further variables will focus on the valuation of a company. The size (SIZE) of a company is defined by the natural logarithm of total assets which is negatively correlated to cost of equity (-)16. The market capitalization of the company is represented in the variable (MARKET), which is negatively correlated (-)17. (PtB) is a way to value a company by comparing the market value of equity to the book value of shareholders’ equity. A higher value is positively correlated with cost of equity Capital (+). This positive correlation is assumed referring to the results of Fama and French (1992) who concluded that companies with a higher Price to Book value should achieve higher returns.
3.3 Input Data
The presented version of the residual income formula requires the following data to determine a cost of equity capital: Consensus Earnings Forecasts for 2 years (Y1, Y2) which is the estimated net income for 2015 and 2016, a 1 year forward Price to Book ratio, and a long-term Growth Rate. Following the rule of calculated discounted perpetuity, for a mature economy an average (normal) growth rate can be expected. In 2014 this was 3% for the Swiss economy18. Further the Book
Value per Share for the period being tested, the company’s Dividend Payout Ratio and the actual Share Price for the period being tested.
For the control variables of the regression model the following market data will be retrieved from the Bloomberg data portal as follow: Historical data for Raw Equity Beta over the last two years. Leverage is the current ratio of total financial debt and common equity. Size are the company’s current total assets, further information of the historical Market Capitalization is required, and the Price to Book Ratio for 2014. Should data be missing, a manual search into annual reports will be conducted. This is also necessary for detailed information for the independent variable Accounting Standard. Information about
16 Logarithm to the base e.
17 In previous research by Hail (2002) and Raffournier (1995) results have shown, that a higher market capitalization led to lower cost of equity, that might be coherence with the overall size and publicity.
18For 2014 a sustainable growth rate of 3% is used as it can be
[image:5.595.79.262.287.371.2]the year of the change back to Swiss GAAP is only available in the annual reports of the respective years.
The analysis focuses on data for firms that were IFRS compliant continuously from the beginning of mandatory IFRS accounting in Switzerland starting in 2005 to 2014 and with data for firms that were under IFRS in 2005 but chose to voluntarily switch back to Swiss GAAP FER by 2014 and give up their main index listing status.
[image:6.595.50.288.306.416.2]By 2014 all firms that switched back to Swiss GAAP FER had done so at least 1 year ago. This time period is chosen to prevent possible bias as for example the inability of a market to immediately price new and additional disclosed information due to the introduction of IFRS accounting, as mentioned by Hung and Subramanyam (2007). In this paper the date of observation is determined to one year after the last company switched back to Swiss GAAP FER providing sufficient time for cost of equity to have fully adjusted to the company’s new disclosure methods. Thus it can be expected that at the end of FY 2014 all information due to the change of the accounting standard are priced by the market correctly (as illustrated in Figure 1).
Figure 1 – Time sequence
3.4 Sample Selection
Data is fully collected for a sample of 45 Swiss-listed companies as presented in Table 1. This sample comprises: Switzerland’s 50 largest companies as defined as their inclusion in the Swiss Market Index (SMI Expanded)19. These companies all comply with international accounting standards (IFRS or US GAAP). However, for the purpose of this paper this group is with limitations of financial companies (-17). The financial sector is omitted in accordance with Hail (2002) who suggests this industry is too heavily influenced by additional standards and disclosure requirements. Missing data reduces the sample by 2. The group of companies that follow an international standard has a sample size of 29. The second group consist of companies that opted out of IFRS accounting between 2008 – 2013 and from then on privilege the national accounting standard (Swiss GAAP FER). For these 32 companies financial information is only available for half the sample (-16). That leaves 16 companies for the group that is following the local accounting standard Swiss GAAP FER. These Swiss firms are also listed on the Swiss Stock Exchange (SWX) but not on a main standard index (SMI) due to their decision to opt out of IFRS accounting. There is however, an exception for Georg Fischer AG and The Swatch Group AG who are listed together with other large Swiss companies on the Swiss main index (SMI).
19 SMI Expanded comprises the 50 most highly capitalised stocks in the Swiss equity market and is composed of the SMI, compromises the 20 largest equities (blue-chips) +
Table 1 - Summary of sample selection process
Number Percent
Firms (IFRS or US GAAP) 50 61%
Firms (Swiss GAAP FER) 32 39%
82 100%
Firms with missing data -18 -22%
Financial institutions -19 -23%
Total number of sample firms 45 55%
Table 1 summarizes the sample selection process. The observed sample is composed of Swiss firms following an international accounting standard (IFRS or US GAAP) and are listed on the Swiss Main Index (SMI Expanded). The second group are firms that switched their accounting standard in the period between 2008-2013 and from this date on privilege the national accounting regulations (Swiss GAAP FER). The sample comprises 45 Swiss firms in total.
3.5 Descriptive Statistics
The descriptive statistics for the sample can be found in Table 2. All data is retrieved for the time point ‘end of fiscal year 2014’. This point in time is determined to have all possible market reaction on a change of the accounting standard priced in. Panel A summarizes information about the whole sample of 45 Swiss non-financial companies. The table then separates the sample by reported accounting standards Panel B IAAP and Panel C for DAS to observe possible differences between the companies. In addition to gives further information about the relationship and statistical significance of collected data the unpaired Welch’s t-test is selected to t-test the significance of values of the regression variables which is reliable for unequal samples sizes (for IAAP n=29 and for DAS n=16). The Welch’s t-test is derived from the Student’s t-test but more robust when process unequal variances as this is the case in this paper.
Both samples have similar minimum of cost of equity capital (CoE). The values (3.29% - 3.50%) are very close to each other. For the mean however, there is a huge gap of 1.1% to observe. 5.24% cost of equity for IAAP and higher cost of equity of 6.34% can be observed for companies following the Swiss GAAP accounting standard [DAS]. The standard deviation for DAS companies is almost two times higher (1.82%) in comparison to the numbers for IAAP. The values as such are relatively small however, there is a difference in the shape to observe. Values for DAS companies show huge differences in cost of equity between Swiss companies. There is a wide spread between the minimum of 3.50% and the highest value for cost of equity 9.63%. For companies reporting in IAAP standard the cost of equity is more centered around the mean of 5.24%. The significance for cost of equity values is 0.037. Values for equity beta (BETA) are not significant (Welch’s t-test: 0.1455). Beta for companies following IAAP is slightly higher when comparing the first and third quartile and also the mean (mean of IAAP 1.02; mean of DAS 0.82). However, it shows a trend that companies that changed back to the local Swiss accounting standard are less volatile than their respective market (lower mean 0.82).
Financial leverage (LEV) a proxy for the risk level of a company (Modigliani and Miller, 1958) shows for both groups that the median is relatively low especially for companies following DAS 0.31 (IAAP 0.35). These results are in line with previous research on Swiss companies by Hail (2002) who observed a median value of 0.35. 4 IAAP (only 1 DAS) companies are highly leveraged and exhibit the value of one. The measures of magnitude companies’ total assets (SIZE) as well market capitalization (MARKET) show both that the group among companies following IAAP are considerably larger than those who switched to Swiss GAAP (DAS). The mean of total assets by companies following IAAP is 8.98 and thus 50% higher than the mean for DAS (5.98). Similar results shows the variable MARKET. The mean of companies following IAAP standards is 45% higher (IAAP 9.51 to DAS 5.98). For both measures all values are significant (at 0.00 Welch’s t-test). It can be concluded that lager companies (indicated by market capitalization and assets) tend more often to report their financial information following an IAAP standard. Values for the ratio of equity price to book value (PtB) are not statistical significant with a value of 0.12. However, values for means and standard deviation are similar.
4. EMPIRICAL RESULTS
To derive possible differences in the cost of equity capital between companies with different accounting standards several tests will be conducted. First the correlation of selected variables will be analyzed. In the regression analysis part, first univariate tests are performed to observe the effect of every variable on the intercept cost of equity capital. In the second part a simple and multivariate regression analysis will be conducted where cost of equity is regressed on the independent and several control variables at the same time.
[image:7.595.85.513.80.443.2]In table 3 all variables show the expected correlation to rCoE the value for cost of equity. BETA is positive correlated with cost of equity (0.27) and significant at a 10%level. The correlation of companies’ total assets (SIZE) and the market value of equity (MARKET capitalization) with cost of equity is expected to be negative for both cases. One reason for this are the results from table 2, where companies that continued to report in IAAP accounting have higher values in SIZE and MARKET and lower cost of equity, vice versa for companies that changed their accounting standard back to Swiss GAAP FER. Both coefficient values of the correlation with cost of equity are close to each Table 2 - Descriptive Statistics for regression variables
Variable n Mean Median Min Q1 Q3 Max St. dev. Welch's t
Panel A: Whole sample containing all companies n=45
CoE 45 5.63% 5.35% 3.29% 4.71% 6.13% 9.63% 1.43% 0.037
BETA 45 0.97 1.00 0.09 0.93 1.12 1.31 0.25 0.146
LEV 45 0.43 0.21 0.00 0.09 0.68 1.58 0.40 0.366
SIZE 45 7.91 8.29 4.08 6.45 8.98 11.80 1.95 0.000
MARKET 45 8.45 8.58 4.48 6.76 9.66 13.91 2.18 0.000
BTM 45 0.33 0.31 0.01 0.20 0.43 0.75 0.17 0.120
Panel B: Companies following IAAP n = 29
CoE 29 5.24% 5.23% 3.29% 4.68% 6.01% 8.04% 1.00%
BETA 29 1.02 1.04 0.43 0.95 1.18 1.31 0.21
LEV 29 0.47 0.35 0.00 0.21 0.68 1.58 0.42
SIZE 29 8.98 8.78 6.83 8.29 9.90 11.80 1.30
MARKET 29 9.51 9.45 7.76 8.58 10.05 12.35 1.25
BTM 29 0.30 0.30 0.09 0.19 0.36 0.75 0.16
Panel C: Companies following DAS n = 16
CoE 16 6.34% 6.12% 3.50% 5.04% 7.32% 9.63% 1.82%
BETA 16 0.89 1.00 0.09 0.82 1.01 1.23 0.30
LEV 16 0.36 0.31 0.00 0.00 0.62 1.21 0.36
SIZE 16 5.98 5.56 4.08 5.36 6.49 9.45 1.34
MARKET 16 6.53 6.30 4.48 5.20 6.80 13.91 2.21
BTM 16 0.39 0.39 0.01 0.24 0.54 0.72 0.19
other with (-0.41 and -0.45) and highly significant, both at a significance level of 1%. The ratio PtB shows also a positive correlation with 0.21 as expected. Only the proxy financial leverage (LEV), the ratio of total debt to equity, does not show the expected positive relationship to the dependent variable. This is similar to results of Raffournier (1995) who also failed to observe an expected positive direction for leverage in the Swiss market.
Notable is that the variables MARKET and SIZE are highly correlated at 0.9237 at a significance level of 1%. Both variables are heavily dependent on each other and thus it is possible that they are exchangeable for each other. To combine these two variables in a regression might has no statistical validity and thus will be considered in the discussion for the multivariate regression (table 4).
Table 3 - Pearson correlation coefficients between regression variables (n=45)
rCoE BETA LEV SIZE MARKET
BETA 0.27*
LEV -0.08 -0.26*
SIZE -0.41*** 0.18 0.23
MARKET -0.45*** 0.22 0.06 0.92***
PtB 0.21 -0.07 0.12 -0.17 -0.46*** Table 3 shows the Pearson pair-wise correlation between rCoE the implied cost of equity capital and the control
variables. All variables are defined in Appendix A. The coefficient is elucidated with a symbol for the p-value for a
two-tail test which denotes statistical significance * at 10% level, ** at 5% level, and *** at 1% level. In this table all 45 sample companies are considered. Financial information and calculations are based on retrieved data from Bloomberg L.P. as of 31.12.2014.
The regression model (as illustrated and explained in chapter 3.1) of cost of equity (CoE) the dependent variable/regressand on accounting standard (AS) the independent variable/regressor and on all control variables is presented in table 4. First the simple regression (OLS) will be discussed and the effect of every single variable on the predicted variable cost of equity will be tested and analyzed. Beginning with the predictor variable accounting standard (AS) shows an effect of 1.1% on cost of equity at a significance level of 0.012. This relationship is highly significant and both variables are negative correlated as expected. The power of the adjusted R-squared is relatively low at 11.8% and might be interpreted as too low. However, even with a low R-squared it should be considered that the coefficient is highly significant and represents the mean change. BETA has the expected positive relation to cost of equity. The higher the historical beta, the riskier a stock and the business of the respective company is and consequently the higher the cost of equity capital becomes. In case of the simple regression the coefficient of beta is 0.0158. This control variable is statistical significant (0.07) at a 10% significance level and has low explanatory power of 5.3%. Financial leverage (LEV) does not show the expected positive direction in the simple regression. Leverage seems to have no influence on cost of equity at all (coefficient 0.0000; significance 0.60; adj. R-squared 0.7%). The anticipated negative effect on the predicted variable cost of equity show both magnitude variables SIZE and MARKET. Both have a coefficient of -0,003 and are highly significant (0.0055 and 0.0021) at a 1% level. Both controls have the highest
explanatory power when comparing the adjusted R-squared values with 14.7% and 18.1% in the simple regression. The coefficient for PtB (0.17) is positive associated as expected but is not significant and has low power (2.3%).
For the multiple regression (OLS) not all control variables proofed that they fit together in one model. Leaving financial leverage (LEV) out of the multiple regression model might be justified by several reasons. Leverage showed an unexpected direction in the Pearson correlation in table 3, and was found of no importance by having no effect on cost of equity in the simple and multiple regression with all variables included. In this composition the accounting standard (AS) has an even higher negative impact on cost of equity of -1.3% and is significant (0.051) at a 10% level. The variables historical BETA (0.001) and MARKET capitalization (0.029) are also significant and show the expected effect (Beta +positive; MARKET -negative) on the predicted variable cost of equity. The adjusted R-squared has in this compound regression the highest power with 33.5% in comparison to all other sets of regressions.
Taking the high and significant Pearson correlation value (0.9237) of table 3 between SIZE and MARKET into account it should be analyzed which of those two variables can be left out. This should be done by testing a regression model leaving out one variable at a time. The effect by the accounting standard on cost of equity is lower than in the original multiple regression -0.0067 when leaving out the variable SIZE and is not significant 0.1994. (Effect leaving out the variable MARKET -0.0065; Significance 0.2773). The adjusted squared is 29.5% (adj. R-squared leaving out MARKET 26.1%). The coefficient of financial leverage has no effect in both cases (value of 0.000). Comparing the addressed two versions of the multiple regression model, more robust results can be achieved by leaving out the variable SIZE. However, the coefficient for accounting standard is lower than in the original model and is not significant.
LEVARAGE and SIZE seem to be expandable variables in the regression model. In a third test of the multiple regression model both variables will be left out. The accounting standard (AS) has smaller negative impact on the cost of equity -0.8% (-1.1% in the simple regression) and the coefficient is not significant. BETA’s coefficient (0.023) is significant at a 1% level and has again the expected positive effect on cost of equity. The small negative impact of MARKET (-0.002) is significant at a 10% level. The adjusted R-squared is 0.281 suggesting 32% of the regression line is explained by the data of all variables and thus is lower in comparison to the previous to versions of the regression model.
5. CONCLUSION AND DISCUSSION
The relationship between accounting standards and cost of equity capital is an important and versatile topic for academics in theory but also in practice due to extreme effects on different financial aspects. Disclosure policies and requirements for example are from high importance. They are the basis for companies to govern the amount of information and which financial data will be disclosed, and who is the main addressed recipient of these valuable information. Market participants can benefit from accounting regulations with high disclosure standards and apply additional knowledge to their market equity valuation. In this paper the main focus lies on the assumed negative association with cost of equity capital. Main challenges in researching this relationship are the different ways on how to assess cost of capital equity and that in many cases the company size20 and market position is relevant for the decision of the accounting standard.This paper provides a new analysis on non-financial Swiss companies which decided to change their international accounting standard (IAAP) and to comply with the domestic standard Swiss GAAP FER (DAS). This change has an economic effect on a company and is reflected in the company’s cost of equity. This paper is able to elaborate a significant relationship in its empirical results. The identified cost advantage for companies that continue to report with an IAAP accounting standard (mainly IFRS) lies at 1.1%, when comparing with the cost of equity capital for companies reporting in Swiss GAAP FER. It can be concluded on basis of the given data and a
20 i.e. measured by market capitalization
consequent significance level of 0.012 the choice of a company to opt out of IFRS accounting standards raises its cost of equity.
However, the results are only representative for a small sample group of Swiss companies (thus limited to a single market) and limited to the observed period in this paper, which is close to the time after a change of accounting from an IAAP standard to Swiss GAAP FER. The results of this paper can only hold accountable for financial information of end of fiscal year 2014. Thus the results should not be generalized. Another limitation is the relatively small sample size of companies following Swiss GAAP FER. Financial data have been available for only 50% of the pre-selected companies. More data from different companies might lead to different findings. General remarks are changing markets and uncertainties that might have a different impact on the tendency of the correlation between variables before and after this date and lead to parameter instability. Further the selection process of variables can be seen as a violation on the regression relationship. The controlled variables have not been selected randomly and might be subject of selection bias. For future research further regression variables should be considered.
6. ACKNOWLEDGEMENT
[image:9.595.75.525.76.319.2]The author gratefully acknowledges the help and feedback of Dr. Xiaohong Huang, Professor Dr. Rezaul Kabir, Dr. Samy A.G. Essa, and Ir. Henk Kroon (supervisory team of the department Finance & Accounting, faculty of Behavioural, Management and Social Science at the University of Twente, the Netherlands). Moreover, the author would like to thank his families Steinhoff & Happ, and his friends for their support.
Table 4 - Regression of Cost of Equity Capital on Accounting Standard, Beta, Leverage, Total Assets, Market Value and Book-to-Market
Variables Simple Regression (OLS) Multiple Regression (OLS)
AS (-) -0.011** -0.013* -0.007 -0.008
BETA (+) 0.016* 0.028*** 0.025*** 0.023***
LEV (+) 0.000 0.000
SIZE (-) -0.003*** 0.004
MARKET (-) -0.003*** -0.009** -0.003** -0.002*
PtB (+) 0.017 -0.023 0.000 0.003
Adj R^2 0.118 0.053 0.007 0.147 0.181 0.023 0.335 0.295 0.281
Table 4 reports the results from regression of the dependent variable cost of equity (CoE) on all independent regression variables. All variables are defined in Appendix A. Coefficient values quoted above are for a two-tail test. The coefficient is elucidated with a symbol for the p-value for a two-tail test which denotes statistical significance * at 10%
7. REFERENCES
Bartov, E., Goldberg, S. R., & Kim, M. (2005). Comparative Value Relevance Among German, US, and International Accounting Standards: A German Stock Market Perspective. Journal of Accounting, Auditing & Finance, 20(2), 95-119.
Botosan, C. A. (1997). Disclosure Level and the Cost of Equity Capital. Accounting Review, 323-349.
Botosan, C. A., & Plumlee, M. A. (2002). A Re‐Examination of Disclosure Level and the Expected Cost of Equity Capital. Journal of Accounting Research, 40(1), 21-40.
Botosan, C. A., & Plumlee, M. A. (2005). Assessing Alternative Proxies for the Expected Risk Premium. Accounting Review, 21-53.
Botosan, C. A. (2006). Disclosure and the Cost of Capital: What Do We Know? Accounting and Business Research, 36(sup1), 31-40.
Byard, D., Li, Y., & Yu, Y. (2011). The Effect of Mandatory IFRS Adoption on Financial Analysts’ Information Environment. Journal of Accounting Research,49(1), 69-96.
Cameron, A. C., & Windmeijer, F. A. (1997). An R-squared Measure of Goodness of Fit for Some Common Nonlinear Regression Models. Journal of Econometrics, 77(2), 329-342.
Christensen, H. B. (2012). Why Do Firms Rarely Adopt IFRS Voluntarily? Academics Find Significant Benefits and the Costs Appear to Be Low. Review of Accounting Studies, 17(3), 518-525.
Daske, H. (2006). Economic Benefits of Adopting IFRS or US‐
GAAP – Have the Expected Cost of Equity Capital Really Decreased? Journal of Business Finance & Accounting, 33(3‐4), 329-373.
Diamond, D. W., & Verrecchia, R. E. (1991). Disclosure, Liquidity, and the Cost of Capital. The Journal of
Finance, 46(4), 1325-1359.
Ding, Y., Hope, O. K., Jeanjean, T., & Stolowy, H. (2007). Differences Between Domestic Accounting Standards and IAS: Measurement, Determinants and Implications. Journal of
Accounting and Public Policy, 26(1), 1-38.
Dumontier, P., & Raffournier, B. (1998). Why Firms Comply Voluntarily with IAS: An Empirical Analysis with Swiss Data. Journal of International Financial Management and Accounting, 9(3), 216-245.
Ernstberger, J., & Vogler, O. (2008). Analyzing the German Accounting Triad - “Accounting Premium” for IAS/IFRS and US GAAP Vis-à-Vis German GAAP?. The International Journal of Accounting, 43(4), 339-386.
Fama, E. F., & French, K. R. (1992). The Cross‐Section of Expected Stock Returns. The Journal of Finance, 47(2), 427-465.
Fama, E. F., & French, K. R. (1993). Common Risk Factors in the Returns on Stocks and Bonds. Journal of Financial Economics, 33(1), 3-56.
Gebhardt, W. R., Lee, C. M., & Swaminathan, B. (2001). Toward an Implied Cost of Capital. Journal of Accounting
Research, 39(1), 135-176.
El Ghoul, S., Guedhami, O., Kwok, C. C., & Mishra, D. R. (2011). Does Corporate Social Responsibility Affect the Cost of Capital?. Journal of Banking & Finance, 35(9), 2388-2406.
Hail, L. (2002). The Impact of Voluntary Corporate Disclosures on the Ex-Ante Cost of Capital for Swiss Firms. Available at
SSRN 279276.
Hail, L., & Leuz, C. (2006). International Differences in the Cost of Equity Capital: Do Legal Institutions and Securities Regulation Matter?. Journal of Accounting Research, 44(3), 485-531.
Hail, L., & Leuz, C. (2009). Cost of Capital Effects and Changes in Growth Expectations Around US Cross-Listings. Journal of
Financial Economics, 93(3), 428-454.
Handa, P., & Linn, S. C. (1993). Arbitrage Pricing with Estimation Risk. Journal of Financial and Quantitative Analysis, 28(01), 81-100.
Harris, T. S., Lang, M., & Mőller, H. P. (1994). The Value Relevance of German Accounting Measures: An Empirical Analysis. Journal of Accounting Research, 32(2), 187-209.
Hung, M., & Subramanyam, K. R. (2007). Financial Statement Effects of Adopting International Accounting Standards: The Case of Germany. Review of Accounting Studies, 12(4), 623-657.
Lakonishok, J. (1993). Is Beta Dead or Alive?. In AIMR
Conference Proceedings (Vol. 1993, No. 6, pp. 38-41).
Association for Investment Management and Research.
Lintner, J. (1965). The Valuation of Risk Assets and the Selection of Risky Investments in Stock Portfolios and Capital Budgets. The Review of Economics and Statistics, 13-37.
Merton, R. C. (1987). A Simple Model of Capital Market Equilibrium with Incomplete Information. The Journal of Finance, 42(3), 483-510.
Modigliani, F., & Miller, M. H. (1958). The Cost of Capital, Corporation Finance and the Theory of Investment. The
American Economic Review, 48(3), 261-297.
Raffournier, B. (1995). The Determinants of Voluntary Financial Disclosure by Swiss Listed Companies. European Accounting Review, 4(2), 261-280.
Sharpe, W. F. (1964). Capital Asset Prices: A Theory of Market Equilibrium Under Conditions of Risk. The Journal of
APPENDIX
Appendix A - Definition of Variables
Variable Definition
CoE The future expected cost of equity. This value is derived from the internal rate of return from the adjusted residual income model by using a long-term growth rate (Figure 5) and price to book number (Figure 6).
BETA The companies' historical equity raw beta. Beta is determined by comparing the percentage price change of a company's security and the representative market index 'Swiss Performance Index' (SPI) for the past two years of weekly data. Financial data as of 31.12.2014, reported by Bloomberg.
LEV A company’s financial leverage calculated by total debt to common stockholder's equity. It indicates what proportion in percentage of equity and debt the company is using to finance its assets. Bloomberg values are as of 31.12.2014.
AS A company's accounting standard, either an international standard (IAAP) or the Swiss national standard (Swiss GAAP).
SIZE SIZE is measured by the companies' total assets as of 31.12.2014.
MARKET The market capitalization of equity at end of fiscal year 2014.
PtB Is defined in this study as the ratio of the stock price to the book value per share in 2014 obtained by Bloomberg.
21 The Residual Income model in this specific version was established first by Gebhardt et al. (2001). However, this paper focuses on the redefined version by Hail (2002).
Appendix B – Derivation of the Model
The calculation of the cost of equity is key to answering the research topic of this paper. As discussed in the Literature Review, various formulas are available and authors that have researched similar topics adopt a version of a Discounted Cash Flow formula, most typically Residual Income or Dividend Discount formulas, to serve their specific research purpose. Hail’s (2002) specific approach in Figure 5, is adopted as he identifies and applies the formula21 for the purpose of relating a cost of equity to disclosure quality which suggests he used the same independent variable of a company’s choice regarding accounting standards as in this paper.Hail (2002) starts by considering a dividend discount formula. This initial version defines a firm’s theoretical stock value as the present value of its future dividends.
𝑉𝑡= ∑ 𝐸𝑡[
𝑑𝑡+𝜏
(1 + 𝑟)𝜏]
∞
𝜏=1
Figure 2 - Basic Dividend Discount Formula (Hail, 2002)
Where Vt = “intrinsic” value of the firm at date t
dt = net dividends paid during period (t-1, t)
r = cost of equity (and discount rate) Et [.] = expected value operator conditioned on information available at date t
This formula assumes that the cost of equity and the risk-free rate remain constant through time. This establishes a relationship whereby the current book value is equal to last year’s book value plus earnings for the current period minus any dividends paid out. This is depicted below.
𝑏𝑣𝑡= 𝑏𝑣𝑡−1+ 𝑥𝑡− 𝑑𝑡
Figure 3 - Accounting Book Value = Prior Year Book Value + Earnings - Dividends (Hail, 2002)
Where bvt = accounting book value of equity at date t
Xt = accounting earnings for period (t-1, t)
dt = dividends paid for period t
𝑉𝑡= 𝑏𝑣𝑡+ ∑ 𝐸𝑡[
𝑥𝑡+𝜏− 𝑟 ∙ 𝑏𝑣𝑡+𝜏−1
(1 + 𝑟)𝜏 ]
∞
𝜏=1
= 𝑏𝑣𝑡+ ∑ 𝐸𝑡[
(𝑃𝑅𝑂𝐹𝑡+𝜏− 𝑟)𝑏𝑣𝑡+𝜏−1
(1 + 𝑟)𝜏 ]
∞
[image:12.595.56.283.76.164.2]𝜏=1
Figure 4 - Residual Income Model (Hail, 2002)
Where PROFt = after-tax return on book value of equity
for period (t-1, t)
r = cost of equity (and discount rate) bvt = accounting book value of equity at date t
Hail (2002) identifies a weakness in the practical application of Figure 4, namely the requirement to immediately estimate dividends into perpetuity. As a way around this, he suggests determining value in 3 stages as shown in Figure 5, 1) An explicit three-year forecast, 2) Fading the T+3 forecast to a sustainable level into perpetuity after T+1222. This paper fades the earnings growth rate of a company from that achieved in T+1 to T+2 to a long-term sustainable 3% growth rate in 201423 which is assumed to be the average rate of growth for a mature economy (Calculated Discounted Perpetuity, 2004), and 3) calculating a Terminal Value by taking the last residual income into perpetuity with at the long-term growth rate.
𝑃𝑡= 𝑏𝑣𝑡+ ∑
(𝑥̂𝑡+𝜏− 𝑟𝑒∙ 𝑏𝑣𝑡+𝜏−1)
(1 + 𝑟𝑒)𝜏 𝑛
𝜏=1
+ ∑ (𝑥̂𝑡+𝜏− 𝑟𝑒∙ 𝑏𝑣𝑡+𝜏−1) (1 + 𝑟𝑒)𝜏 Τ
𝜏=𝑛+1
+(𝑥̂𝑡+Τ+1− 𝑟𝑒∙ 𝑏𝑣𝑡+Τ 𝑟𝑒(1 + 𝑟𝑒)Τ
Figure 5 - Adjusted Residual Income Model (Hail, 2002)
where Pt = market price of a firm’s stock at date t
𝒙̂𝒕+𝝉 = expected future accounting earnings for period (t+τ-1, t+τ), either explicitly forecasted, generated by a linear fading rate or assumed constant
re = estimate of the ex ante cost of capital
calculated as the internal rate of return to solve the equation
bvt +τ = expected future accounting book value of
equity at date t+τ, where
𝑏𝑣𝑡+𝜏= 𝑏𝑣𝑡+𝜏−1+ 𝑥̂𝑡+𝜏− 𝑑̂𝑡+Τ 𝑎𝑛𝑑 𝑑̂𝑡+𝜏 = expected future net dividends for period (t+τ-1, t+τ),
derived from the dividend pay-out ratio k times the earnings forecast 𝑥̂𝑡+𝜏
This approach still includes a fair amount of estimation error on the forecasted inputs. Another option to determine the terminal value of the residual income model is to take instead the forecasted Price to Book value into account, which implicitly assumes that the industry is mature and will not grow indefinitely. This assumption is applied in this paper too to receive more data for cost of equity and to use its average. The
22 A period of 12 years is chosen since it is assumed that any growth in earnings has a neutral value after 12 periods (Gebhardt et al., 2001).
adjusted residual income model is defined through two stages by using the consensus earnings forecast for T+1 and T+2 and assumes that for the terminal value, the residual income will decline to the long run level in line with mature industries derived from the forecasted Price to Book ratio.
𝑃𝑡
= 𝑏𝑣𝑡
+ ∑(𝑥̂𝑡+𝜏− 𝑟𝑒∙ 𝑏𝑣𝑡+𝜏−1) (1 + 𝑟𝑒)𝜏 𝑛
𝜏=1
+ 𝑇𝑒𝑟𝑚𝑖𝑛𝑎𝑙 𝑉𝑎𝑙𝑢𝑒 ((𝑃𝑇− 𝐵𝑇) + 𝑅𝐼
[image:12.595.311.542.355.655.2](1 + 𝑟𝑒)𝜏 𝑓𝑜𝑟 𝑝𝑒𝑟𝑖𝑜𝑑𝑠 𝑇 − 1)
Figure 6 - Residual Income Model Example
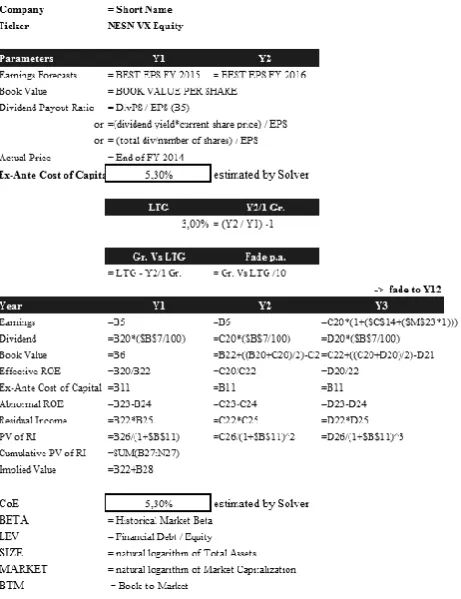
An example of the formulas applied in an excel sheet for calculation is provided below. To identify the value of the predicted variable cost of capital the implied value becomes equal to the actual price cell which is the average price of the stock in end of FY 2014.
Figure 7 – Detailed overview on how to solve the equation for r = Cost of Equity Capital
23 For 2014 a sustainable growth rate of 3% is used as it can be assumed to be average in a mature economy
[image:12.595.79.262.363.445.2] [image:12.595.56.287.472.634.2]