Master thesis:
Detecting deviant behaviour in information systems by using
outlier detection on logs
Author
Roelof Jan Mathijs de Groot
Program: Business Information Technology MSC Institute: University of Twente
Student number: s1392999
Email: [email protected]
Graduation committee
Maria E. Iacob
Department: Industrial engineering and Business information systems Institute: University of Twente
Email: m.e. i [email protected]
Maya Daneva
Department: Service, cybersecurity and safety Institute: University of Twente
Email: m. d an e v a @utwente.nl
Wout Slakhorst
Department: Nedap Healthcare Team: Cupido
Email: [email protected]
Joep Peeters
Department: Nedap Healthcare
Abstract
Issues of IT-security remain prevalent in the world. While companies are starting to take
information security more seriously, there is still a lot of potential left untapped that could support improvement of information security. This master thesis proposes a methodology that taps into a readily available source of data, namely system-logs. Logs can be generated by a system whenever an user performs an action. These logs might yield interesting discoveries when analysed with techniques from certain field such as data-mining and machine-learning. This thesis proposes a methodology that guides the creation of a system that analyses logs to discover deviant behaviour of users. This system will analyse the logs in two steps. First, clustering algorithms will be used to group users with similar behaviour together. The second step consists of using these groups of similar as input for outlier-detection algorithms. The outliers that are discovered can then be evaluated and used to improve information security. The methodology has been evaluated by using a prototype. This prototype has been used to analyse data supplied by Nedap Healthcare. This data was generated by caretakers while performing their jobs during the months Augusts, September and October of 2017. As such this data is representative of actual and relevant real-world
circumstances. This means that problems that arise from using real-world data have been encountered during the creation of this methodology. The organizational relevance of the
Table of Contents
Abstract...2
1 Introduction...5
1.1 The problem statement...6
1.2 Research questions...6
1.3 Research methodology...6
1.4 Scope...7
1.5 Structure...7
2 Literature...8
2.1 Literature survey:Outlier-detection approaches...8
2.1.1 Research goal & questions...8
2.1.2 Concepts...8
2.1.2.1 Data and Supervision...9
2.1.3 Literature search approach...10
2.1.3.1 Key-words...10
2.1.3.2 Fields...10
2.1.3.3 Inclusion & Exclusion...11
2.1.4 Findings...11
2.1.4.1 What are the different approaches used for outlier-detection?...12
2.1.4.2 What are the different algorithms used in outlier-detection?...14
2.1.5 Discussion...16
2.1.6 Limitations...16
2.1.7 Conclusion...17
2.2 Nedap...17
3 Solution design...19
3.1 Dictionary...19
3.2 Hypothesized Method...20
3.2.1 Preparation...20
3.2.2 Clustering...22
3.2.3 Outlier-detection...23
4 Prototype...25
4.1 Log-transformer...26
4.1.1 From logs to data...26
4.1.2 Cleaning and filtering...27
4.1.2.1 Splitting the URL...27
4.1.2.2 Selecting data...27
4.1.2.3 Cleaning data...28
4.1.3 Dataset...28
4.1.3.1 Storage...29
4.2 Preprocessing...31
4.2.1 Feature-selection...31
4.2.2 Encoding...31
4.2.3 MPR...33
4.2.4 Normalization...34
4.2.4.1 Vector-unit-norm...35
4.2.4.2 Standardization...36
4.2.4.3 Min-max Scaler...36
4.2.4.4 Wout-normalize...36
4.2.4.5 Binary processing...37
4.2.4.6 Dissimilarity matrix...37
4.3 Grouping-maker...37
4.3.1 Preprocessing...38
4.3.1.1 Client_id approach...38
4.3.2 Make groupings...38
4.3.2.1 K-means...39
4.3.3 Agglomerative clustering...39
4.4 Outlier-detector...40
4.4.1 preprocessing...40
4.4.2 Pattern finding...40
4.4.2.1 Sum-All...40
4.4.2.2 Bin-all...41
4.4.2.3 Bin-user...41
4.4.3 Detect Outliers...42
4.4.4 Isolation forest...42
4.4.5 Birch...43
5 Evaluation...44
5.1 User-groupings...44
5.1.1 Scenario 1...44
5.1.2 Scenario 2...45
5.2 Outlier-detection...46
5.2.1 Scenario 3:...46
5.2.2 Scenario 4:...46
6 Conclusion...48
6.1 How can system-logs be used to support information security?...48
6.2 What are the data-requirements that should be met by the logs?...48
6.3 How should an architecture that analyses logs be designed?...48
6.4 How does the methodology perform on data from the healthcare sector?...49
6.5 How could one approach analysing system-logs to support information security using artificial-intelligence?...49
6.6 Limitations...49
6.7 Future-work...50
7 Literature...51
1 Introduction
In today's world one will have difficulty finding a company that is not dependent on information technology(IT). Communication, finance and management are all segments within an organization that are permeated by IT. However while IT has a place in everyday live, IT-security has not(Witty, Allan, Enck, & Wagner, 2003). Neglecting information security is very dangerous for companies as revealed information can result in loss of competitive advantage, customer trust or even result in law suits(Campbell, Gordon, Loeb, & Zhou, 2003). A good understanding of a company IT-systems is necessary to improve IT-security. However most companies do not build their own software products and rely on specialist companies to supply them with information systems. These software suppliers often use software as a service(Saas) as their business model. This means software is provided to the companies under license as a black-box, these products do not require their
customers the understand the software inner workings. These software products often require users to log in and identify themselves to be able to use it. This is the first part of identity and access management(IAM), a very important part of information security for any system. The second part of IAM is access-management, this involves which user can access which part of the system. Access-management is often not done by the software suppliers themselves, but left to the companies. While this is an important and very difficult task, companies are still struggling with it(Gunter, Liebovitz, & Malin, 2011). Dhillon states that a majority of computer security breaches is done by internal employees(Dhillon, 2001). These breaches could be alleviated by proper access management. Security managers of companies that are responsible for access-management could be supported in their task with information that is automatically collected by software suppliers. Software companies receive a lot of data about their clients and often store this data as part of their services. Unfortunately this data is too large and unwieldy to be analysed manually. In order to make use of this data it must be transformed and analysed to ensure only interesting information is shown to the security manager. The field of data-mining already has answers to this problem by proposing techniques and algorithms to analyse large amounts of data. An autonomous system that empoys data-mining techniques could analyse the data for anomalies that are then represented to a security manager. These anomalies could then be investigated and used to improve information security.
It has been mentioned that the data will serve as input for such a system is already collected by most companies. Audit-trails of data-transactions is such an example, since most companies are required by law to collect such data. Finding an effective way to processes and store this data has been given priority over analysing it due to the large amount of data that is generated each day. Storage
methods that are often used to store this data are of a type that makes it hard to analyse the data efficiently, an example of this is magnetic tape. In cases were companies are actively analysing the data, priority is given to creation of business intelligence that supports in getting a competitive advantage over competitors. When taking a security perspective audits are used after the fact. After an incident has happened, the data is used to gain more information on the impact of the incident. Using the audits to improve the internal security of the information system has been mentioned in theory, but few concrete ways of how companies are doing this are given. The internal security of an information system is important, however, especially when working with sensitive personal data such as in the healthcare industry. The protection of personal data should give incentive to
companies to ask their software suppliers to create a system as this thesis proposes. Financial considerations are always a factor and standardizing and storing data could prove expensive. As a proof of concept less expansive data should be used.
A relatively novel approach would be to make use of an inherent characteristic of SAAS products.
Saas products are often build using an software-oriented architecture(SOA). A common principle of Saas is that of standard service contract, which entails that communications between services are standardized. This means that applications communicate to each other in a similar manner, they all speak the same language as it were. Since all inter-application communication is done in the same language, the logs of these messages will also be standardized. These logs could make for a good source of data, it should be noted however that only part of the actions a user makes is covered in these logs since only inter application-communication is logged. While this is a disadvantage the upset is that there is less of it which makes it easier to store. These logs still provide a lot of insight in actions made by users on the system, since every time a users requires information not present on his current application a message is logged. Another advantage is that the standard format of the logs makes the process of preparing the data to allow for analysing a lot easier.
Hence, using logs of all inter-application communication generated by Saas products allows for data that is easier to store and analyse because less preparation is required because of the standard format. This would reduce the need for software suppliers to make investments, which would make them more inclined to offer the system this thesis proposes as a service.
This thesis proposes a methodology that allows for the creation of a system that detects anomalies in data collected by companies. These anomalies could provide security managers with clues to improve information security. Logs of inter-application communication are used as input as a alternative to audit-trails. Including this business perspective makes this research interesting for businesses and researchers alike.
1.1 The problem statement
Companies could improve their information security with the logs their systems collect each day. Analysing these logs manually would be a difficult and time-consuming process since a lot of data is generated each day. An automated system should be made that analyses the data and provides only interesting occurrences in the data to be evaluated further. Techniques from fields such as data-mining and artificial intelligence could potentially be used to create such a system.
However when researching this topic it was found that there is limited knowledge available on how to approach the creation of such a system. A methodology that is a guide towards a practical
implementation of a system that makes use of artificial intelligence to analyse logs should be readily available. This thesis proposes such a methodology. The methodology will focus on detecting deviant behaviour of users. These users are employees of companies that use the the system while performing their job. This methodology would be a step towards a more secure world that allow for companies to make use of the information available to them.
1.2 Research questions
To create the methodology proposed in the problem statement the following research question has been formulated.
How could one approach analysing system-logs to support information security using artificial-intelligence?
Several sub-questions are used to answer this question:
1. How can system-logs be used to support information security? 2. What are the data requirements that should be met by the logs? 3. How should an architecture that analyses logs be designed?
4. How does the methodology perform on data from the healthcare sector?
1.3 Research methodology
manner.
1. Purpose and scope
◦ The goal of the system and the context it should be applied in should be clear. The scope and the boundaries should also be defined in conjunction. Chapter 1 has been dedicated to this component.
2. Constructs
◦ The representation of the entities of interest to the theory. Chapter 2 will be dedicated to exploring the literature and subchapter 3.1 will elaborate on the terminology used during the thesis. Research question 1 can be mapped under this component.
3. Principle of form and function
◦ A blueprint of the methodology is described in chapter 3. This is an abstract description of the architecture of the methodology.
4. Artefact mutability
◦ The changes in state of the artefact that is anticipated by the theory. The answer to research question 2 describes this component. This is elaborated on chapter 3 and especially in subchapter 3.2.1.
5. Expository instantiation
◦ A prototype has been developed that will be used to represent the methodology as an expository device and for the uses of testing. Chapter 4 is dedicated to the prototype.
6. Testable proposition
◦ Truth statements will be made about the artefact. This will be done while evaluating the prototype in chapter 5. This component is represented as research question 4.
7. Justificatory knowledge
◦ The underlying knowledge about the theory. Chapter 6 will conclude by answering what can be said about how the artefact functions using the information reported on in the previous chapter.
1.4 Scope
There are many different approaches to information security. To make the project feasible in the limited amount of time available the scope has to be defined.
• The focus will be put on data-mining approaches.
• Only access-logs received by the ESB of Nedap will be used.
• Only a maximum of one month of access-logs will be analysed.
◦ While data from a year could potentially yield better results, this is not feasible within the limitations of the project.
• Solely free data-mining tools/libraries will be used.
1.5 Structure
The rest of this thesis will be structured as follows; A literature study will be presented in chapter 2, then a solution design will be given in chapter 3. Chapter 4 is dedicated to describing the prototype. The results generated by the prototype will be evaluated in Chapter 5. Chapter 6 will concluded by evaluating the methodology as a whole and discuss the limitations of the research. The chapter will finish by making recommendations for further research.
2 Literature
A common question in research is “What has already been written about this topic”. For the purpose of this thesis, the literature has been consulted on the topics of data mining and outlier detection. Subchapter 2.1 has been written as part of a separate course on the university named research topics. It forms the literary basis for choosing the approach for the methodology. In chapter 2.2 a short elaboration on Nedap can be found. This can be used to gain insight in the data that was used when testing the prototype.
2.1 Literature survey:Outlier-detection approaches
Data-mining is a field of research that receives more and more attention, one aspect of data-mining is outlier-detection. Outliers are sometimes regarded as negative disruptive instances that should be removed(Sreevidya & others, 2014). Others actively seek to find outliers due to their usefullness in certain fields, such as fraud and intrusion detection(Chandola, Banerjee, & Kumar, 2007). The detection of outliers or anomalies has a lot of potential in information security. Suppliers of software as a service(Saas) products are in group that could benefit from using data-mining and outlier-detection techniques. Saas-suppliers have access to a lot of data each day, since they can collect access-logs of their customers, some suppliers even collect audits for their customers as a service. These could provide a wealth of information, that could be used to improve the security of their products. This research aims to explore what approaches and techniques are available, to detect outliers in these logs. This is the first step towards tapping into these possibilities and developing a methodology to use access logs to support information security. Research in the field of outlier-detection has been consulted regarding this topic. This literature survey starts with conveying some concepts that will be used throughout the literature survey. Subsequently a overview will be given on the current outlier-detection approaches. This overview will be used to address which algorithms are used. With the information accumulated in the previous two
paragraphs the approaches which are applicable for the analysing of access-logs will be selected. This selection will be evaluated and the approaches with the most potential will be selected for further testing in a prototype. This results in four knowledge questions.
• Knowledge questions:
◦ What approaches are currently used in outlier-detection according to published literature?
◦ What are the algorithms used in outlier-detection?
◦ What approaches are applicable for analysing access-logs?
◦ What algorithms are most applicable for our research-problem?
2.1.1 Research goal & questions
This literature survey serves to inform the creation process of a methodology that uses access-logs to improve information security. Systems that are used by employees of organizations will generate a large amount of access-logs everyday. Extracting or “mining” knowledge from large amount of data is called data-mining(Han & Kamber, 2010, p. 5). Using those patterns is referred to as outlier-detection. To develop a outlier-detection approach it is necessary to have an insight in what research has been done in this field. The goal of this research is to provide an overview of techniques
currently used in outlier-detection. To accomplish this goal we pose two knowledge-questions: 1. What approaches are currently used in outlier-detection according to published literature? 2. What algorithms are currently used in outlier-detection approaches according to published
will be used to talk about the papers found during the literature survey. First a broad definition of data-mining and machine-learning is given, since these fields have a lot of overlap they have different meanings in different field. For this paper these fields are defined as follows. Data-mining is about discovering patterns in data and machine-learning is about being able to create assumptions from the found patterns. One could say that a data-mining approach uses a machine learning algorithm. With this distinction made, the main topics of this paragraph can now be introduced, namely the types of data and supervision. These two concepts are closely linked and will be explained in the following paragraph.
2.1.2.1 Data and Supervision
When doing machine-learning one tries to create assumptions or rules about the data, it is beneficial for understanding the data if it can be subjected to some form of order. By doing this, predictions can be made about new instances of the data. How one does this depends on the type of data available and what one wants to predict. To predict something one needs data to make predictions about. Data consists out of variables, it is important that all instances of a variable adhere to a uniform format. A lot of preprocessing in data-mining is done to ensure this uniformity of data. For example: temperature could be noted either in degrees Celsius or in degree Fahrenheit not a
combination of both. A very important question in data-mining is if one has data available that already contains the value that one wants to predict. Data that contains the value one wants to predict the data is called labelled. For example:
Say one wants to predict if people will work outside, to predict this data the variables outlook and windiness are available. An unlabelled data-set would look like Table 1:
Weather Windy
Sunny Yes
Rainy No
Sunny No
Table 1: Unlabelled data
There might be records available of when people worked outside in the past. These records are historical data that contain an extra variable, this variable would contain answer to the question if people actually worked outside that day. The predicted variable is now known, which means it can be exactly known in which weather situations people worked. A labelled data-set can be made that would look like Table 2:
Weather windy Work outside
Sunny Yes No
Rainy No No
Sunny No Yes
Table 2: Labelled data
Naturally labelled data can only be made if one knows what one wants to predict. When learning is done using label data, this is called supervised learning. In supervised machine-learning one trains a classifier with labelled data. Once the classifier has received enough training it can classify or predict new instances of the data. This new data is then naturally unlabelled.
Machine-learning without labelled data is called unsupervised machine-learning. The distinction between supervised and unsupervised is very important. Having labelled data available that can be used as trainings data is very useful. Besides supervised an unsupervised learning, semi-supervised machine-learning also exists. In this case incomplete labelled data is used as input. In the previous
example we wanted to predict if people were going to work outside. One could only have historical data from when people actually worked outside and no data of the days nobody worked outside. This data could look like Table 3:
Weather windy Work outside
Sunny Yes Yes
Sunny No Yes
Sunny No Yes
Table 3: Incomplete labelled data
Since there are no instances of data when people didn't work outside this data is not really complete. Still one can use it for machine learning. This semi-supervised method would then create a norm and would predict everything that would diverge from the norm as not a work-outside day.
To summarize if one has labelled data one can make a training-set. Using a training-set one can train a classifier this is called supervised machine-learning. If there is no labelled data available one has to do unsupervised machine learning. In the case of labelled data that is incomplete one can still train a classifier. This is called semi-supervised learning.
2.1.3 Literature search approach
The literature search was conducted with the use of keywords and the database of Scopus and Google Scholar were used to find the literature. First a preliminary search was carried out were it was discovered that some areas of outlier-detection that received a lot of attention. These areas were fraud detection, specifically credit-card fraud and healthcare insurance fraud, system intrusion detection and healthcare. These will be searched specifically for literature and besides this a more general search in outlier-detection will be done.
2.1.3.1 Key-words
In the data-mining field outlier-detection and anomaly-detection have been used synonymously, the keywords will contain synonyms to facilitate a more comprehensive search. In Table 4 an overview is presented.
Data-mining
Outlier detection Anomaly detection Deviant behaviour detection
Approach Method Technique
Survey Literature study Overview Review
Pattern recognition Behaviour patterns
Logs Access-logs Event-logs
Table 4: Overview of keywords and synonyms
These keywords were used mostly in combination with one or two others to make sure literature related to data-mining and outliers-detection was primarily encountered.
2.1.3.2 Fields
Fraud
Credit-card fraud Insurance fraud Healthcare
[image:11.595.60.542.54.157.2]System intrusion detection IDS Intrusion detection systems
Table 5: Overview of fields and synonyms
2.1.3.3 Inclusion & Exclusion
To only include papers that are relevant to the research. Some criteria have been made.
• Inclusion criteria
◦ The paper is directly related to outlier-detection
• Exclusion criteria
◦ The paper is not written in English
◦ The paper is only about knowledge discovery via pattern discovery
◦ The paper is not about outlier-detection.
◦ The paper is only theoretical and does not apply the outlier-detection technique in a practical context.
◦ Papers that focus on outlier-detection for the sake of removing them from the data set, for better pattern recognition.
◦ The paper assumes infinite time and money is available and doesn't look at optimization.
◦ The paper is not available in full text
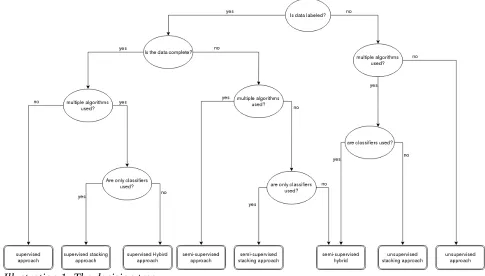
2.1.4 Findings
This chapter lists the findings found in the literature. This is done in two step approach related to the knowledge questions mentioned at the start of this survey. In step one we use a decision tree to order all found literature on type of outlier-detection approach used. This tree uses questions about the approach used in the paper to classify it as one of eight approaches. The tree can be found in Illustration 1. The eight approaches the tree concludes with are as follows:
Type of approach Elaboration
Supervised approach Only one supervised algorithm is used. This algorithm is a classifier trained with labelled data.
Supervised stacking approach Multiple supervised algorithms are used. These algorithms are classifiers trained with labelled data.
Supervised hybrid approach Multiple algorithms are used on label data. Where at least one algorithm is unsupervised.
Semi-supervised approach Only one supervised algorithm is used on incomplete-labelled data. This algorithm is a classifier trained with incomplete labelled data.
Semi-supervised stacking approach
Multiple supervised algorithms are used on an incomplete-labelled dataset. These algorithms are classifiers trained with incomplete-labelled data.
Semi-supervised hybrid approach Supervised and unsupervised algorithms are combined on an unlabelled or incompletely labelled data-set.
Unsupervised stacking approach Multiple unsupervised algorithms are used on an unlabelled
dataset.
[image:12.595.45.530.363.639.2]Unsupervised approach An unsupervised algorithm is used on an unlabelled data-set.
Table 6: Overview of the approaches that result from using the decision tree. On the right a short explanation is given per approach.
During the literature survey the problem arose of lack of uniformity on classifying outlier-detection approaches. Research surveys group outlier-detection techniques in different ways. For this survey a simple and effective grouping was needed. The division presented in Illustration 1 is based on the several surveys on outlier-detection found in the literature. The most common type of division were based on type of supervision or type of algorithm. When grouping on type of supervision (Phua, Lee, Smith, & Gayler, 2012) and (Agrawal & Agrawal, 2015) recognize a fourth group, besides supervised, semi-supervised and unsupervised. This hybrid group refers to the combining of multiple techniques. An example of an hybrid approach is to combine unsupervised and supervised techniques. By first making use of unsupervised techniques like clustering, to label the data, the labelled data can then be analysed with supervised techniques. (Phua et al., 2012) uses the term stacking to describe approaches that use multiple similar algorithms on the same data-set to increase the accuracy of predictions. These terms have been incorporated in the decision tree. The paragraph 2.1.4.1 the findings will be presented per type of approach and in paragraph 2.1.4.2 all algorithms are presented divided in supervised and unsupervised.
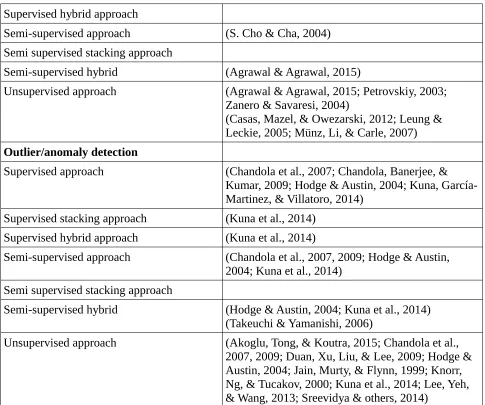
2.1.4.1 What are the different approaches used for outlier-detection?
The following areas have received a lot attention by outlier-detection researchers these are: Creditcard-fraud, insurance fraud, system intrusion and healthcare. Table 7 presents the type of approaches used per field.
Type of approach Author
Credit card fraud
Supervised approach (Ngai, Hu, Wong, Chen, & Sun, 2011; Phua et al.,
2012; Raj & Portia, 2011; Sharma & Panigrahi, 2013; Wang, 2010; Yue, Wu, Wang, Li, & Chu, 2007)
Supervised stacking approach (Ngai et al., 2011; Phua et al., 2012; Raj & Portia, 2011; Sharma & Panigrahi, 2013; Wang, 2010; Yue et al., 2007)
Supervised hybrid approach (Phua et al., 2012; Raj & Portia, 2011)
Semi-supervised approach (Phua et al., 2012; Raj & Portia, 2011; Sharma & Panigrahi, 2013)
Semi supervised stacking approach (Phua et al., 2012)
Semi-supervised hybrid (Phua et al., 2012; Raj & Portia, 2011; Sharma & Panigrahi, 2013)
Unsupervised approach (Kou, Lu, Sirwongwattana, & Huang, 2004; Ngai et al., 2011; Phua et al., 2012)
Healthcare fraud
Supervised approach (Aral, Guvenir, Sabuncuoglu, & Akar, 2012; Joudaki et al., 2015; Ngai et al., 2011)
Supervised stacking approach (Aral et al., 2012) Supervised hybrid approach
Semi-supervised approach (Aral et al., 2012)
Semi supervised stacking approach (Aral et al., 2012)
Semi-supervised hybrid (Joudaki et al., 2015)
Unsupervised approach (Aral et al., 2012; Joudaki et al., 2015; Ngai et al., 2011)
Healthcare
Supervised approach (Farrell, Groshen, MacGibbon, & Tomberlin, 2010; Tomar & Agarwal, 2013)
(Hauskrecht et al., 2016) Supervised stacking approach
Supervised hybrid approach
Semi-supervised approach (Farrell et al., 2010) Semi supervised stacking approach
Semi-supervised hybrid
Unsupervised approach (Bouarfa & Dankelman, 2012)
Intrusion detection
Supervised approach (Agrawal & Agrawal, 2015; S.-B. Cho & Park, 2003; Huang & Lee, 2003; Petrovskiy, 2003) Supervised stacking approach (Agrawal & Agrawal, 2015; Perdisci, Gu, & Lee,
2006; Petrovskiy, 2003)
Supervised hybrid approach
Semi-supervised approach (S. Cho & Cha, 2004) Semi supervised stacking approach
Semi-supervised hybrid (Agrawal & Agrawal, 2015)
Unsupervised approach (Agrawal & Agrawal, 2015; Petrovskiy, 2003; Zanero & Savaresi, 2004)
(Casas, Mazel, & Owezarski, 2012; Leung & Leckie, 2005; Münz, Li, & Carle, 2007)
Outlier/anomaly detection
Supervised approach (Chandola et al., 2007; Chandola, Banerjee, & Kumar, 2009; Hodge & Austin, 2004; Kuna, García-Martinez, & Villatoro, 2014)
Supervised stacking approach (Kuna et al., 2014) Supervised hybrid approach (Kuna et al., 2014)
Semi-supervised approach (Chandola et al., 2007, 2009; Hodge & Austin, 2004; Kuna et al., 2014)
Semi supervised stacking approach
Semi-supervised hybrid (Hodge & Austin, 2004; Kuna et al., 2014) (Takeuchi & Yamanishi, 2006)
[image:14.595.56.541.53.458.2]Unsupervised approach (Akoglu, Tong, & Koutra, 2015; Chandola et al., 2007, 2009; Duan, Xu, Liu, & Lee, 2009; Hodge & Austin, 2004; Jain, Murty, & Flynn, 1999; Knorr, Ng, & Tucakov, 2000; Kuna et al., 2014; Lee, Yeh, & Wang, 2013; Sreevidya & others, 2014)
Table 7: Overview of type of approach and list of authors that use or mention them. The papers are by grouped by field of application and then ordered using the decision tree presented in Illustration 1.
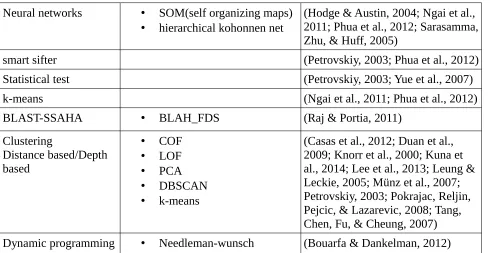
2.1.4.2 What are the different algorithms used in outlier-detection?
With the overview made in paragraph 2.1.4.1 a broad understanding on what the approaches are used in the different fields. The next step is to give an overview of the algorithms used during every approach. At least one algorithm is essential to perform the actual machine learning. While there are many different approaches, this paper proposes that algorithms can be divided in two groups, these being supervised and unsupervised. This division by supervision was also used when grouping approaches, but then semi-supervised and hybrids were added. A semi-supervised approach is actually a supervised approach using incomplete data and hybrids are combinations of multiple algorithms, these can be supervised and unsupervised. So while approaches can have four types of supervision, algorithms only have two, namely supervised and unsupervised. In table 5 the different algorithms can be found.
Algorithm Specific algorithms Authors
Supervised
Support vector machines
Neural networks • RBF
• Fuzzy
• Auto-associative
(Hodge & Austin, 2004; Ngai et al., 2011; Phua et al., 2012; Raj & Portia, 2011; Sharma & Panigrahi, 2013; Yue et al., 2007)
Bayesian networks • Stage
• Bayesian Belief Network
(Ngai et al., 2011; Phua et al., 2012; Raj & Portia, 2011; Sharma & Panigrahi, 2013)
Naive bayes • Adaboosted (Ngai et al., 2011; Phua et al., 2012;
Sharma & Panigrahi, 2013)
Decision trees • Boolean logic
• Atree
• CART
• c4.5
(Huang & Lee, 2003; Kuna et al., 2014; Ngai et al., 2011; Phua et al., 2012; Sharma & Panigrahi, 2013)
Rule-based • Ripper
• Slipper
• Association rule
• Prism
(Kuna et al., 2014; Ngai et al., 2011; Phua et al., 2012)
Case-based reasoning(CBR)
(Phua et al., 2012)
Regression • Multinominal logistic
model(MNL)
• nested multinominal logistic model(NMNL)
• model-averaged
• Auto regression
• hierarchical Bayes
(Petrovskiy, 2003; Phua et al., 2012; Sharma & Panigrahi, 2013; Yue et al., 2007)(Farrell et al., 2010; Takeuchi & Yamanishi, 2006)
Nearest Neighbour
Method (Ngai et al., 2011; Petrovskiy, 2003;Sharma & Panigrahi, 2013)
Hidden Markov Model (S.-B. Cho & Park, 2003; Ngai et
al., 2011; Raj & Portia, 2011) Evolutionary
algorithms •
Genetic algorithm
• fuzzy genetic algorithm
(Ngai et al., 2011; Phua et al., 2012; Raj & Portia, 2011; Sharma & Panigrahi, 2013)
Dempster-shafer and
bayesian learning (Raj & Portia, 2011)
Bayesian estimation (S. Cho & Cha, 2004)
unsupervised
Link analysis (Phua et al., 2012)
Graph mining (Akoglu et al., 2015; Phua et al.,
2012)
Neural networks • SOM(self organizing maps)
• hierarchical kohonnen net
(Hodge & Austin, 2004; Ngai et al., 2011; Phua et al., 2012; Sarasamma, Zhu, & Huff, 2005)
smart sifter (Petrovskiy, 2003; Phua et al., 2012)
Statistical test (Petrovskiy, 2003; Yue et al., 2007)
k-means (Ngai et al., 2011; Phua et al., 2012)
BLAST-SSAHA • BLAH_FDS (Raj & Portia, 2011)
Clustering
Distance based/Depth based
• COF
• LOF
• PCA
• DBSCAN
• k-means
[image:16.595.57.547.54.307.2](Casas et al., 2012; Duan et al., 2009; Knorr et al., 2000; Kuna et al., 2014; Lee et al., 2013; Leung & Leckie, 2005; Münz et al., 2007; Petrovskiy, 2003; Pokrajac, Reljin, Pejcic, & Lazarevic, 2008; Tang, Chen, Fu, & Cheung, 2007) Dynamic programming • Needleman-wunsch (Bouarfa & Dankelman, 2012)
Table 8: List of algorithms used in the approaches found Table 7. Order by algorithm, alternative adaption of algorithm and authors, that mention them.
2.1.5 Discussion
A lot of interesting research has been done in the field of outlier-detection. Especially the field of credit-card fraud receives a lot of attention. The application of outlier-detection techniques in this field seems promising. The lack of an uniform way of classifying outlier-detection techniques was surprising however, especially when comparing multiple fields uniformity seems to be limited. This obfuscates the papers and limits the practical use of a paper in an organizational setting. It could be valuable to perform more research in developing a classification standard for outlier-detection techniques that is applicable in multiple fields.
Another surprising discovery was that a large amount of research focuses on supervised outlier-detection techniques. This requires labelled data and is more difficult to produce. Historical data can be used to make labelled data, but there are problems with this. Many companies do not have a lot of historical data easily accessible when they start to consider data-mining projects. When a lot of historical data is available it is very unlikely the data will be in a format that would require limited preprocessing. Besides this, a bigger problem lies in the nature of outliers. Outliers are just a
deviation from the pattern. If one specifically searches for specific outliers any change in behaviour intentional or unintentional would hamper the detection system. Instead of using historical data, one could create labelled data. This is however often expensive and time-consuming. These
considerations seem to make supervised outlier-detection techniques less usable in an organizational context. Therefore an unsupervised approach seems to be more interesting, but the lack of accuracy could be an issue. Hybrid approaches could solve this, since they combine unsupervised and
supervised techniques. Especially in organizational context a focus on unsupervised and hybrid techniques seems fitting.
In an organizational context it is felt this paper would help with quickly sieving approaches so the outlier-detection approaches can be found that are usable in the organizations problem context. The decision tree shown in Illustration 1 should be helpful in this regard.
2.1.6 Limitations
broad and relatively new field of research, outlier-detection is a niche in this field. The lack of a standard framework for data-mining techniques creates a need for interpretation from the reader. Evaluating these interpretations is difficult. Since some fields have received more attention than others, approaches for outlier-detection are focused on the specific problems in these fields. This would mean that problems in other fields of outlier-detection would receive less attention, limited attention has been given to this problem.
Another limitation is the focus on outlier-detection approaches. These approaches are used in an organizational setting. This means that paper with a purely mathematical focus on finding the best outlier-detection algorithm might have been excluded.
Papers that where not translated in English have been excluded because of practical reasons. It is assumed that papers are available in English that have similar approaches to outlier-detection techniques.
Papers have been encountered that were not freely accessible when using the network of the Utwente. These papers have not been included in the survey.
2.1.7 Conclusion
This research introduces concepts to better understand data-mining and outlier-detection. A decision tree is presented that helps grouping different outlier-detection approaches. This tree is used to group the outlier-detection techniques found in the literature. The algorithms used by the
approaches are presented in Table 8. The findings and the understanding gained during this survey will be used to support the creation of a methodology for analysing access-logs. This means a number of approaches and algorithms that fit with those approaches will be selected from the literature presented in this survey. These approaches will then be tested, to see if they perform adequately in the methodology. This survey will serve as the backbone for approach and algorithm selection in creating an outlier-detection methodology for analysing access-logs. The research questions that will be used to create the methodology, the first three questions can be linked to steps in the methodology and the fourth questions will address the validation of the methodology, the research questions are as follows:
1. How should access logs be preprocessed? 2. How can user groups be discovered in the data? 3. How can we find users that show deviant behaviour? 4. How can the methodology be validated?
These research questions will be answered in follow-up research and should prove sufficient to develop a methodology that uses outlier-detection techniques to detect deviant behaviour by data-mining access-logs.
2.2 Nedap
The data to evaluate the logs has been provided by Nedap Healthcare. This subchapter will discuss who Nedap is and why their logs are applicable to an organizational context. Nedap healthcare is software supplier for the Dutch healthcare market. They provide their Saas product named “Ons” to a multitude of companies active in healthcare. “Ons” is a large software packet that aspires to take care of every need a caretaker has regarding their IT-system. These needs are fulfilled by different applications that combined together make up “Ons”. For example the application “Agenda”
supports all schedule activities and “Dossier” provides access to patient information and care-plans. Currently “Ons” makes use of an Enterprise service bus, ESB for short. The ESB handles all
communication between applications. Every communication attempt is logged when it arrives at the ESB. The logs used in this thesis are logs that have been generated by users of “Ons” between the first of September and the last of November in the year 2017. This data only consist of inter-application communication, and are less expansive than the audit-trails. In compressed form these
log still took up 80 gigabyte in space.
3 Solution design
This chapter will be dedicated to elaborating on how the solution will be designed. As a whole this chapter should be seen as a blueprint of the methodology. Before describing this blueprint it should be clear how the terms and context are defined, chapter 3.1 will ensure this. The information described in this chapter should ensure that it is understood in which situations the methodology is applicable. After the language this thesis uses is clarified, the methodology can be discussed. In chapter 3.2 a hypothesised end product of the methodology will be presented. An architecture-model will be used as a guideline to understand how the methodology is designed. The chapter will end with a summary of the solution design.
3.1 Dictionary
[image:19.595.57.540.275.723.2]This subchapter will be dedicated to defining terms and definitions used throughout the paper. In Table 9 a list of definitions can be found and Illustration 2 shows the relation between some of these terms.
Term Definition
Log A list of requests to a system
Request An attempt to add, change or receive information from the system.
A request is considered instant and finite, as such it can be represented by single indication of time.
Resource The specific type of information a request is influencing.
User An entity that has identified itself to the system and can make requests. Action An user making a request.
Subject The entity that the resource is about.
Behaviour The culmination of all the requests made by an user to the system.
Deviant-behaviour One or a couple of request made by an user that deviant from what should be normal for that user. Entry Data that was created using requests of one unique user.
Table 9: Definitions
[image:19.595.64.539.547.768.2]Following the clarification the language this thesis uses, the solution design will be discussed.
3.2 Hypothesized Method
This section will be dedicated to describing the artefact that should result from the proposed methodology. As the literature in chapter 2.1 suggests the process which transforms data to outliers can be split in multiple parts. One part should focus on the grouping of users and and another part should be the detection of outliers. The reason for this is that deviant requests can be found by detecting behaviour that deviates from normal behaviour. This normal behaviour is found by grouping users together that broadly have similar behaviour. Therefore the grouping of users should be accomplished first. This grouping will be done with clustering algorithms and the outliers will be detected using outlier-detection algorithms. This suggests a hybrid approach as mentioned in the literature. The bpmn-model seen in Illustration 3 is the full representation of the method and its parts. The rest of this chapter will be dedicated to describing every part of the model. As can be seen the model is split up in groups: preparation, clustering and outlier detection. These will form the structure for the coming subchapters. Every subchapter will start with a short summary of the overarching process, then some details of the process will be discussed and the subchapter is concluded with a overview of the different subprocesses.
3.2.1 Preparation
In any real-world scenario it would be reasonable to suspect that the logs should need some preparation before they can be analysed. These actions can be done completely separate from the rest of the processes. When the data is prepared appropriately the other processes will proceed
smoother, so it should be done well. The first task is to receive logs. These log are the source of information for the entire process. In Illustration 2 one can see the class-model that is most desirable to have as input. The method still works, however, on less complete input. It should be noted that when talking about incomplete input data, there is a big difference between the lack of a complete variable and a variable being logged inconsistently. It is assumed that when a variable is part of a request in the log. That variable is logged consistently for every request in a log. The core input is the request, but knowing only the fact that something was done on the system is not enough. There are two pieces of information that are critical for the methodology to work.
First, there should be an insight in which user filed the request. As such there should be a way to identify different users. As can be seen the most convenient method is to have a user-id. Other forms of identification are also valid, for example an session-id or IP-address. At this point one can see which users made requests to system.
The second piece of critical information is a way to differentiate between different request. This could be very simple information such as a timestamp, if the request was successful. The optimal solution would be to differentiate using resource. When only using resource the differentiate an issue could arise, which is best explained by an example. if a system is purely used to retrieve telephone numbers, knowing that the resource requested is a telephone will not be very useful. In this case knowing the subject, the person that the telephone-number belongs to, would allow for a lot more differentiation. If besides retrieving telephone-numbers users could also change the numbers in the database, then that could be a source of differentiation as well. In this case a subject would be valuable but not necessary. Hence both resource and subject are optional as long as there is some way to differentiate between different requests.
If a system consists of different applications that work closely together, knowing which application was the target of a request would allow for differentiating between variables. In this case an
application id is useful but not required. Now it is evident what information is necessary the class-model has properly been discussed, unfortunately this does not cover everything that is required from the input. It would be beneficial that the data used to create user-groupings spans a period of time. It is assumed that user behaviour standardizes over time, this would decrease the effect irregularities might have on the clustering process.
Requirements have been developed keeping the above in mind. To use the logs each request in that log should full-fill the two critical requirements. A set of optional requirements have been added that would be convenient but are not necessary.
Critical requirements.
1. The request should be related to an user, for example the user-name is part of the log line. 2. One can differentiate between requests.
Optional requirements:
1. The request should be associated with a date and time.
2. Information should be available if the request was completed successfully or not.
3. If the logs consists of requests made by users of different companies, requests or should be associated to their respective company.
4. The resource that was requested or manipulated should be provided.
5. If a resource is about a subject, the log-line should be relatable to that subject.
It is highly likely that the requirements can not be ensured when supplying the logs as input, but after proper filtering the requirements can be fulfilled. Ensuring that requirements are met should be the first step of the cleaning and filtering process. During this step any request that does not full-fill the requirements should be removed from the dataset. The cleaning and filtering process purpose is to transform al the requests in a log to a standard format that can be added to the dataset. Every variable that is going to be analysed should have the same format across the entire dataset.
The end of the preparation phase should be an addition to the dataset. The dataset should consists of
requests without any missing variables, where each variable is easy to access. So different combinations can be used as input in the following phases.
Process name Input Output activity Analysis
technique
Receive logs System logs List of parsed requests
All information to each unique request is parsed into an array of variables.
-Cleaning & filtering
List of parsed request
Filtered list of requests
All requests that are not meeting the requirements are removed from the dataset.
-Update requests Filtered list of requests
Updated dataset The requests are added to the dataset in an standard format.
-Table 10: overview of the preparation processes
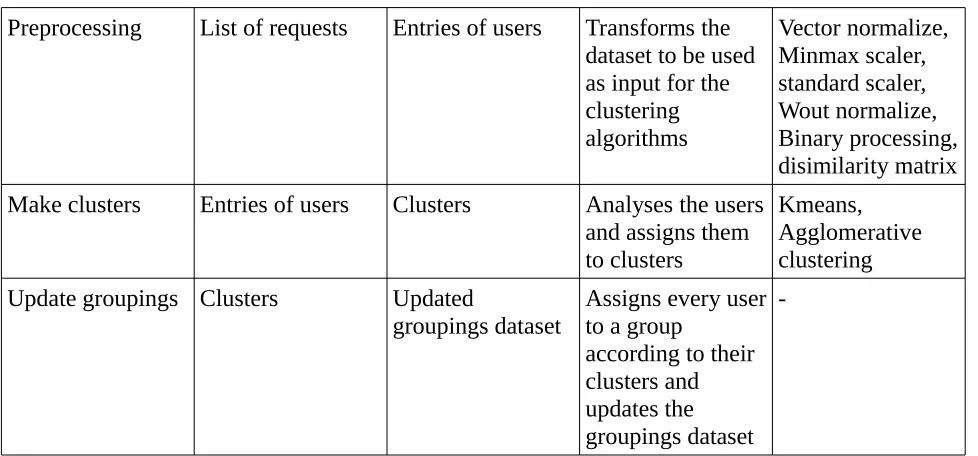
3.2.2 Clustering
The dataset will be used to group users of similar behaviour using clustering algorithms. As
mentioned earlier when grouping users the dataset should be standardised, as such in the model the start-event only triggers monthly. This way when retrieving data from the dataset it will span a period of time and will be standardised. This data will serve as input in the preprocessing process. The goal of this process is to transform the data so that the clustering algorithm can analyse the data and create clusters. Since it’s purpose is to create clusters of users, the data needs to be transformed to a format where every entry is one user. When inputted the data is a list of requests over a time period and many users will have made multiple requests. These requests made by the same user must be aggregated to concisely represent the user. This can be approached in multiple ways and in chapter 4.2 preprocessing methods used in the prototype are described in detail. Clustering
algorithms have differences in the type of data they accept, so part of the preprocessing is dependent on what algorithm is used for clustering. Preprocessing also has an influence on the clustering however, import parts are feature selection and normalization. Feature selection refers to selecting specific variables from the dataset to use as input for the algorithms. It requires
experimentation to know which features to select.
After preprocessing is done the cluster algorithm will make clusters of users. Every clusters represents a group of users with similar behaviour. The users will be linked to their respective groups and added to the group-dataset.
Process name Input Output activity Analysis
technique
Retrieve data Dataset, specific details
List of request Retrieves from the dataset a certain group of requests according to the specified details.
[image:22.595.54.540.639.750.2]-Preprocessing List of requests Entries of users Transforms the dataset to be used as input for the clustering algorithms Vector normalize, Minmax scaler, standard scaler, Wout normalize, Binary processing, disimilarity matrix Make clusters Entries of users Clusters Analyses the users
and assigns them to clusters
Kmeans, Agglomerative clustering Update groupings Clusters Updated
groupings dataset
Assigns every user to a group
according to their clusters and updates the groupings dataset
-Table 11: Overview of the clustering processes
3.2.3 Outlier-detection
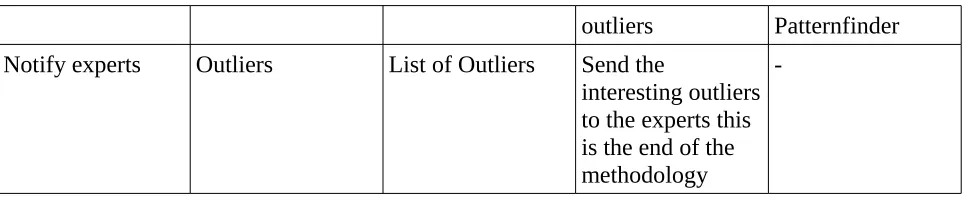
The group-data created in the clustering phase will be used to select only users in the dataset with similar behaviour. This dataset will then be preprocessed, the same considerations apply as when clustering with one exception. User behaviour does not have to be aggregated into a single entry. A valid method is to do outlier-detection on all request in the group without taking the user into account. The preprocessing output is still dependent on the outlier-detection algorithm however. The outlier-detection algorithms output will be outliers, these have to be judged by an expert. When experimenting the outliers need to be checked for validity and when in practical use the outliers are send to an information officer to analyse and act upon. Since a human element is involved the outlier detection algorithm should not generated a lot of false positives so that the amount of information sent to the officer stays manageable. This methodology stops at the end of the outlier-detection process, the process of judging the outliers is very dependant on the type input. The outliers found should be analysed to find deviant behaviour. The outliers are the output that will support information security, by presenting them to information security officers.
Process name Input Output Activity Analysis
technique
Retrieve data Dataset, user-grouping, specific details
List of requests Select the requests of users associated to the specified group according the the specified details
-Preprocessing List of requests List of requests Transforms the dataset to be used as input for the outlier-detection algorithm Vector normalize, Minmax scaler, Standard scaler, Wout normalize, Binary processing Detect outliers List of requests Outliers Analyses the
requests for
Isolation forest, Birch,
[image:23.595.56.545.53.281.2]outliers Patternfinder Notify experts Outliers List of Outliers Send the
interesting outliers to the experts this is the end of the methodology
-Table 12: Overview of the outlier-detection processes
The methodology only works in a certain context, the terms used to describe this context is
[image:24.595.58.541.54.153.2]4 Prototype
The hypothesized method will be tested with an expository instantiation. This prototype has been used to experiment with different approaches. The Archimate modelling language has been used to model the architecture of the prototype, this model can be found in Illustration 4(Iacob, Maria Eugenia et al., 2012). The model is split up in a business layer and an Application layer. Colour-coded yellow and blue respectively. The business layer shows the moment where the user has to interact with the process. The application layer represents the systems of the prototype. As can be seen the prototype is split up in three applications. Each application has a specific function that coincides with the phases as described in chapter 3.2. This chapter will dedicate a subchapter to each application. The subchapter will consist of a broad overview of the function of the application and then go into detail in explaining the application logic.
4.1 Log-transformer
Preparation is the first part of the methodology and this application is responsible for that process. In a real world scenario it is quite uncommon to receive the dataset in the exact format that is needed. The preparation process purpose is to change the input to a clear and defined format that can be used as input for the other applications. Its output is a dataset as can be seen in Illustration 4. This dataset should consist of requests that are represented by different variables, that dataset should allow for the detailed selection of request and variables of request. So that different approaches can be experimented with. The preparation process primarily consist of two sub-process, namely that of cleaning and filtering. These sub-process are interwoven with each other. This subchapter should give a clear view of how the input that is used for the other application has come to be.
4.1.1 From logs to data
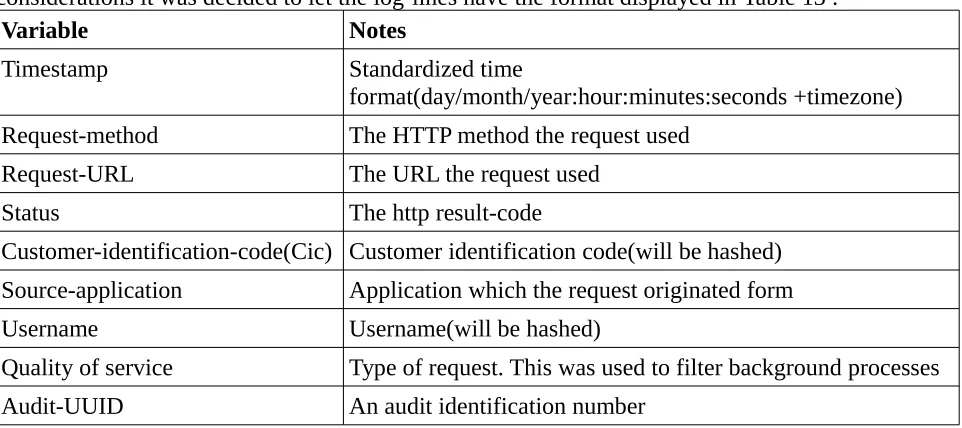
Access-logs are not uniform and the type of logs and the information stored in these access-logs are dependent on the supplier of the access-logs. Nedap provided the access-access-logs used in this research, this has been done using Nginx. In Ons(Nedaps Saas) Nginx serves as a reverse proxy server situated in front of the ESB. This access-logs consisted of lines and each line represents a request as defined in chapter 3.1. Therefore in this case a collection of log-lines is equal to a collection of requests. Nginx allows for some freedom when defining what a log-line consists of. After some considerations it was decided to let the log-lines have the format displayed in Table 13 :
Variable Notes
Timestamp Standardized time
format(day/month/year:hour:minutes:seconds +timezone)
Request-method The HTTP method the request used
Request-URL The URL the request used
Status The http result-code
Customer-identification-code(Cic) Customer identification code(will be hashed) Source-application Application which the request originated form
Username Username(will be hashed)
Quality of service Type of request. This was used to filter background processes
[image:26.595.59.540.340.554.2]Audit-UUID An audit identification number
Table 13: Example log-line
An example log-line would look like this, The SubjectID, CustomerID and Username are replaced by dummy-data for obvious reasons:
Variable Example
Timestamp 02/Oct/2017:06:34:34 +0200
Request-method GET
Request-URL /uc/clients/12345/main_address
Status 200
Customer-identification code(Cic) Cu1234
Source-application(Src) Deployment
Username User1
Quality of service
-Audit-UUID
-Table 14: The example log-line split up according to variable
A collection of log-lines such as the example log-line seen here is the actual input given to the preparation process. The data will now be transformed to meet the specified requirements and added to the dataset.
4.1.2 Cleaning and filtering
The cleaning and filtering processes are tightly interwoven. During this process the critical
requirements defined in chapter 3.2.1 will be ensured and when possible optional requirements will also be fulfilled. After the cleaning and filtering the output should be ready to be added to the dataset. The following subchapters will consist of examples on how this was achieved. 4.1.2.1 Splitting the URL
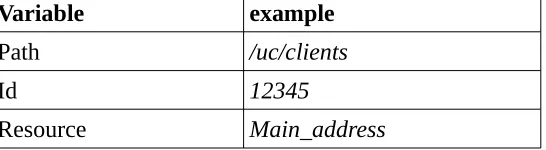
Request-URL is the variable that gives the most information about the kind of action that the user is performing on the system. In the example, Request-URL is “/uc/clients/12345/main_address”. This variable actually consists of three pieces of information. These pieces of information allow for the optimal requirement described in chapter 3.2.1 to be met, this requirement is defined as: “If a resource is about a subject, the log-line should be relatable to that subject.” Because of this the request-URL has been split in three parts. These parts are Path, SubjectID and Resource. Path represent a general indication of where the requested information is situated. SubjectID and Resource are defined in chapter 3.1. In Table 15 one can find an example of such URL is split.
Variable example
Path /uc/clients
Id 12345
[image:27.595.56.541.55.252.2]Resource Main_address
Table 15: Example of how request-URL is split up.
These variables are added to the dataset as separate variables instead of request-URL. 4.1.2.2 Selecting data
Not all log-lines are relevant for the dataset, since every access-attempt on the system is regarded as a request. Some background tasks result in requests not made by users. These among other things should be removed from that dataset. The input allowed for some stricter and more detailed requirements than defined in chapter 3. Only logs meeting the following requirements have been added to the dataset:
[image:27.595.61.334.543.618.2]• The log-line must contain an user-name
• The log-line must contain an Customer-id
• The log-line must be related to an action relevant for caretakers.
◦ This requirement was met by only accepting log-lines with paths(part1/part2):
▪ part1: [uc, cc]
▪ part2: [clients, dossier, employees, evs]
4.1.2.3Cleaning data
This prototype receives as input data from a real-world company, as such it was not completely standardized. To ensure the data’s uniformity some work had to be done. For example the format described earlier when splitting up the request_URL was not always possible. In some cases the variable Resource was not always present, because when a request was made for all the data about a client the request-URL could look like this: “/uc/clients/12345”. In Nedap’s case this URL means that a overview is requested. These kind of exceptions to the rules had to be accommodated for in the prototype.
A special mention should be given to the following URL: “/uc/clients/multiples?
id=12345id=12346id=12347”. This URL request information about multiple client_ids at once. Since this had to be represented somehow, it was decided to make an unique log-line per id. Resulting in the preceding example changing to this:
• “/uc/clients/12345/multiples” • “/uc/clients/12346/multiples” • “/uc/clients/12347/multiples”
This approach does increase the amount of actions an user makes on the system, but it was found to be the most convenient solution to the problem.
There were other cases of Request_URL not having the standard format. When it was possible to retrieve the information needed to fill the variables Path, SubjectID and Resource this was done so, otherwise all instances of that type of request were removed from the dataset. Everything described here is part of ensuring that the output of this process consisted of requests in an uniform format.
4.1.3 Dataset
Variables Notes
Timestamp Standardized time
format(day/month/year:hour:minutes:seconds +timezone)
Request-method The HTTP method the request used
Path The URL the request used.
SubjectID Subject id(hashed)
Resource The information about SubjectID requested by User
Status The http result-code
Customer-identification code(Cic)
Customer identification number(hashed)
Source-application(Src) Application which the request originated form
[image:29.595.56.539.54.282.2]Username Username(hashed)
Table 16: The format of a log-line in a data-set
After the cleaning and filtering of the data, assurances could be made about the dataset. Some occurred implicitly because of how the data was generated by Nedaps systems. Other assurances were ensured explicitly during the cleaning and filtering.
• Implicit Assurances
◦ Every log-line contains a date.
◦ Every log-line contains a request method.
◦ Every log-line contains a path.
◦ Every log-line contains a status.
◦ Every log-line contains a source application.
• Explicit Assurances
◦ Every log-line contains an username.
◦ Every log-line contains an Customer identification code.
◦ Every log-line contains an SubjectID.
The dataset is the collection of all the output generated by the log-transformer. It ensures above all that every request and all its variables have the same format.
4.1.3.1 Storage
This prototype stored the dataset in multiple csv-files. Every csv-file consisted of all the request made by user of one customer covering 24-hour period. The 24-hour period division occurred naturally since Nedap supplied a different log file for each day. The csv-files are split by costumers since Nedap serves a variety of different types of companies. Employees of different companies could have vastly different behavioural patterns. When experimenting the ability to select data from one company proved to be convenient.
It was expected that behaviour would standardize when looking at data over a longer period of time. It became clear that merging the dataset at the start of every experiment was time consuming. Because of this multiple csv-files of the same costumer were merged together into one. This merged file contains all the requests made by users of one customer in a certain period. The timespan of these periods could for example be a week, two weeks are a month. This proved to be a faster way of loading in data when experimenting with behaviour covering multiple days.
The function of the log-transformer is to transform the logs to standardized requests that can be
added to the dataset. Each process should help to ensure this. The end result of the log-transformer application is an update to the dataset. The dataset should contain requests that consist of the
4.2 Preprocessing
The preprocessing process is part of both the grouping-maker and outlier detector applications. The details of the preprocessing process are greatly influenced by specifications made by the user and which algorithms is being used. Still there is a lot overlap between the preprocessing process of the grouping-maker application and that of the outlier-detector application. That is why a separate chapter is dedicated this process. The preprocessing process purpose is to ready the data to be used as input for the specified algorithm. Algorithms have different needs when accepting input and how they perform is very dependent on the data. The data need to be transformed in such a manner that the algorithms can properly analyse it, this can be done in vastly different ways. Illustration 4 describes three sup-processes within the preprocessing process, these are: feature selection, encoding and normalization. These will be elaborated on in the following sections.
4.2.1 Feature-selection
Feature-selection is the act of selecting the features to be used during the approach. The features that can be selected are the variables that can be selected in the dataset, for an overview see Table 16. Since the whole purpose of the master-thesis is to discover information about users. User is a variable that is always selected. This is not the case for the other variables, variables could be excluded because they are not descriptive enough, the algorithm doesn’t accept the variables format or other reasons. The features that are selected are specified when activating the prototype. The output of this process is an extraction from the dataset. This extraction is a collection of requests over certain period with only the specified variables associated to each request. In essence this process is just the selection of variables to be used as input for further processes. Hence instead of application logic some interesting observations are discussed in the rest of this subchapter.
These observations will be discussed while referring to the variables as described in Table 16. The variable Date has seen limited use as input for datasets and was mostly used to give extra context to the results. This is mainly because most algorithms did not accept dates as an input. Since the dataset has been split per company as described in subchapter 4.1.3.1 it would serve no purpose to use it as input. Status and SubjectID are more interesting variables to discuss in this context. The status variable represents the http-response code of the request. It turned out that approximately 99% of all request had a response code of 200 (success). Thus it was not really a descriptive variable for making user-groupings. Using it as input when finding outliers is not really rational, since other security system are better equipped to detect such obvious outliers.
SubjectID proved to be problematic, as companies serve a lot of different subjects. The data expanded massively when encoding the data, the concept of encoding is explained in the next subchapter. While encoding is very useful it caused the size of the data to increase. For example if a thousand users request information about a different subject each, the encoded version of the would have thousand variables per user. Since an user serves more than one subject, the hardware proved to be insufficient to handle this in a short time-frame. For this reason only one approach was made that focused purely on using the SubjectID. The next step in the preprocessing process consists of encoding this process was frequently used during the experiments. After encoding has been
explained a quick return to feature selection is made to explain the effect of encoding on the feature selection process.
4.2.2 Encoding
A quick glance at Table 17 shows that the data is relatively uniform in type, only Timestamp and Status differ from the other variables. Status represents http status requests with a value of 3 digits.
Each number represent something different. For example 200 represents success and 400 represents a bad request, this means that it is still nominal data.
Variable Format Type
Timestamp Date Ordinal
Request-method String Nominal
Path String Nominal
SubjectID String Nominal
Resource String Nominal
Status Integer Nominal
Cic String Nominal
SRC String Nominal
[image:32.595.57.260.90.278.2]Username String Nominal
Table 17: Data type overview
Nominal data cannot be used as input in the format represented here. To make it usable a method called one-hot encoding was used. The purpose of the encoding process is to transform the input in a binary table. This binary table is accepted as input by algorithms whereas nominal data is not. This is best explained with the following example. One-hot is a term used in digital circuits to describe a system where the legal combinations are only those where one value is high(hot) and al other values are low(cold). The idea is to present a variable by having a binary row with al possible options, the option the variable represent is given a value of 1(hot) and all other values are set as 0(cold). This is best explained by an example. In Table 18 you can see a table filled with two variables, Username and Path, from six hypothetical log-lines.
Log-line User Path
1 Alice Uc/employees
2 Bob Uc/clients
3 Claire Uc/dossier
4 Alice Uc/clients
5 Alice Uc/clients
6 Claire Uc/dossier
Table 18: Example dataset of six log-lines only consisting of user and path.
[image:32.595.56.546.431.564.2]