Bedside quantitative cEEG monitoring
on the Intensive Care for
comatose patients after cardiac arrest
“Continuous improvement is better
than delayed perfection.”
University of Twente
Faculty of Science and Technology
Technical Medicine
Medical Sensing and Stimulation
Master thesis
‘Bedside quantitative cEEG monitoring
on the Intensive Care for
comatose patients after cardiac arrest’
Huub Johan Lievestro,
BSc
h.j.lievestro@alumnus.utwente.nl17
thApril 2019
Graduation committee:
Prof. dr. ir. M.J.A.M. van Putten(Chairman and Technical supervisor)
Department of Clinical Neurophysiology and Neurology, Medisch Spectrum Twente, Enschede, the Netherlands. Department of Clinical Neurophysiology, MIRA-Institute for Biomedical Technology and Technical Medicine, University of Twente, Enschede, the Netherlands.
Dr. J. Horn(Medical supervisor)
Department of Intensive Care, Amsterdam UMC, location AMC, Amsterdam, the Netherlands
Drs. R.J.Haarman(Process supervisor)
Technical Medicine, University of Twente, Enschede, the Netherlands
L.M.van Loon, MSc (External member)
Biomedical Signals and Systems, Faculty of Electrical Engineering, Mathematics and Computer Science, Technical Medical Centre, University of Twente, Enschede, the Netherlands.
Department of Critical Care Medicine (707), Radboud university medical center, Nijmegen, the Netherlands.
Dr. A.F. van Rootselaar(Additional member)
Department of Neurology/Clinical Neurophysiology, Amsterdam UMC, location AMC
Acknowledgements
This thesis is the major end product of my graduation as Technical Physician. In the past year, I worked on the EEG monitoring project in the Intensive Care of the AMC. This would not have been possible without the collaboration and help of many people, and I would like to take the opportunity to thank them here.
First of all, I would like to thank my technological and medical supervisors: Michel van Putten, for sharing your knowledge and your critical thinking. Janneke Horn, for your enthusiasm and our discus-sions. Combined, you made my thesis grow shorter towards its completion, instead of longer and longer. Marjolein Admiraal, as daily supervisor, you were always there for me. Thank you for your support and pleasant collaboration. Fleur van Rootselaar, thank you for your suggestions and thinking along. Finally yet importantly, I thank Lex van Loon, not only for being the external member of my graduation committee but also for our collaboration in the past years.
I express my gratitude to the technicians of the Clinical Neurophysiology department of the AMC: without them, my study could not have been performed. Thank you for the nice collaboration, including the additional ‘gezelligheid’, and always being willing to help. From the same department, I would like to thank technician Thijs Boeree for his help with the EEG equipment and Technical Physician Wouter Potters for thinking along.
Research is not done alone, as became clear from the research group around the ICU. Thank for letting me feel part of the team, and the fun times we had. Also here, ‘gezelligheid’ was omnipresent. Special thanks to Claudio and Thijs, for being healthy volunteers in my study and to my fellow-students Rob (also for volunteering!) and Nick, for thinking together and exchanging our ideas.
I would like to thank all the ICU physicians and nurses, for their contribution to my study and the four weeks I have spent full time in clinical practice. I have learned a lot, not only medically but also about myself. Thanks for the unique opportunity to work in such a special environment.
Not all of my graduation took place in Amsterdam, as part of my personal development remained in Enschede. Rian, thank you for asking questions that made me think about myself and the things I do. I would like to thank my peer group, Karin, José and Maarten, for the interesting and open intervision meetings we had.
Also from Enschede: the ÜberGroteGezelligeGroep (ÜGGG). We have emerged about six year ago and since then spread across the Netherlands, but yet are still together. Thanks for being such a diverse group of friends. Especially, a huge thank you to Rutger, not only for our good friendship but also for proofreading my thesis and providing feedback from a fresh point of view.
Contents
Page
Abstract i
List of abbreviations iii
1 Introduction and rationale 1
1.1 BrainStatus electrode set . . . 1
1.2 CRI algorithm . . . 2
1.3 Aims of this study . . . 2
2 Research questions 3 2.1 Main question . . . 3
2.2 Subquestions BrainStatus . . . 3
2.3 Subquestions CRI . . . 3
3 Methods 5 3.1 Study population . . . 5
3.2 Outcome assessment . . . 5
3.3 cEEG recordings . . . 5
3.4 EEG epoch selection and montages . . . 6
3.5 BrainStatus . . . 7
3.6 CRI algorithm . . . 8
4 Results 9 4.1 BrainStatus . . . 9
4.2 CRI algorithm . . . 12
5 Discussion 15 5.1 BrainStatus . . . 15
5.2 CRI algorithm . . . 16
5.3 Clinical utility of cEEG monitoring after CA . . . 18
6 Conclusion 21 7 Future research and development 23 7.1 Future research on the BrainStatus and CRI . . . 23
7.2 Future development of cEEG monitoring in the ICU . . . 23
References 25
Appendices
Samenvatting
Introductie: Elektroencephalogram (EEG) patronen binnen 24 uur na een hartstilstand kunnen
be-trouwbaar worden gebruikt om de neurologische uitkomst te voorspellen. De registratie van het EEG kan versimpeld worden door het gebruik van een minder uitgebreide elektrodeset. Vervolgens kan een algoritme-ondersteunde cEEG beoordeling gebruikt worden om interessante regio’s uit de grote hoeveel-heid data te identificeren en ondersteuning te bieden aan minder getrainde lezers. In onze duale studie hebben we een sub-haarlijn EEG sticker (BrainStatus) vergeleken met een 9-kanaals full-head (FH) elektrodeset. Ook is een 4-kanaals frontotemporale (FT) montage afgeleid van de FH-set. Vervolgens werden deze FH/FT-montages gebruikt om het bestaande Cerebral Recovery Index (CRI) algoritme te hertrainen.
Methode: De EEG’s werden tegelijkertijd geregistreerd met de FH-set en de BrainStatus, bij
opeen-volgende volwassen patiënten opgenomen na een hartstilstand. Hierin werden EEG-patronen visueel gescoord in epochs van 5 minuten op 24 uur na hartstilstand, en de scoringsovereenkomst werd geëvalu-eerd met behulp van confusion matrices en Cohen’s kappa.
Het CRI-algoritme werd opnieuw getraind op 79 EEG’s na een hartstilstand vanaf maart 2014 tot en met augustus 2018. Neurologische uitkomst werd gedichotomiseerd als goed (Cerebral Performance Category (CPC) 1-2) of slecht (CPC 3-5). Voor zowel de FH- als de FT-montage werd voor elk uur na hartstil-stand een random forest classifier getraind, en werden nieuwe drempelwaarden vastgesteld. Sensitiviteit en specificiteit van elke montage werden geëvalueerd.
Resultaten: Tussen juli 2018 en januari 2019 werden EEGs van 22 patiënten geregistreerd. Op 24 uur na
hartstilstand waren patronen van 21 patiënten beschikbaar. De overeenkomst voor achtergrondpatronen
tussen de BrainStatus en de FH set was redelijk (κ = 0.32). Tussen de FT- en FH-montage was de
overeenkomst voldoende tot goed (κ = 0.71).
In een testset van 79 patiënten voorspelde de hertrainde CRI met de FH-montage een slechte uitkomst op 24 uur na hartstilstand met een sensitiviteit van 0.86 en een specificiteit van 0.20. Bij de FT-montage was de sensitiviteit 0.92 en de specificiteit 0.35.
Conclusie: Visuele classificatie van EEG-patronen bij patiënten met postanoxische coma met een
FH-elektrodenset kan niet worden vervangen door de BrainStatus. Vier frontotemporale kanalen bieden echter voldoende overeenstemming en kunnen op betrouwbare wijze worden gebruikt voor visuele sco-ring van EEG-achtergrondpatronen.
De specificiteiten van de CRI-algoritmen, opnieuw getraind op de FH- en FT-montage, om een slecht neurologisch resultaat te voorspellen op 24 uur na hartstilstand, zijn onaanvaardbaar lager dan de oor-spronkelijke CRI.
Abstract
Introduction: Electroencephalography (EEG) patterns within 24 hours after cardiac arrest (CA) have
shown to reliably predict neurological outcome. These recordings may be simplified by using a less extensive electrode set. Subsequently, algorithm-aided EEG analysis may be used to identify regions of interest in high volumes of data and support untrained readers. In this dual study, we compared a sub-hairline EEG headband (BrainStatus) to a 9-channel full-head (FH) electrode set. Also, a 4-channel frontotemporal (FT) montage was derived from the FH set. Next, these FH/FT montages were used to re-train the existing cerebral recovery index (CRI) algorithm.
Methods: EEGs were simultaneously recorded with the FH set and the BrainStatus in consecutive adult
patients admitted after CA. EEG patterns were visually scored in 5-minute epochs at 24 hours after CA, and scoring agreement was evaluated using confusion matrices and Cohen’s kappa.
The CRI algorithm was re-trained on 79 post-arrest EEGs from March 2014 through August 2018. Neur-ological outcome was dichotomised as good (Cerebral Performance Category (CPC) 1-2) or poor (CPC 3-5). For both the FH and FT montage, a random forest classifier was trained for each hour after CA and new thresholds were established. Sensitivity and specificity of each montage were evaluated.
Results: Between July 2018 and January 2019, EEGs from 22 patients were recorded. At 24 hours
after CA, patterns of 21 patients were available. The agreement for background patterns between the
BrainStatus and FH set was fair (κ = 0.32). Between the FT and FH montage, the agreement was
substantial (κ = 0.77).
In a test set of 79 patients, the re-trained CRI with the FH montage predicted poor outcome at 24 hours after CA with sensitivity of 0.86 and specificity of 0.20. With the FT montage, sensitivity was 0.92 and specificity was 0.35.
Conclusion: Visual classification of EEG patterns in patients with postanoxic coma with a FH
elec-trode set cannot be replaced with the BrainStatus. However, four frontotemporal channels provide enough agreement, and can reliably be used for visual scoring of EEG background patterns.
The specificities of the CRI algorithms, re-trained on the FH and FT montage, to predict poor neurolo-gical outcome at 24 hours after CA are unacceptably lower than the original CRI.
Conflicts of interest statement
List of abbreviations
ACNS American Clinical Neurophysiology Society
ADRalpha-to-delta ratio
aEEGamplitude-integrated EEG
AMCAmsterdam University Medical Centers, location AMC, Amsterdam, the Netherlands
AUCarea under the curve
CAcardiac arrest
cEEGcontinuous EEG
CIconfidence interval
CPCCerebral Performance Category
CPRcardiopulmonary resuscitation
CRIcerebral recovery index
EEGelectroencephalogram
EEGelectroencephalography
FHfull-head
FTfrontotemporal
ICCintra-class correlation coefficient ICUIntensive Care Unit
NIRSnear infrared spectroscopy
OHCAout-of-hospital cardiac arrest
PSDpower spectral density
qEEG quantitative EEG
RASSRichmond Agitation-Sedation Scale
ROCreceiver operating characteristic ROSCreturn of spontaneous circulation
SDstandard deviation SEstatus epilepticus
TTMtargeted temperature management
1 Introduction and rationale
Out-of-hospital cardiac arrest (OHCA) is a major health problem in both Europe and the United States.[1] Due to increasing application of early defibrillation and out-of-hospital cardiopulmonary resuscitation (CPR), more patients achieve return of spontaneous circulation (ROSC). These patients are commonly treated in the Intensive Care Unit (ICU) with targeted temperature management (TTM) and cardi-orespiratory support.[2] In Europe alone, an estimated number of 176 000 patients are admitted yearly. Of these patients, 40-66% will never regain consciousness, as the result of severe postanoxic encephalo-pathy.[3] If a patient does not awake after rewarming from TTM, the treating physicians are confronted with the question whether the remaining neurological injury is still reversible or not. It creates a di-lemma between avoiding premature declaration of futility, or giving rise to false hope for recovery and inappropriately consuming of healthcare resources.[4,5] Early prognostication is of great importance, to make crucial clinical decisions, which will impact both the patient and family directly as well as the society at large in ethical and financial ways.[2–4,6,7]
Such early prognostication of neurological outcome remains a challenge. Electroencephalography (EEG) may be a reliable tool to assess neurological damage, and continuous EEG (cEEG) monitoring in the first 24 hours after cardiac arrest (CA) has proven to be a usable prognostic indicator of neurological outcome.[2,3,8–11] For example, Tjepkema-Cloostermans et al.[9] have found that certain EEG patterns within 24 hours after CA reliably predict neurological outcome. After these initial 24 hours, the pro-gnostic performance of the EEG declines.[8,10]Thus, the EEG monitoring needs to be initiated as soon as possible after ROSC. However, clinical implementation of cEEG is no widespread ICU practice yet.[12–14] ICU physicians and nurses are currently not trained in recording and reviewing EEGs, and usually there are no clinical neurophysiologists based in the ICU.[15,16] These challenges have to be overcome to make the cEEG a common tool, and exploit its full prognostic potential in clinical practice. In this dual study, we will explore the feasibility of an easy to apply frontotemporal electrode set and adapt an existing quantitative cEEG algorithm for use with this reduced electrode set.
1.1 BrainStatus electrode set
Recording EEGs is no daily practice for ICU staff. Specially trained technicians are needed to apply EEG electrodes to the patient. These technicians are not always available and the application of these electrodes takes time, possibly leading to delayed start of monitoring.[17] This introduces the need for EEG solutions that are fast and easy to set up, without extensive training. Electrodes should ideally be applied by non-technicians in limited time, but still be placed accurately and provide sufficient recording quality in a noisy clinical environment. Limiting the number of electrodes may shorten application time and the use of templates could eliminate the need for precise localisation of 10-20 system positions[18] by specialised technicians.[17,19,20] It has been found that reducing the number of electrodes from 21 to 10 does not affect EEG classification or prognostic accuracy in patients with postanoxic coma.[21]
1.2 CRI algorithm
To make EEG monitoring useful in post-arrest ICU care, clinically relevant conclusions have to be drawn from the recorded data. ICU staff needs to be able to recognise and react on pathological conditions, modifying their therapeutic approach.[23] Currently, standard practice in most Dutch hospitals is cEEG recording only, without real-time analysis.[13] The complex nature of the EEG necessitates expert in-terpretation, often not available in the ICU. In addition, cEEG signals are dynamical and may have consequences towards patient care within hours, thus requiring frequent review.[24]However, monitoring up to several days produces high volumes of data. Combined with the aforementioned limited availability of skilled interpreters, this is a major obstacle to the continuous assessment of EEG.[23,25,26] Therefore, conventional analysis of the EEG signal alone would considerably limit the application and any advant-age of cEEG monitoring in the ICU.[27]
There are several options facilitating more continuous assessment of cEEG traces, like training of ICU staff, tele-monitoring by neurophysiologists and the use of quantitative EEG (qEEG) analysis.[13,16,23,28,29] Trained ICU physicians cannot fully substitute a neurophysiologist, but when focussing on clinical rel-evant questions (i.e. presence of seizures) they can obtain sufficient knowledge to identify potentially dangerous conditions and start timely treatment.[12,23] Algorithms may support the lesser trained intens-ivists in their interpretation, and/or provide an automated assessment of the EEG signal. Furthermore, qEEG analysis can be used as an initial screening of cEEG to identify regions of interest, reducing the data volume for expert interpretation.[12,13,23,25,30] According to Moura et al.[24], quantitative analysis guided review of cEEG can reduce review time to 25% of the time needed to perform a traditional review. Yet, in a Dutch survey of Hilkman et al.[13], respondents reported that quantitative analysis is rarely used and if so, practice varies significantly. This will probably change in the near future, since cEEG monitoring is developing into a standard diagnostic modality in Dutch ICUs.[13]
Several methods of algorithm-aided cEEG analysis exist.[4,10,23,24,28,31–34]In 2017, Tjepkema-Cloostermans et al.[10] presented an optimised version of their cerebral recovery index (CRI): an automated prognost-icating index ranging from 0 (prediction of death) to 1 (prediction of full neurological recovery), based on EEG data from 21 electrodes. It was evaluated in a validation set of 140 patients, and was able to predict poor outcome at 12 hours after CA with a specificity of 100% and a sensitivity of 56%. Good neurological outcome could be predicted at 12 hours with a sensitivity of 63% and specificity of 94%, and at 24 hours with a sensitivity of 58% and specificity of 93%. According to the authors, their CRI enables bedside interpretation of cEEG by inexperienced readers.
1.3 Aims of this study
2 Research questions
2.1 Main question
Is quantitative cEEG monitoring, using a frontotemporal montage from the BrainStatus electrode set and automated analysis by the CRI algorithm, a reliable tool in the prognost-ication of neurological outcome for comatose cardiac arrest survivors in the ICU?
2.2 Subquestions BrainStatus
1. Does the visual assessment of EEG recordings made with the BrainStatus electrode set agree to a 9-channel full-head cEEG monitoring electrode set?
2. Does the visual assessment of EEG recordings made with a 4-electrode frontotemporal electrode set agree to a full-head 9-channel cEEG monitoring electrode set?
3. Does the visual assessment of EEG recordings made with the BrainStatus electrode set agree to a 4-electrode frontotemporal monitoring electrode set?
2.3 Subquestions CRI
4. What are the sensitivity and specificity of the re-trained CRI algorithm on a 9-channel full head and a 4-channel frontotemporal electrode configuration, to predict prognosis in comatose post-OHCA patients at the ICU?
3 Methods
3.1 Study population
In a prospective cohort study, EEG patterns in post-resuscitation ICU patients as identified with 4 channels from the Brainstatus were compared with those as measured with conventional electrodes. For evaluation of the CRI, an existing cEEG monitoring dataset from the AMC was used and extended. Since March 2014, all adult patients with ROSC after a CA, admitted to the ICU for TTM, were monitored with cEEG. As soon as possible after the start of TTM, during office hours, a 9-channel electrode set was applied by specialised technicians from the Clinical Neurophysiology department. cEEG recordings were continued up to three days, unless the patient regained consciousness or died. The Institutional Review Board of the AMC waived the need for informed consent for EEG monitoring during ICU stay and for the follow-up after 3 and 6 months by telephone.
3.1.1 Inclusion criteria
• ICU admission with postanoxic coma after CA • Receiving TTM (at 36°C, for 24 hours)
• cEEG monitoring, started within 24 hours after CA.
3.1.2 Exclusion criteria
• Any neurological disease or any progressive brain illness, other than postanoxic encephalopathy • Known history of another medical condition with life expectancy < 6 months
• Reason other than neurological condition to withdraw treatment • Age < 18 years
3.1.3 Standard of care and monitoring
TTM at 36°C was started as soon as the patient was admitted to the ICU, and was maintained for 24 hours. During TTM, patients were sedated using propofol (maximal 5 mg/kg/hour) to a target Richmond Agitation-Sedation Scale (RASS)[35] of -4: deep sedation with no response to voice, but (eye)movement in respons to physical stimulation. Treating physicians were blinded to the cEEG. Withdrawal of life-sustaining treatment (WLST) was considered only during normothermia and 72 hours after CA, following national guidelines[36]. In this decision, cEEG of the first 24 hours was not taken into account.
3.2 Outcome assessment
At three time points, the 5-point Glasgow–Pittsburgh Cerebral Performance Category (CPC)[37,38] was evaluated: at ICU discharge, by the attending researcher, and at three and six months after CA, via telephone by a single investigator blinded for EEG patterns. Primary outcome was neurological perform-ance at six months after CA, defined as the best of these three scores. This outcome was dichotomised as good (CPC 1-2: no to moderate disability) or poor (CPC 3-5: severe disability, comatose, death).
3.3 cEEG recordings
From July 2018 through January 2019 and if possible, we additionally placed a BrainStatus (Bittium, Oulu, Finland; figure 3.1 and appendix II) on the forehead of each monitored patient. The EEG was recorded from both the 9-channel electrode set and BrainStatus simultaneously. Overlapping electrode positions from the 9-channel set (Fp1 and Fp2) were placed as close as possible to their intended location. Before starting to work with patients, we trained this application procedure on four healthy subjects.
(a) Frontal view (b) Side view
Figure 3.1: Recording set-up with BrainStatus and cup electrodes of the 9-channel electrode set, jointly placed on
a healthy volunteer. The use of these photographs was approved by the volunteer.
3.4 EEG epoch selection and montages
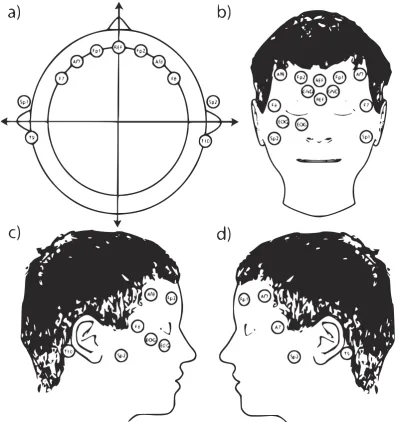
Each hour after the estimated time of CA, epochs were automatically selected by a custom made computer algorithm, using MATLAB (2018b, The MathWorks Inc., Natick, MA, USA). In short, 5-minute EEG epochs with the least number of artefacts were selected from 20-minute windows around the specified time points. More details can be found in appendix III. Subsequently, two EEG montages were made: the 9-channel full-head (FH) montage (nine electrodes: Fp1-T3, T3-O1, Fp2-T4, T4-O2, Fp1-C3, C3-O1, Fp2-C4, C4-O2, Fp1-Fp2, T3-C3, C3-Cz, Cz-C4, C4-T4 and O1-O2) and the 4-channel frontotemporal (FT) montage with fewer electrodes (subset of four electrodes: Fp1-T3, Fp2-T4, Fp1-Fp2 and T3-T4). If present, the BrainStatus montage was made, with four electrodes from the BrainStatus: Fp1-T9, Fp2-T10, Fp1-Fp2 and T9-T10. All montages are presented schematically in fig. 3.2.
[image:16.595.97.497.149.372.2](a) 9-channel full-head (FH) (b) 4-channel frontotemporal (FT) (c) BrainStatus
Figure 3.2: Schematic overview of used EEG montages, with electrode positions in the 10-20 system[18], Ref =
3.5 BrainStatus
3.5.1 Data selection and Preprocessing
From all patients with the BrainStatus electrode set, the 5-minute epochs at 12 and 24 hours after CA were included. Additionally, 50 EEG epochs at both 12 and 24 hours after CA from the existing data set, of randomly selected patients with all possible background patterns, were added to expand the number of available EEGs for the FH and FT montages. The EEGs were filtered with an adjustable band-pass filter and notch filter, for details see appendix IV.
3.5.2 Visual scoring
The patterns present in each EEG epoch were visually scored by three trained EEG readers, independ-ently and in random order. The epochs were presented at random in each of the three montages (section 3.4), by a custom build scoring web application (more details are available in appendix IV). The observ-ers were blinded to all clinical data, patient outcome, electrode sets and time after cardiac arrest. EEG epochs were classified corresponding to the guidelines of the American Clinical Neurophysiology Society (ACNS).[39] Background pattern was scored as suppressed (< 10µV), burst-suppression with or without identical bursts (50-99% suppression), discontinuous (10-49% suppression), continuous with low (< 20 µV) or normal voltage (> 20 µV). Independent from the background pattern, rhythmic patterns were scored as none, rhythmic delta, periodic discharges or spikes waves, combined with their abundance. The reviewer could also indicate when interpretation of an epoch was obscured due to artefacts. The final classification was determined by majority vote. If inconclusive, the epoch was left out of the analysis.
3.5.3 Statistical Analysis
Inter-rater variability amongst the three raters was assessed using the intra-class correlation coefficient (ICC) and its 95% confidence interval (CI), based on an average measures, absolute-agreement, 2-way random-effects model. An ICC value less than 0.5 was defined as poor, values between 0.5 and 0.75 as moderate, values between 0.75 and 0.9 as good and values above 0.9 as excellent reliability.[40]Confusion matrices were made to compare the three montages. Three comparasions were made (table 3.1). First, comparison was made between the 9-channel FH versus the 4-channel FT montage, including the 50 patients without the BrainStatus, to look into the effect of reducing the electrode set from nine to four electrodes. With only the data from the patients with a BrainStatus, comparisons were made between FT and the BrainStatus montage, and eventually between the 9-channel and the BrainStatus montage. Last, the classifications were grouped into EEG background patterns associated with a good (continuous), uncertain (discontinuous or burst suppression without identical bursts) and poor outcome (suppressed or burst suppression with identical bursts). To evaluate the agreement in classification between the different montages, Cohen’s Kappa was used. Values below zero were defined as poor, 0 to 0.20 as slight, 0.21 to 0.4 as fair, 0.41 to 0.60 as moderate, 0.61 to 0.8 as substantial, and above 0.81 as almost perfect.[41] A reliable agreement was defined as the kappa being at least substantial, when compared to the 9-channel FH montage. All statistical analysis was done using MATLAB.
Table 3.1: Overview of comparisons between electrode sets.
Compare montage to montage to evaluate
9-channel full-head 4-channel BrainStatus replacing conventional monitoring with BrainStatus
9-channel full-head 4-channel frontotemporal reducing conventional set to 4-channel frontotemporal
3.6 CRI algorithm
3.6.1 Data selection and Preprocessing
Follow-up data from the patients whose EEGs were recorded using the BrainStatus was not yet available when re-training the CRI. Alternatively, the comparable 4-channel FT montage was used. From the existing dataset, all hourly 5-minute epochs from patients with a CA from March 2014 through August 2018 were included. Two of the EEG montages (section 3.4) were compared: the 9-channel FH and the 4-channel FT montage. All epochs were filtered by a zero-phase fourth order Butterworth bandpass filter (1–25 Hz).
3.6.2 qEEG features
In the CRI, the following nine qEEG features were calculated from the raw cEEG data: alpha-to-delta ratio (ADR), signal power, Shannon entropy, delta coherence, regularity, number of bursts/min, mean burst correlation, maximal burst correlation, and fraction of burst correlation larger than 0.8. Windows of 10 seconds with large differences between electrodes in ADR (standard deviation (SD) > 4) or signal power (SD > 2.5) were marked as containing artefact, and epochs with 10 or more of the 30 windows being artefacts were removed from further processing.[10] We derived a correction factor, to adapt these thresholds to our reduced number of electrodes (appendix V). A moving average filter with a 2-hour window was applied. Per hour of EEG data, the resulting values for each of the nine features were written to an intermediate file.[10] Preprocessing and feature calculation was done in MATLAB.
3.6.3 Training random forest classifier
Half of the included patients were randomly selected, and allocated to the training set. This set was used to train a random forest classifier for each hour after CA, based on 500 individual decision trees and a maximum number of terminal nodes set to five. A separate classifier was trained for both the 9-channel FH and 4-channel FT montage. Random forest classification was performed using R (version 3.5.2 [2018-12-20]; R Foundation for Statistical Computing, Vienna, Austria).[42,43] Contribution of the individual features to the random forest model was calculated in the training set by the method developed by Palczewska et al.[44] and Palczewska and Robinson[45].
3.6.4 Validation and performance analysis
4 Results
4.1 BrainStatus
4.1.1 Patient inclusion
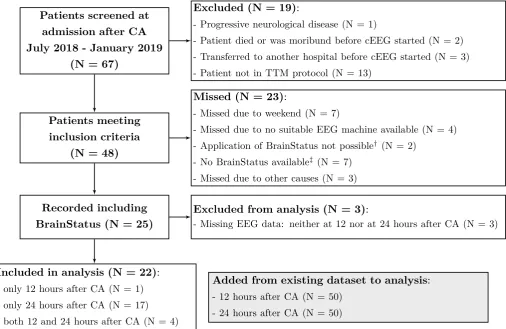
Out of 67 patients screened from July 2018 through February 2019, 22 were included (figure 4.1). Re-cordings were available at 12 hours and 24 hours after CA for 5 respectively 21 patients. Patient characteristics at 24 hours after CA are described in table 4.1. Characteristics of the added patients were not significantly different from those of the patients with the BrainStatus.
Patients screened at admission after CA July 2018 - January 2019
(N = 67)
Excluded (N = 19):
- Progressive neurological disease (N = 1)
- Patient died or was moribund before cEEG started (N = 2) - Transferred to another hospital before cEEG started (N = 3)
- Patient not in TTM protocol (N = 13)
Patients meeting inclusion criteria
(N = 48)
Missed (N = 23):
- Missed due to weekend (N = 7)
- Missed due to no suitable EEG machine available (N = 4)
- Application of BrainStatus not possible† (N = 2)
- No BrainStatus available‡ (N = 7)
- Missed due to other causes (N = 3)
Recorded including BrainStatus (N = 25)
Excluded from analysis (N = 3):
- Missing EEG data: neither at 12 nor at 24 hours after CA (N = 3)
Included in analysis (N = 22): - only 12 hours after CA (N = 1)
- only 24 hours after CA (N = 17) - both 12 and 24 hours after CA (N = 4)
Added from existing dataset to analysis: - 12 hours after CA (N = 50)
- 24 hours after CA (N = 50)
Figure 4.1: Schematic overview of subject inclusion process with BrainStatus electrode set. CA = Cardiac Arrest,
(c)EEG = (continuous) electroencephalography. †: all due to other forehead-attached monitoring devices,‡: due
[image:19.595.47.554.185.514.2]to delayed delivery from our supplier
Table 4.1: Baseline Characteristics of Patients in BrainStatus analysis, at 24 hours after cardiac arrest. IQR =
interquartile range. ∗: Difference between both groups was tested using Fisher exact test or Mann-Whitney U
test, whichever was appropriate. P-values < 0.05 were considered statistically significant.
Characteristic Patients with BrainStatus Patients from existing set p-value∗
(n = 21) (n = 50)
Male n (%) 13 (62%) 36 (72%) 0.41
Age years, median (IQR) 67 (52.0-78.3) 65 (53-72) 0.51
Cardiac cause n (%) 8 (38%) 24 (48%) 1.00
Witnessed n (%) 17 (81%) 38 (76%) 0.74
Out of hospital n (%) 20 (95%) 44 (88%) 0.67
Shockable rhythm n (%) 11 (52%) 24 (48%) 0.80
Delay CA to CPR min, median (IQR) 4 (0.0-6.5) 2 (1-5) 1.00
Duration of CPR min, median (IQR) 14 (6-22) 15 (10-20) 0.46
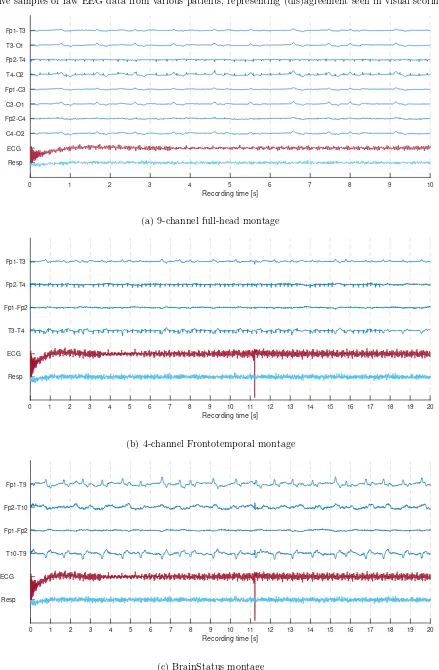
4.1.2 EEG recordings and scoring
Several illustrative samples of raw EEG data from various patients can be found in appendix VI. At 24 hours after CA, the inter-rater reliability of 71 observations (21 with BrainStatus + 50 added EEGs) for background pattern was excellent for both the 9-channel FH and 4-channel FT set, with an ICC of 0.95 (95%CI: 0.93-0.96) respectively 0.91 (0.89-0.94). Using the BrainStatus, reliability of 21 observations was moderate with an ICC of 0.56 (0.42-0.67). The remaining ICCs, also for 12 hours after CA, can be found in appendices VII and VIII.
4.1.3 Confusion matrices
Confusion matrices of the visually scored background patterns at 24 hours after CA are shown in figure 4.2 to figure 4.4. Results of the other features can be found in appendix VIII, and for 12 hours post-arrest in appendix VII.
Suppressed
BurstSupprWithIdent BurstSupprWithoutIdent
DiscontinousContinous N/A
9-channel full-head montage
[image:20.595.146.445.236.448.2]Suppressed BurstSupprWithIdent BurstSupprWithoutIdent Discontinous Continous N/A BrainStatus montage 1 1 1 2 2 2 1 1 2 1 7
Figure 4.2: EEG background patterns at 24 hours after cardiac arrest, comparing the 4-channel BrainStatus to the 9-channel full-head montage. N/A = not assessable. Blue background colour indicates conformity, red represent disagreement. Colour saturation corresponds with relative number of observations. Total N = 21.
Suppressed
BurstSupprWithIdent BurstSupprWithoutIdent
DiscontinousContinous N/A
9-channel Full Head montage Suppressed BurstSupprWithIdent BurstSupprWithoutIdent Discontinous Continous N/A
4-channel frontotemporal montage
3 1 1 5 1 5 8 1 3 1 1 12 21
[image:20.595.145.439.523.737.2]Suppressed BurstSupprWithIdent
BurstSupprWithoutIdent
DiscontinousContinous N/A
4-channel frontotemporal montage
Suppressed
BurstSupprWithIdent
BurstSupprWithoutIdent
Discontinous
Continous
N/A
BrainStatus montage
1
1
2
1 1
1 2
2
1 8
Figure 4.4: EEG background patterns at 24 hours after cardiac arrest, comparing the 4-channel BrainStatus to the 4-channel frontotemporal montage. N/A = not assessable. Blue background colour indicates conformity, red colour represent disagreement. Colour saturation corresponds with relative number of observations. Total N = 20.
4.1.4 Classification agreement
[image:21.595.148.445.44.260.2]The classification agreement of only the two major features (background pattern, rhythmic pattern) and artefact presence at 24 hour after CA are shown here, in table 4.2. Agreement of background pattern scoring between both the FH and FT montage compared to the BrainStatus was fair. When comparing the FH to the FT montage, this agreement was substantial. The kappa values of the remaining features can be found in appendix VIII. Results at 12 hours can be found in appendix VII.
Table 4.2: Classification agreement at 24 hours after cardiac arrest. FH = 9-channel full-head, FT = 4-channel
frontotemporal, BS = BrainStatus, CI = confidence interval andκ= Cohen’s kappa.
Montage Background Pattern Rythmic pattern Artefact
κ 95% CI κ 95% CI κ 95% CI
FH - BS 0.32 0.01 - 0.62 0.15 -0.48 - 0.78 0.32 -0.10 - 0.73
FH - FT 0.77 0.65 - 0.90 0.73 0.47 - 0.99 0.70 0.47 - 0.93
4.2 CRI algorithm
4.2.1 Patient inclusion
In the existing dataset, 213 patients were monitored between March 2014 and August 2018. For details on the inclusion process, see figure 4.5. Patient characteristics are described in appendix IX.
Patients screened at admission after CA March 2014 - August 2018
(N = 457)
Excluded (N = 172):
- Neurological disease or progressive brain illness, other than postanoxic encephalopathy (N = 18)
- Patient died or was moribund before cEEG started (N = 28) - < 18 years old (N = 2)
- Transferred to another hospital before cEEG started (N = 8) - Admission >24h after CA (N = 13)
- Patient not in TTM protocol (N = 84)
- Missed due to other causes (N = 19)
Patients meeting inclusion criteria (N = 285)
Missed (N = 72):
- Missed due to weekend (N = 59)
- Missed due to no EEG machine available (N = 13)
Recorded cEEG (N = 213)
Excluded from analysis (N = 55) - One or more channels not found (N = 2) - Feature calculation failed (N = 1)
- Time of cardiac arrest unknown (N = 15) - Lost to follow-up (N = 17)
- All epochs discarded by artefact detection (N = 13) - Unknown error when selecting epochs (N = 5) - Unknown (N = 2)
Included in analysis - training set (N = 79) Included in analysis - test set (N = 79)
Not available (N = 44) Discarded by AD: - 9-c. FH (N = 6) - 4-c. FT (N = 3)
Not available (N = 7) Discarded by AD: - 9-c. FH (N = 20) - 4-c. FT (N = 12)
Not available (N = 52) Discarded by AD: - 9-c. FH (N = 2) - 4-c. FT (N = 3)
Not available (N = 11) Discarded by AD: - 9-c. FH (N = 17) - 4-c. FT (N = 12)
Training set @ 12h 9-c. FH (N = 29[11/18]) 4-c. FT (N = 32[12/20])
Training set @ 24h 9-c. FH (N = 52[11/41]) 4-c. FT (N = 60 [16/44])
Test set @ 12h
9-c. FH (N = 25[12/13]) 4-c. FT (N = 24[11/13])
Test set @ 24h
[image:22.595.32.567.130.711.2]9-c. FH (N = 51[15/36]) 4-c. FT (N = 56 [17/39])
Figure 4.5: Inclusion flowchart - Schematic overview of subject inclusion process into the different training and
test sets, with N = total[Poor outcome/Good outcome at 6 months after cardiac arrest]. CA = cardiac arrest, TTM =
4.2.2 Algorithm performance
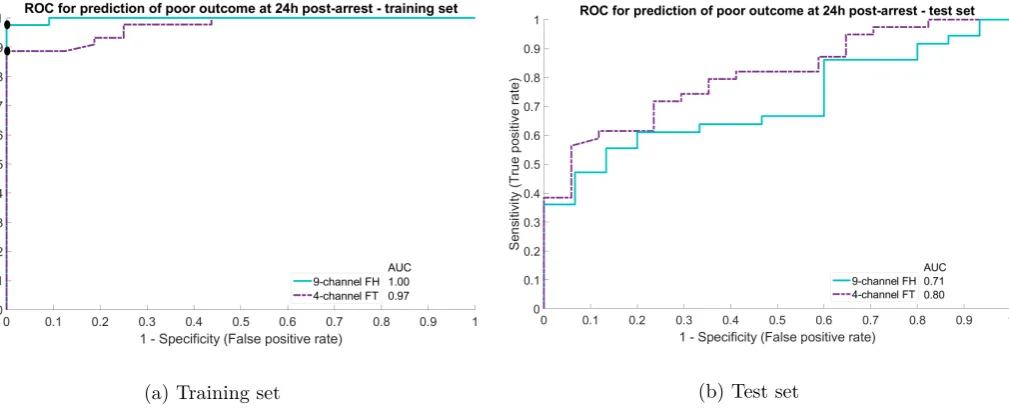
In figure 33, the ROC curves of both montages for the prediction of good neurological outcome at 12 hours after CA are shown. The ROC curves for the predication of poor outcome at 24 hours post-arrest are shown in figure 34. The other ROC curves can be found in appendix IX. The chosen thresholds with corresponding sensitivity and specificity can be found in table 4.3.
(a) Training set (b) Test set
Figure 4.6: ROC curves predicting good neurological outcome at 12 hours after cardiac arrest (CA), as measured with the 9-channel FH compared to the 4-channel FT montage. Chosen threshold represented by black dot.
[image:23.595.38.550.149.355.2](a) Training set (b) Test set
Figure 4.7: ROC curves predicting poor neurological outcome at 24 hours after cardiac arrest (CA), as measured with the 9-channel FH compared to the 4-channel FT montage Chosen threshold represented by black dot.
Table 4.3: Chosen CRI thresholds with corresponding sensitivity (sens) and specificity (spec).
Time after
cardiac arrest Montage
Predicting good outcome Predicting poor outcome
Threshold Sens. Spec. Threshold Sens. Spec.
12 hours 9-channel FH 0.614 0.08 0.58 0.380 0.84 0.58
4-channel FT 0.766 0.00 0.82 0.418 0.85 0.64
24 hours 9-channel FH 0.436 0.14 0.80 0.436 0.86 0.20
[image:23.595.43.548.408.612.2]4.2.3 Relative contribution of features
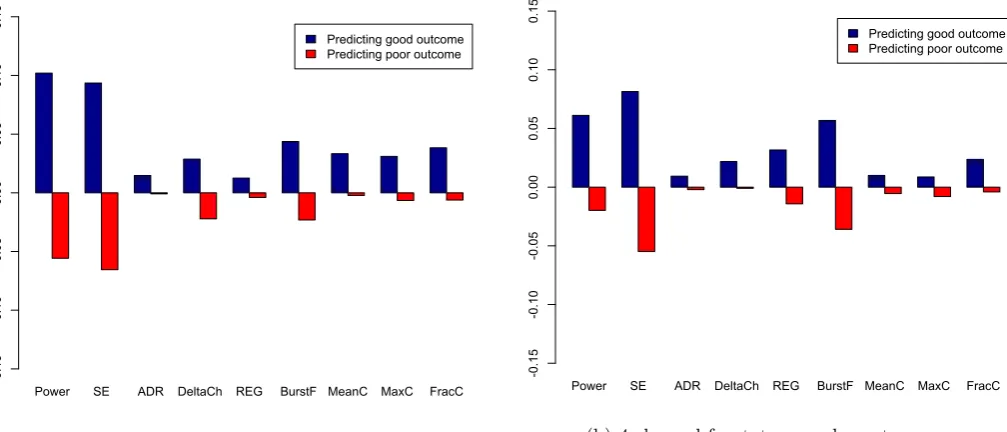
The relative contribution of each of the nine features is shown in figure 4.8 (12 hours post-arrest) and figure 4.9 (24 hours post-arrest). Most contributing feature at 12 hours after CA was the delta coherence, and at 24 hours post-arrest the power and Shannon entropy.
Power SE ADR DeltaCh REG BurstF MeanC MaxC FracC Predicting good outcome Predicting poor outcome
-0.15 -0.10 -0.05 0.00 0.05 0.10 0.15 0.20
(a) 9-channel frontotemporal montage
Power SE ADR DeltaCh REG BurstF MeanC MaxC FracC Predicting good outcome Predicting poor outcome
-0.15 -0.10 -0.05 0.00 0.05 0.10 0.15 0.20
(b) 4-channel frontotemporal montage
Figure 4.8: Relative contribution of features at 12 hours after cardiac arrest, to the prediction of neurological outcome. SE = Shannon entropy, ADR = alpha-to-delta ratio, DeltaCh = delta coherence, REG = regularity, BurstF = burst frequency (per minute), MeanC = mean burst correlation, MaxC = maximal burst correlation and FracC = fraction of burst correlation larger than 0.8.
Power SE ADR DeltaCh REG BurstF MeanC MaxC FracC Predicting good outcome Predicting poor outcome
-0.15 -0.10 -0.05 0.00 0.05 0.10 0.15
(a) 9-channel frontotemporal montage
Power SE ADR DeltaCh REG BurstF MeanC MaxC FracC Predicting good outcome Predicting poor outcome
-0.15 -0.10 -0.05 0.00 0.05 0.10 0.15
[image:24.595.33.535.133.348.2](b) 4-channel frontotemporal montage
[image:24.595.31.535.449.665.2]5 Discussion
5.1 BrainStatus
5.1.1 Interpretation of our findings
In the first part of this study, we tested the agreement of the BrainStatus with a 9-channel FH electrode set. At 12 hours after CA, there were relatively few EEG recordings available. Therefore, this time point was left out of our final analysis. At 24 hours after CA, the kappa of 0.32 was below the threshold set to 0.61. Because visual assessment of EEG recordings made with the BrainStatus electrode set do not agree sufficiently to a 9-channel FH monitoring electrode set, the BrainStatus is not considered a reliable tool in the prognostication of neurological outcome after CA.
We also compared both the 9-channel FH electrode set and the BrainStatus to a 4-channel FT elec-trode set, to separate the effect of elecelec-trode placement from the influence of differences in recording quality. When reducing the FH electrode set from 9 to 4 frontotemporal electrodes, the agreement remained substantial with a kappa of 0.71. So, the locations of these four channels seem adequate for outcome prediction. Comparing the BrainStatus with the either the 9-channel FH or the 4-channel FT montage resulted in only a fair agreement. This suggests that the registration quality of the BrainStatus is the likely cause of the disagreement.
5.1.2 Comparison with previous literature
EEG monitoring with a reduced number of electrodes was assessed in several other studies, like the pre-viously mentioned article of Tjepkema-Cloostermans et al.[21] An even smaller electrode set was used by Pati et al.[46], who compared a 21-channel EEG to a limited montage of 4 electrodes (Fp1-F7 and Fp2-F8). They concluded that the sensitivity and specificity of the 21- and 4-channel montage were comparable: in the limited montage, reviewers were able to accurately classify background continuity (88% correct), background amplitude (81% correct), maximum background frequency (70% correct), periodic epilep-tiform discharges, including a seizure (92% correct) and sporadic discharges (91% correct). Recently, Kortelainen et al.[47] reported that four forehead channels (Fp1, Fp2, F7, and F8) were as capable as a 19-channel full EEG cap in capturing the effect of hypoxic ischemic encephalopathy on propofol-induced slow wave activity. This supports the agreement we found between the 9-channel FH and 4-channel FT electrode set. Because neither of these two studies tested against self-adhesive screen-printed electrode sets, we cannot directly compare their findings with our BrainStatus results.
In response to our dissimilar results concerning the BrainStatus, the manufacturer acknowledged that problems with artefacts has been a known issue. They shared our hypothesis that the disagreement was caused by the recording quality. The interference was probably originating from an unshielded cable, connecting the BrainStatus to the EEG system. Preliminary results of recordings with a shielded cable showed a noticeable reduction of the artefacts present in the EEG. We expect that this additional shield-ing may resolve the problems with registration quality, but this has to be proven in additional recordshield-ings.
5.1.3 Clinical experience with the BrainStatus
Besides the EEG signal, we also obtained clinical experiences with the BrainStatus in our ICU. The durability of the BrainStatus was sufficient to maintain recording for more than 24 hours. One patient experienced excessive sweating, which soaked off all self-adhesive electrodes from the patient’s skin, including the BrainStatus. In another patient, the BrainStatus was detached after one day, probably due to turning of the patient during nursing care. In all 23 other patients, the BrainStatus remained securely fixed for at least 24 hours. The connector of the cable linking the BrainStatus to the EEG recording system was considered fragile, as the connector pins did bent easily. A more robust connector may improve clinical handling and durability. Furthermore, some nurses felt that the BrainStatus was very present on the patient’s head, covering the face. Last, the BrainStatus was not compatible with other forehead attached monitoring devices, like cerebral near infrared spectroscopy (NIRS) monitoring. A combined device, like Masimo’s Root™ with SedLine™ Brain Function Monitoring and O3™ Regional Oximetry (Masimo, California, USA) may provide a solution.
5.1.4 Study limitations
Our BrainStatus study has several limitations. First, because of the limited availability of EEG tech-nicians (only during office hours) and delay due to uncertainty around acute care decisions (e.g. inter-hospital transfers), EEG data from only a relatively small number of patients was available. With just 5 and 21 patients included in the analysis at 12 respectively 24 hours, this is considered only a preliminary study. A prospective study with a larger number of subjects is needed to draw more reliable conclusions. Second, there might be a learning effect with regard to the application of the BrainStatus, despite the prior training on healthy volunteers. When we recorded in patients for a longer period of time, we learned that the BrainStatus had to be applied without too much tension on the separated parts, to avoid loosening and worsening of contact. This may have influenced the amount of artefacts present in the first recordings. Last, there was only one size of the BrainStatus electrodes available (size S). However, this in the only size currently offered by the manufacturer, who indicates that it has a correct fit for about 95% of the patients.[51] This is consistent with our own observations, as we could apply this size of BrainStatus to each of our recorded patients.
5.2 CRI algorithm
5.2.1 Interpretation of our findings
When looking at the ROC curves of the training set, several showed an AUC of 1.00. Also, the perform-ance of the classifier on the test sets was disproportionately worse compared to the training set. This may indicate overfitting of the random forest classifier on the specific cases in the training set. There are several approaches to reduce overfitting, for example adjusting parameters like the maximal number of terminal nodes. Expanding the dataset used for training could improve generalisability of the classifier. This could be achieved with inclusion of more patients, but also with varying the ratio for dividing data over the test and training set. Instead of only separating into a train and test set once, k-fold cross validation may be used to make more use of the relatively small sized data set. Additionally, it may help to obtain a more valid estimate of the performance of the trained classifier. Also, feature reduction could help to reduce overfitting, by only keeping features that have a relatively large contribution to the prediction of neurological outcome, like the delta coherence, the power and the Shannon entropy.
In this study, only the features present in the original CRI were tested. As explained by Asgiri et al.[11], the brain is a non-linear time-variant system, producing quasi-periodic and non-stationary EEG signals, thus a single feature alone provides too limited information about the status of such a complic-ated system. So, other features may be added to create a more complete representation of the viability of the brain. However, including too many features will result in overfitting and a non-generisable classifier. Combining EEG features in the most optimal way will improve the accuracy of neurological prognost-ication. An overview of quantitative EEG features for predication of outcome in cardiac arrest subject can be found in the work of Asgari et al.[11]
5.2.2 Comparison with previous literature
Comparing to the original CRI of Tjepkema-Cloostermans et al.[8,10], our algorithm did perform worse. This could be due to the fact that the original CRI was developed with 21 electrodes, in contrast to our smaller numbers of 9 or 4 electrodes. Besides retraining the random forest classifier, other adaptations may be needed to optimise the algorithm when working with a reduced electrode set. Recently, a new version of the CRI was developed by Nagaraj et al.[52] They improved the performances of the CRI algorithm, but still were using 21 electrodes. The only study known to the authors investigating the CRI with a reduced number of electrodes, is unpublished work of Derksen et al.[53] She concluded that the CRI as measured by only three electrodes appeared to be a good predictor for neurological outcome, especially for poor prognosis. With her 3-channel central montage, poor outcome at 24 hours after CA could be predicted with a sensitivity of 39%, and a sensitivity of 98%. Good neurological outcome was predicted at 24 hours after CA with a sensitivity of 82%, but at the expense of a lower specificity of 58%. This superior performance, compared to our results, is possibly caused by the three central electrodes providing a more accurate representation of the brain than the four FT electrodes. Furthermore, the central electrodes may contain less artefacts, compared to FT electrodes. However, using the thresholds from the original study instead of choosing new values may have coincidentally resulted in a more ap-propriate setting.
in a representation of the EEG signal on a much coarser time scale, but unlike the CRI this method does not combine different features. This time compression may also be a disadvantage, making it more difficult distinguish burst suppression patterns with or without identical bursts, or to spot epileptiform discharges.[21]
5.2.3 Artefact detection
Reducing the number of electrodes introduced unforeseen difficulties in the artefact detection incorpor-ated in the CRI. We noticed that many EEG epochs were falsely being classified as artefact, and an undesirable large number was removed from the analysis. This was mainly due to the shifting values of signal power, caused by reduced number of EEG channels. This concern was discussed with the original developers of the CRI. In their study, the thresholds were derived from the original CRI dataset and set at arbitrary values, based on sufficient artefact rejection to the opinion of the authors. They could not provide a solution to our problem. Also Derksen et al.[53] did not address this problem, so an own empirical approach was started. Based on observed values in our dataset, we tried several thresholds for the SD of the power (original 2.5, 50, 100, 200, and our adaptive approach). When comparing the AUCs of the ROC curves, the sensitivity, and the specificity, the adaptive threshold seemed to performed best. This correction method was not based on a thorough and well-founded mathematical reasoning, but has to be considered more like a first attempt to address this problem. For example, the assumption that power is equal for each channel does not hold with varying interelectrode distances, present in the both montages. Artefact detection in EEG is another topic outside the scope of this study, and requires further research. Automated EEG signal quality assessment, like developed by Mohamed et al.[55], may provide a more advanced solution to this problem
5.2.4 Study limitations
Besides the complication with artefact detection, there are several other remarks with respect to our CRI study. First, all features in the original CRI were calculated from a 21-channel source derivation montage, whereas this was not possible with a 9- or 4-channel montage. This was necessary to adjust to the different electrode sets. We also changed the moving average filter: instead of returning a value when one of the neighbouring hours contained EEG data, all of the three timepoints had to be available before calculating an average. This way, results were only generated for hours where EEG data was available. Both alterations may limit the comparability to the original algorithm. Secondly, a more general remark: the precise time of the CA was not always known. If available, data from the ambulance services and/or defibrillators was used, but otherwise the time was estimated based on admission time. This may have influenced the selection of the 12 and 24 hours windows, but was considered neglectable because we expected these differences to be no longer than half an hour. Last, in this kind of studies related to prognostication possibly followed by WLST, there is almost always the risk of a self-fulfilling prophecy.[3] However, in the 24 hours after CA the cEEG was not taken into account when making clinical decisions, so this risk was minimised.
5.3 Clinical utility of cEEG monitoring after CA
6 Conclusion
The agreement of the visual assessment of EEG recordings made with the BrainStatus electrode set compared to a 9-channel full-head monitoring electrode set was not sufficient. However, we found that four frontotemporal channels provide enough agreement, and can reliably be used for visual scoring of EEG background patterns.
The specificity to predict poor prognosis with the re-trained CRI algorithms on the 9- and 4-channel electrode configuration are found to be lower than the original CRI and are deemed unacceptable
7 Future research and development
7.1 Future research on the BrainStatus and CRI
Concerning the BrainStatus electrode set, the next step should be an assessment of recordings made with the aforementioned shielded cable. Depending on these results, a prospective cohort study could be initiated or an alternative electrode set has to be found. When continuing to work with the BrainStatus, it is desirable to create a more robust and easier to (dis)connect connector to the EEG system.
Continuing to work on the CRI, it should first of all be verified that the CRI algorithm does func-tion similarly on a different EEG dataset, compared to the set it was developed on. The source code should be robust, and return warnings when encountering something unexpected. Frequent intermediate reporting of variables, like a list of patients included in the current processing step, may help to debug and monitor the progress of the algorithm.
Furthermore, in the current analysis, only the 5-minute epochs at 12 and 24 hours after CA are re-lated to the neurological outcome. Because of the continuous evolution of EEG patterns over the hours following the CA, it may be interesting to expand our field of view: from two fixed time point to looking at the whole cEEG registration and CRI trend, like also done in the original study.[10]
The CRI should be optimised for the processing of smaller electrode sets. Recording cEEG is no standard clinical practice in Dutch ICUs yet, neither with 21 nor with another number of electrodes. Limiting the number of electrodes may reduce set up time, and using only sub-hairline locations may facilitate the use of templates like the BrainStatus. This way, quantitative cEEG monitoring can be made available to more hospitals across the Netherlands.
7.2 Future development of cEEG monitoring in the ICU
Citerio[23]has identified four barriers for implementation of cEEG in the ICU: (1) the limited availability of EEG technicians and neurophysiologists to record and review studies, (2) the lack of uniform termin-ology and consensus on clinical significance of specific EEG patterns, (3) the need for an infrastructure for cEEG in a busy modern ICU environment and (4) the huge amount of recorded EEG-data requiring time for reviewing and interpretation. If working properly in clinical practice, the BrainStatus combined with the adjusted CRI could help to solve both the recording and reviewing challenges, and provide bedside measure of cerebral damage and recovery over time.
model for predicting neurological outcome. When a sufficient size of the dataset is reached, deep learning may become an interesting option, bypassing the need for feature selection. Van Putten et al.[63]already have developed a deep learning classifier, with similar prognostic accuracy as the CRI.
Looking beyond this thesis, the clinical implementation of cEEG will largely depend on the physicians and nurses on the ICU: they are the end users who will have to work with the monitoring system. To incorporated their needs and wishes, it is important to conduct a requirements survey and evaluate pro-totypes with the end users. Examples of such requirements could be: Easy to use by ICU physicians and nurses; Simple and quick to attach to the patient; Quick start of measurements; Real-time, automated and reliable analysis; Understandable presentation of results and clear interpretation.
References
[1] J.-T. Gräsner, R. Lefering, R. W. Koster, S. Masterson, B. W. Böttiger, J. Herlitz, J. Wnent, I. B. Tjelmeland,
F. R. Ortiz, H. Maureret al., “EuReCa ONE - 27 Nations, ONE Europe, ONE Registry,”Resuscitation, vol.
105, pp. 188–195, 2016.
[2] W. Muhlhofer and J. P. Szaflarski, “Prognostic Value of EEG in Patients after Cardiac Arrest—An Updated
Review,”Current Neurology and Neuroscience Reports, vol. 18, no. 4, 2018.
[3] L. Sondag, B. J. Ruijter, M. C. Tjepkema-Cloostermans, A. Beishuizen, F. H. Bosch, J. A. van Til, M. J. van Putten, and J. Hofmeijer, “Early EEG for outcome prediction of postanoxic coma: Prospective cohort study
with cost-minimization analysis,”Critical Care, vol. 21, no. 1, pp. 1–8, 2017.
[4] M. C. Tjepkema-Cloostermans, “EEG monitoring in postanoxic coma,” Ph.D. dissertation, University of Twente, 2014.
[5] J. P. Nolan, R. W. Neumar, C. Adrie, M. Aibiki, R. A. Berg, B. W. Böttiger, C. Callaway, R. S. Clark, R. G.
Geocadin, E. C. Jauchet al., “Post-cardiac arrest syndrome: Epidemiology, pathophysiology, treatment, and
prognostication,”Resuscitation, vol. 79, no. 3, pp. 350–379, 2008.
[6] P. M. Vespa, W. J. Boscardin, D. A. Hovda, D. L. McArthur, M. R. Nuwer, N. A. Martin, V. Nenov,
T. C. Glenn, M. Bergsneider, D. F. Kelly et al., “Early and persistent impaired percent alpha variability on
continuous electroencephalography monitoring as predictive of poor outcome after traumatic brain injury,” Journal of Neurosurgery, vol. 97, no. 1, pp. 84–92, 2002.
[7] C. Sandroni, A. Cariou, F. Cavallaro, T. Cronberg, H. Friberg, C. Hoedemaekers, J. Horn, J. P. Nolan, A. O. Rossetti, and J. Soar, “Prognostication in comatose survivors of cardiac arrest: An advisory statement from
the European Resuscitation Council and the European Society of Intensive Care Medicine,” Intensive Care
Medicine, vol. 40, no. 12, pp. 1816–1831, 12 2014.
[8] M. C. Tjepkema-Cloostermans, F. B. van Meulen, G. Meinsma, and M. J. van Putten, “A Cerebral Recovery
Index (CRI) for early prognosis in patients after cardiac arrest,”Critical Care, vol. 17, no. 5, p. 1, 2013.
[9] M. C. Tjepkema-Cloostermans, J. Hofmeijer, R. J. Trof, M. J. Blans, A. Beishuizen, and M. J. A. M. Van Putten, “Electroencephalogram predicts outcome in patients with postanoxic coma during mild
thera-peutic hypothermia,”Critical Care Medicine, vol. 43, no. 1, pp. 159–167, 2015.
[10] M. C. Tjepkema-Cloostermans, J. Hofmeijer, A. Beishuizen, H. W. Hom, M. J. Blans, F. H. Bosch, and M. J. A. M. Van Putten, “Cerebral Recovery Index: Reliable Help for Prediction of Neurologic Outcome After
Cardiac Arrest,”Critical Care Medicine, vol. 45, no. 8, p. 1, 2017.
[11] S. Asgari, H. Moshirvaziri, F. Scalzo, and N. Ramezan-Arab, “Quantitative measures of EEG for prediction
of outcome in cardiac arrest subjects treated with hypothermia: a literature review,” Journal of Clinical
Monitoring and Computing, vol. 0, no. 0, pp. 1–16, 2018.
[12] G. Citerio, A. Patruno, S. Beretta, L. Longhi, B. Frigeni, L. Lorini, A. Patruno, S. Beretta, L. Gandini,
F. Sala et al., “Implementation of continuous qEEG in two neurointensive care units by intensivists: a
feasibility study,”Intensive Care Medicine, vol. 43, no. 7, pp. 1067–1068, 2017.
[13] D. M. W. Hilkman, W. N. K. A. V. Mook, W. H. Mess, and V. H. J. M. V. Kranen-Mastenbroek, “The Use of
Continuous EEG Monitoring in Intensive Care Units in The Netherlands : A National Survey,”Neurocritical
Care, 2018.
[14] T. L. May, R. R. Riker, and D. B. Seder, “Do We Need Continuous Electroencephalography After Cardiac
Arrest?” Resuscitation, vol. 136, pp. 136–137, 2019.
[15] B. Foreman and J. Claassen, “Quantitative EEG for the detection of brain ischemia,”Critical Care, vol. 16,
no. 2, p. 216, 2012.
[16] M. Rijsdijk, F. Leijten, and A. Slooter, “Continuous EEG monitoring in the intensive care unit,”netherlands
[17] S. G. Abdel Baki, A. Omurtag, A. A. Fenton, and S. Zehtabchi, “The new wave: time to bring EEG to the
emergency department,”International Journal of Emergency Medicine, vol. 4, no. 1, p. 36, 12 2011.
[18] E. Niedermeyer,Electroencephalography: Basic Principles, Clinical Applications, and Related Fields.
Lip-pincott Williams & Wilkins.
[19] B. J. Kolls, D. W. M. Olson, W. B. Gallentine, M. B. Skeen, C. T. Skidmore, and S. R. Sinha, “Electroenceph-alography Leads Placed by Nontechnologists Using a Template System Produce Signals Equal in Quality to
Technologist-Applied, Collodion Disk Leads,”Journal of Clinical Neurophysiology, vol. 29, no. 1, pp. 42–49,
2012.
[20] P. Lepola, “Novel EEG Electrode Set for Emergency Use,” Ph.D. dissertation, University of Eastern Finland, 2014.
[21] M. C. Tjepkema-Cloostermans, J. Hofmeijer, H. W. Hom, F. H. Bosch, and M. J. Van Putten, “Predicting
outcome in postanoxic coma: Are ten EEG electrodes enough?” Journal of Clinical Neurophysiology, vol. 34,
no. 3, pp. 207–212, 2017.
[22] University of Eastern Finland, “New EEG electrode set for fast, easy measurement of brain function
abnor-malities,”ScienceDaily, 2014.
[23] G. Citerio, “Quantitative EEG in ICu Useful and Feasible,”ICU Management & Practice, no. 1, 2017.
[24] L. M. Moura, M. M. Shafi, M. Ng, S. Pati, S. S. Cash, A. J. Cole, D. B. Hoch, E. S. Rosenthal, and M. B.
Westover, “Spectrogram screening of adult EEGs is sensitive and efficient,” Neurology, vol. 83, no. 1, pp.
56–64, 2014.
[25] C. W. Callaway, “Neuroprognostication postcardiac arrest: translating probabilities to individuals,”Current
Opinion in Critical Care, vol. 24, no. 3, pp. 158–164, 2018.
[26] S. H. Oh, K. N. Park, Y. M. Shon, Y. M. Kim, H. J. Kim, C. S. Youn, S. H. Kim, S. P. Choi, and S. C. Kim, “Continuous Amplitude-Integrated Electroencephalographic Monitoring Is a Useful Prognostic Tool for
Hypothermia-Treated Cardiac Arrest Patients,”Circulation, vol. 132, no. 12, pp. 1094–1103, 2015.
[27] M. L. Scheuer and S. B. Wilson, “Data Analysis for Continuous EEG Monitoring in the ICU : Seeing the
Forest and the Trees,”Journal of Clinical Neurophysiology, vol. 21, no. 5, pp. 353–378, 2004.
[28] B. Ahmed, R. Tafreshi, and R. Langari, “The Future of Automatic EEG Monitoring in the Intensive Care,” 2008 International Conference on BioMedical Engineering and Informatics, pp. 520–524, 2008.
[29] J. C. Rittenberger, A. Weissman, M. Baldwin, K. Flickinger, M. J. Repine, F. X. Guyette, A. A. Doshi, C. Dezfulian, C. W. Callaway, and J. Elmer, “Preliminary experience with point-of-care EEG in post-cardiac
arrest patients,”Resuscitation, vol. 135, no. August 2018, pp. 98–102, 2019.
[30] D. G. Biasucci, A. Caricato, and G. Citerio, “qEEG by neurointensivists: research agenda and implications
for training,”Intensive Care Medicine, vol. 43, no. 11, pp. 1747–1748, 2017.
[31] Y. Bai, D. Sow, P. Vespa, and X. Hu, “Real-Time Processing of Continuous Physiological Signals in a
Neuro-critical Care Unit on a Stream Data Analytics Platform,”Acta Neurochirurgica, Supplementum, vol. 122, pp.
75–80, 2016.
[32] E. Efthymiou, R. Renzel, C. R. Baumann, R. Poryazova, and L. L. Imbach, “Predictive value of EEG in
postanoxic encephalopathy: A quantitative model-based approach,”Resuscitation, vol. 119, pp. 27–32, 2017.
[33] B. J. Ruijter, M. C. Tjepkema-Cloostermans, S. C. Tromp, W. M. v. d. Bergh, N. A. Foudraine, F. H. Kornips,
G. Drost, E. Scholten, F. H. Bosch, A. Beishuizenet al., “Platform Session - Electroencephalography/Epilepsy:
EEG for the prediction of outcome within the first five days of postanoxic coma: A prospective multicenter
cohort study,”Clinical Neurophysiology, no. 129, pp. e231–e232, 2018.
[34] M. Rundgren, E. Westhall, T. Cronberg, I. Rosén, and H. Friberg, “Continuous amplitude-integrated
elec-troencephalogram predicts outcome in hypothermia-treated cardiac arrest patients,”Critical Care Medicine,
vol. 38, no. 9, pp. 1838–1844, 9 2010.
R. K. Elswick, “The Richmond Agitation-Sedation Scale: Validity and reliability in adult intensive care unit
patients,”American Journal of Respiratory and Critical Care Medicine, vol. 166, no. 10, pp. 1338–1344, 2002.
[36] E. G. J. Zandbergen, J. G. van Dijk, C. Hoedemaekers, J. Horn, A. Hijdra, M. A. Kuiper, J. van der Naalt,
and D. F. Zandstra, “Richtlijn Prognose van Post-Anoxisch Coma,”Richtlijnwerkgroep Post-anoxisch coma,
pp. 1–23, 2011.
[37] B. Jennett, “Assessment of Outcome after Severe Brain Damage: A Practical Scale,” The Lancet, vol. 305,
no. 7905, pp. 480–484, 3 1975.
[38] R. O. Cummins, D. Chamberlain, N. Abramson, M. Allen, P. Baskett, L. Becker, L. Bossaert, H. Delooz,
W. Dick, M. Eisenberg et al., “Recommended guidelines for uniform reporting of data from out-of-hospital
cardiac arrest: the ’Utstein style’. A Statement for Health Professionals From a Task Force of the American
Heart Association, the European Resuscitation Council, the Heart and Stro,”Circulation, no. 84, p. 960–975,
1991.
[39] L. J. Hirsch, S. M. LaRoche, N. Gaspard, E. Gerard, A. Svoronos, S. T. Herman, R. Mani, H. Arif, N. Jette,
Y. Minazadet al., “American Clinical Neurophysiology Society’s Standardized Critical Care EEG
Termino-logy,”Journal of Clinical Neurophysiology, vol. 30, no. 1, pp. 1–27, 2 2013.
[40] T. K. Koo and M. Y. Li, “A Guideline of Selecting and Reporting Intraclass Correlation Coefficients for
Reliability Research,”Journal of Chiropractic Medicine, vol. 15, no. 2, pp. 155–163, 6 2016.
[41] J. R. Landis and G. G. Koch, “The Measurement of Observer Agreement for Categorical Data Published by : International Biometric Society Stable URL : http://www.jstor.org/stable/2529310 Accessed : 02-03-2016 17
: 57 UTC Your use of the JSTOR archive indicates your acceptance of the Ter,” Biometrics, vol. 33, no. 1,
pp. 159–174, 1977.
[42] R Core Team, “R: A Language and Environment for Statistical Computing,” 2018.
[43] A. Liaw and M. Wiener, “Classification and regression by randomForest.”R News, vol. 2, no. December 2002,
pp. 18–22, 2002.
[44] A. Palczewska, J. Palczewski, R. M. Robinson, and D. Neagu, “Interpreting random forest classification
models using a feature contribution method,” Advances in Intelligent Systems and Computing, vol. 263, pp.
193–218, 2013.
[45] A. Palczewska and R. M. Robinson, “rfFC: Random Forest Feature Contributions,” 2017.
[46] S. Pati, L. McClain, L. Moura, Y. Fan, and M. B. Westover, “Accuracy of Limited-Montage
Electroenceph-alography in Monitoring Postanoxic Comatose Patients,”Clinical EEG and Neuroscience, vol. 48, no. 6, pp.
422–427, 2017.
[47] J. Kortelainen, E. Väyrynen, I. Juuso, �. J. Laurila, �. J. Koskenkari, and T. Ala-Kokko, “Forehead electrodes sufficiently detect propofol-induced slow waves for the assessment of brain function after cardiac arrest,” Journal of Clinical Monitoring and Computing, vol. 0, no. 0, p. 0, 2019.
[48] S. Myllymaa, A. Muraja-Murro, S. Westeren-Punnonen, T. Hukkanen, R. Lappalainen, E. Mervaala, J. Töyräs, K. Sipilä, and K. Myllymaa, “Assessment of the suitability of using a forehead EEG electrode
set and chin EMG electrodes for sleep staging in polysomnography,”Journal of Sleep Research, vol. 25, no. 6,
pp. 636–645, 12 2016.
[49] T. Miettinen, K. Myllymaa, A. Muraja-Murro, S. Westeren-Punnonen, T. Hukkanen, J. Töyräs, R. Lap-palainen, E. Mervaala, K. Sipilä, and S. Myllymaa, “Screen-printed ambulatory electrode set enables accurate
diagnostics of sleep bruxism,”Journal of Sleep Research, vol. 27, no. 1, pp. 103–112, 2 2018.
[50] A. Muraja-Murro, E. Mervaala, S. Westeren-Punnonen, P. Lepola, J. Töyräs, S. Myllymaa, P. Julkunen, A. M. Kantanen, R. Kälviäinen, and K. Myllymaa, “Forehead EEG electrode set versus full-head scalp EEG
in 100 patients with altered mental state,”Epilepsy and Behavior, vol. 49, no. October, pp. 245–249, 2015.
[51] Bittium, “Bittium BrainStatus EEG electrode, 10pcs,” 2019.
![Figure 3.2: Schematic overview of used EEG montages, with electrode positions in the 10-20 system[18], Ref =reference and G = ground](https://thumb-us.123doks.com/thumbv2/123dok_us/9632220.465704/16.595.97.497.149.372/figure-schematic-overview-montages-electrode-positions-reference-ground.webp)


![Figure 4.5: Inclusion flowchart - Schematic overview of subject inclusion process into the different training andtest sets, with N = total [Poor outcome/Good outcome at 6 months after cardiac arrest]](https://thumb-us.123doks.com/thumbv2/123dok_us/9632220.465704/22.595.32.567.130.711/inclusion-flowchart-schematic-overview-inclusion-different-training-outcome.webp)