http://wrap.warwick.ac.uk
Original citation:
Liu, Jun, Wilson, John, Strangwood, Martin, Davis, Claire L., Peyton, Anthony and
Parker, Jonathan. (2015) Electromagnetic evaluation of the microstructure of grade 91
tubes/pipes. International Journal of Pressure Vessels and Piping, Volume 132-133 . pp.
65-71.
Permanent WRAP url:
http://wrap.warwick.ac.uk/67987
Copyright and reuse:
The Warwick Research Archive Portal (WRAP) makes this work of researchers of the
University of Warwick available open access under the following conditions.
This article is made available under the Creative Commons Attribution 4.0 International
license (CC BY 4.0) and may be reused according to the conditions of the license. For
more details see:
http://creativecommons.org/licenses/by/4.0/
A note on versions:
The version presented in WRAP is the published version, or, version of record, and may
be cited as it appears here.
Electromagnetic evaluation of the microstructure of Grade 91
tubes/pipes
Jun Liu
a,*, John Wilson
b, Martin Strangwood
a, Claire L. Davis
a,1, Anthony Peyton
b,
Jonathan Parker
caSchool of Metallurgy and Materials, University of Birmingham, Edgbaston, Birmingham B15 2TT, UK bSchool of Electrical and Electronic Engineering, The University of Manchester, Manchester M13 9PL, UK cElectrical Power Research Institute, 1300 West W.T. Harris Boulevard, Charlotte NC 28262, USA
a r t i c l e i n f o
Article history:
Received 11 June 2014 Received in revised form 27 March 2015 Accepted 12 May 2015 Available online 3 June 2015
Keywords:
Grade 91 steel EM sensor Relative permeability BH loop
Tube
a b s t r a c t
This paper assesses the feasibility of transferring a laboratory-based electromagnetic (EM) sensor technique, which has already proved sensitive to significant (e.g. phase balance) or subtle (e.g. number density of fine precipitates) microstructural changes in steel, to non-destructive evaluation of the microstructure of power generation components such as tubes/pipes. It has been found that Grade 91 steels, in different conditions representative of service entry, thermally aged or ex-service, can be distinguished using laboratory-based measurement systems on small machined cylindrical samples as well as by an industry deployment EM sensor system on full-diameter tube samples. The measurements for the tube samples follow the same trend as the machined cylindrical samples. The results indicate an industrial deployable sensor system can be used for sorting service-exposed or mis-heat-treated/mis-manufactured Grade 91 steel tubes/pipes from the correctly heat treated service-entry ones.
©2015 The Authors. Published by Elsevier Ltd. This is an open access article under the CC BY license (http://creativecommons.org/licenses/by/4.0/).
1. Introduction
Grade 91 steels are widely used in the power generation in-dustry for high-temperature components such as boiler tubes and steamline pipes. They are usually heat treated or supplied in the as normalized and tempered condition before entering service [1]. However, there is evidence that mis-manufactured, or mis-heat-treated, materials/components have been supplied [2]. Impor-tantly, traditional methods for quality checking have not always identified the presence of the mal-heat treatment [3]. Using a component with an incorrect microstructure in service has resulted in product failure at times below that expected by that of Design Codes[4]. To avoid mis-heat-treated material from entering service a fast, accurate and non-destructive sorting tool is needed.
Commercial sorting tools such as the X-Rayfluorescence analyzer, which can sort steel grades by analyzing the alloy element contents, are not sensitive to microstructure and hence not able to distin-guish between steels of the same grade but different microstruc-tures due to different heat treatment conditions or service history. The conventional inspection techniques for microstructure assessment currently used by the power generation industries, such as examination of surface replicas or hardness measurements are only suitable for limited spot checks [3]. Moreover hardness measurement lacks specificity to fine microstructural detail, and similar information can result from steels with a surface decar-burisation layer compared to mis-heat-treated steels. Thus, a non-destructive technique, to complement hardness testing, for the assessment of the microstructure in Grade 91 steels would be of significant benefit.
Magnetic hysteresis loop (or BH loop) and Magnetic Barkhausen Emission (MBE) techniques have been used to evaluate micro-structural changes in Grade 91 steels during creep tests under 125 MPa stress at 600C[5,6]or tempering at different tempera-tures (ranging from 650C to 950C)[7]. Changes in the magnetic properties such as coercivity (Hc) and remanence (Br) or the MBE parameters such as the peak height/position of the root mean square (RMS) of voltage profiles were correlated to microstructural *Corresponding author. Present address: Warwick Manufacturing Group,
Uni-versity of Warwick, Coventry CV4 7AL, UK. The underlying data behind this article may be accessed through the corresponding author.
E-mail addresses: [email protected], [email protected] (J. Liu), john.
[email protected] (J. Wilson), [email protected]
(M. Strangwood),[email protected](C.L. Davis), a.peyton@manchester. ac.uk(A. Peyton),[email protected](J. Parker).
1 Present address: Warwick Manufacturing Group, University of Warwick,
Coventry CV4 7AL, UK.
Contents lists available atScienceDirect
International Journal of Pressure Vessels and Piping
j o u r n a l h o m e p a g e : w w w .e l se v i e r .co m/ l o ca t e / ij p v p
http://dx.doi.org/10.1016/j.ijpvp.2015.05.009
changes (e.g. precipitation of large carbides or Laves phase[5,6]), mechanical hardness[7], or used to indicate different creep stages [5]. Moorthy reported double peaks in the MBE profiles for a P9 and a T22 steel after tempering for different times and correlated them generally to the domain walls overcoming pinning from pre-cipitates or grain boundaries respectively[8]; however, the role of the precipitate location e.g. on the martensitic lath boundaries (expected to be minor) or within the laths (important role) was not considered. Bong et al. [9] reported evaluating remnant life of Grade 91 steels by looking at the relationship between a parameter called Peak Interval of Reversible Magnetic Permeability (PIRMPz twice the coercivity force) measured using a laboratory-based EM sensor system and the LarsoneMiller parameter (LMP). It was re-ported that the PIRMP data were practically insensitive to the LarsoneMiller parameter after a LMP of 21965 (i.e. equivalent to a thermal exposure at 610C for 75,000 h or about 8.5 years, which would still be in the early stage of the expected service life for a T91 steel tube) and whilst the mechanical properties, such as yield stress or tensile strength, are much more sensitive than the PIRMP to the LMP.
Multi-frequency EM sensors have proved sensitive to changes in ferrite (
a
)/austenite (g
), shown using model alloys, in-situ analysis and FE based modeling software[10,11]. Prototype EM sensors are being used for in-situ monitoring of theg
/a
transformation during steel processing[12]. EM sensors have also been used to detect decarburisation, shown with high carbon steels for on-line and off-line monitoring[13,14]. The theory as to how the relative permeability and resistivity of a sample affect the multi-frequency EM response, for any sensor geometry, is presented elsewhere[15]. It has been shown that the multi-frequency EM sensors are able to detect the initial relative permeability and resistivity changes, resulting from microstructural changes in P9 and T22 power plant steels during service at high temperatures [16]. The developed laboratory-based EM sensor is also capable of differentiating P91 steels with different N:Al ratios in the short term tempered or long term aged condition, based on the principle that the N:Al ratio significantly affects the number density of intra-lath MX carboni-tride precipitates[17]. These precipitates determine the mean free path to magnetic domain wall motion and hence the initial relative permeability of the steels and the EM signals.Whilst a variety of related EM systems for microstructural changes have been developed for laboratory-based assessment there are no reports of industrial deployable sensors which have been successful in sorting mis-heat treated materials. This paper
assesses the feasibility of transferring the present laboratory-based EM sensor technique that has already proved sensitive to structural changes, to non-destructive evaluation of the micro-structure of power generation components such as steel tubes/ pipes. Potential applications include sorting materials e.g. the mis-heat-treated or mis-manufactured materials from normal service-entry ones, amongst others, such as microstructural changes dur-ing service.
2. Materials and experimental details
T91 steel tubes (53 mm outer diameter, 13.5 mm wall thickness and >900 mm length) were supplied by the Electrical Power Research Institute (EPRI) as normalized at 1060C for 20 min and tempered at 780C for 1 h. The chemical composition of the steel is given in Table 1. Cylindrical samples (4.95 mm diameter and 100 mm length) were machined from the tube for EM sensor measurements using a laboratory-based cylindrical sensor and a laboratory-based BH loop measurement system. Selected cylindri-cal samples have been heat treated to different conditions in lab-oratory furnaces to simulate the microstructures expected of prolonged thermal exposure by accelerated tempering at 780C for 100 h or mis-heat treatments/mis-manufacturing. The accelerated tempering condition was chosen because it generated significant microstructural degradation and was also achievable for large demonstration tube samples. The mis-heat-treatment was simu-lated by the following procedure [18] in order to generate a partially ferritic structure rather than a fully martensitic one on air cooling:
1) heating up to 950C and dwelling for 30 min;
2) programmed furnace cooling by 100C/h down to 760C; 3) dwelling for 3 h;
4) cooling in still air.
These heat treatments were carried out on two lengths (250 mm length) of full diameter tube samples, for demonstration trials, in industrial furnaces. T91 tubes of approximately 44.5 mm outer diameter, 6.3 mm wall thickness and<70 mm length that had been taken from service as an antler tube on a superheater outlet header at 585C under 16.5 MPa pressure (designed) for about 50,000 h were supplied. The specific chemical composition of the steel is not presently available but the composition did comply with the applicable specification. Cylindrical samples (4.95 mm diameter and 50 mm length) were machined from the tube for EM measurements.
Metallographic samples were polished to a 0.25
m
m diamond pastefinish and etched in Kallings reagent. A Field Emission Gun Scanning Electron Microscope (FEGeSEM) and an EDS system were used to obtain SEM micrographs and analyze alloy contents at selected points/areas. Additional metallographic samples were polished to a 1m
m diamond paste finish followed by several etchingepolishing cycles and a final polishing with OPS (oxide polishing suspension) for 10 min for electron backscattering diffraction (EBSD) analysis using an EBSD in a FEGeSEM. Lath boundaries and grain boundaries in SEM micrographs were reconstructed as trace features and objects respectively using ImageePro Plus. Average distances between two neighbouring trace features were taken as the lath width.A four-point probe technique was employed to independently measure the resistivity of the steels with a direct current Cropico DO5000 micro-ohmmeter at room temperature using machined cylinder specimens of 4.95 mm diameter. The resistivity values were used as input into a Comsol model (described later) to determine the relative permeability values.
Nomenclature
m
r relative permeabilityu
angular frequency B magnetic induction Br remanenceH magneticfield strength
Hc coercive force for the non-saturated major loops for the tubes
Hc coercivity
M mutual inductance
M0 inductance at low frequencies
Z trans-impedance EM Electromagnetic
LMP LarsoneMiller parameter MBE Magnetic Barkhausen Emission
PIRMP Peak Interval of Reversible Magnetic Permeability
J. Liu et al. / International Journal of Pressure Vessels and Piping 132-133 (2015) 65e71
A cylindrical EM sensor consisting of one exciting coil and one sensing coil both wound around an insulating tube of 5.5 and 6.5 mm inner and outer diameters, respectively, was used to carry out the EM sensor tests on the same cylindrical specimens as for the resistivity measurements. The sensor was operated at 3 V and over a range of frequencies from 10 Hz to 1 MHz. Signals detected by the sensing coil were recorded and processed by a Solartron Analytical Model S1260 Impedance Analyzer to give the complex trans-impedanceZ, from which the mutual inductanceMwas calculated asM¼Z/j
u
whereu
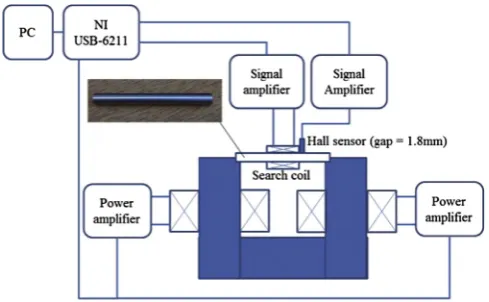
is angular frequency andjthe imaginary unit. A schematic diagram of the system, developed to measure magnetic major and minor loops, for the machined cylindrical samples is shown inFig. 1. A low frequency time varying signal is fed to two power amplifiers, which supply current to two excitation coils wrapped around a silicon-steel core. The cylindrical sample isfitted into a slot in the core, to maximise coupling between the core and sample. The axial appliedfield (H) is measured using a Quan-tum Well Hall sensor, developed by Professor M Missous at the University of Manchester[19]. Theflux density of the inducedfield (B) is measured using a 20eturn encircling coil connected to an instrumentation amplifier. For the major loops, 1 Hz sinusoidal excitation is used and 9 cycles are recorded and averaged.
The test system used for the demonstration tube samples (Fig. 2) is an adaptation of the laboratory-based system shown inFig. 1. A Uecore, contoured to the profile of the tube, provides excitation. The excitation system is similar to that shown inFig. 1; in this case the Uecore is wrapped with two 160eturn excitation coils. Field strength,H, measurement is accomplished using a Quantum Well Hall sensor positioned 1.8 mm from the sample surface. Flux den-sity,B, measurement is inferred via a 10eturn coil, encircling the leg of the excitation yoke. The signal conditioning system and signal processing techniques are similar to those detailed for the laboratory-based system described above.
3. Results and discussion
3.1. Microstructures
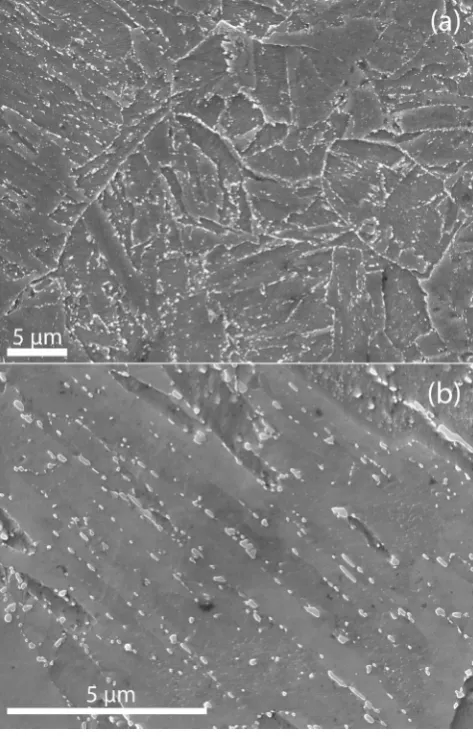
The as-received T91 tube (T91-AR) shows a microstructure of tempered martensite consisting of martensitic laths with many pre-cipitates (mainly M23C6) on the lath boundaries, as shown inFig. 3.
Fig. 4shows the distribution of the martensitic lath widths with a mode value at around 0.37
m
m. The mean lath width (0:36±0:18m
m) is consistent with the reported typical lath width for service-entry Grade 91 steel (0.25e0.5m
m[20]). No precipitates can be observed within the laths, in these scanning electron micrographs,Fig. 3(b). It should be noted that precipitates within laths would typically be MX type with an average size of around 45 nm[21].After tempering at 780 C for 100 h, the laths and the pre-cipitates have significantly coarsened and a number of equi-axed sub-grains have developed. A typical micrograph is shown in Fig. 5. Thisfigure indicates that a significant degeneration of the tempered martensite (i.e. loss of martensitic lath structure as a result of the development of equi-axed sub-grains) had occurred. The degree of change in the microstructure is comparable with degeneration due to prolonged service exposure[22,23]. Most of the precipitates are still on the lath boundaries or the sub-grain boundaries and some relatively fine precipitates now resolvable within the sub-grains or laths.
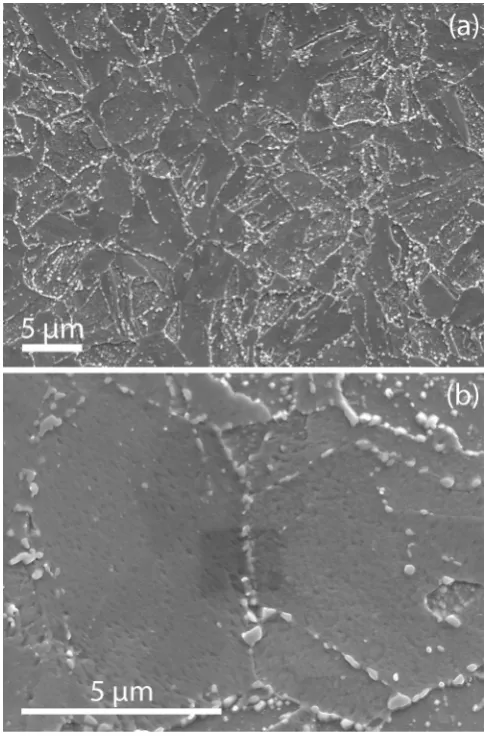
The simulated mis-heat treatment successfully produced a ferritic microstructure consisting of equi-axed ferrite grains, as ex-pected from industry experience[18]. A high number density of coarse precipitates were present on the ferrite grain boundaries and many coarse andfine precipitates were observed within the grains, as shown inFig. 6(a).Fig. 6(b) shows the distribution of the ferrite grain sizes (equivalent circle diameter) with a range of 3.0e26.7
m
m, a mode of 8.4m
m and a mean and standard deviation of 12:0±6:6m
m indicating a significant increase in effective microstructural scale compared with correctly heat treated martensite lath width.The ex-service T91 (T91-ES) tube shows a microstructure of slightly degenerated martensite with slightly increased lath size as compared to the T91-AR sample and some equi-axed subgrains having developed, as shown inFig. 7(a). Few precipitates within the laths or grains have been observed as shown inFig. 7(b).
3.2. EM measurements
[image:4.595.42.561.85.113.2]3.2.1. Laboratory-based cylindrical EM sensor measurements Fig. 8shows EM measurements of the real part of the mutual inductance as a function of frequency for the T91 samples in the Table 1
Chemical composition (weight percent) of the as-received T91 tube materials.
C Si Mn P S Cr Mo Ni V Nb N Ti
0.11 0.271 0.469 0.015 0.003 8.9 1.00 0.135 0.169 0.055 0.046 0.003
[image:4.595.312.557.543.694.2]Fig. 1.A schematic of BH loop, minor loop and MBN measurement system for cylin-drical machined samples.
[image:4.595.46.291.567.718.2]different conditions using the cylindrical EM sensor. The real inductance is essentially independent of frequency over the low frequency (approximately 10e100 Hz) range then drops continu-ously with increasing frequency until it approaches a small
negative value at very high frequencies (over approximately 0.1 MHz). For conciseness, the inductance value at low frequencies (here taken as the value for 10 Hz) has been used as a characteristic inductance parameterM0(as this is known to be sensitive to the
relative permeability,
m
r, of the material); the values of which are given inTable 2. [image:5.595.308.548.64.429.2]A 2D axisymmetricfinite element (FE) model was developed for modeling the sensor signal output in response to a steel sample of given resistivity and relative permeability using Comsol Multi-physics software. The resistivity values of the modeled samples were taken from the experimental measurements and the relative permeability values determined by fitting the modeled real inductance with the experimental measurement based on a nonlinear least square method with 26 frequency points from 10 Hz to 1 MHz (logarithmically spaced) in Comsol LiveLink for Matlab. Closefits between the modeled and measured real inductance for all the samples have been achieved as shown inFig. 8. It should be noted the EM measurement for the T91-ES sample is not directly comparable with the other samples because the sample length (50 mmemaximum possible from the component received) is only half the length of the other samples. However, the relative permeability, as a material property, is independent of sample ge-ometry. The expected EM sensor response for a 100 mm length T91-ES sample was predicted with Comsol using the fitted relative permeability value and the measured resistivity value and is also shown onFig. 8.
Fig. 3.SEM micrographs for the as-received T91 (T91-AR) in (a) high and (b) higher magnification.
[image:5.595.39.276.67.436.2]Fig. 4.Lath width distribution for the as received T91 (T91-AR) sample.
Fig. 5.Micrographs for the T91 as tempered at 780C for 100 h (T91-T100h) (a) SEM (b) EBSD image quality map. Examples of equi-axed subgrains and significantly coarsened carbide precipitates are marked by black and white arrows respectively.
J. Liu et al. / International Journal of Pressure Vessels and Piping 132-133 (2015) 65e71
[image:5.595.51.266.542.725.2]It can be seen fromFig. 8andTable 2that the T91 samples in the different conditions can be clearly distinguished from each other, from the inductance parameterM0, using the cylindrical EM sensor.
It should be noted that the present laboratory-based EM sensor are sensitive to initial permeability or relative permeability for small magneticfields, where domain wall motion can be treated as approximately reversible. That is, domain walls return to their original positions after application and removal of an appliedfield or, in an alternated currentfield, oscillate between neighboring pinning sites. This has been discussed in our previous paper[16], which demonstrated that the low frequency inductance, M0,
in-crease with the initial relative permeability exponentially and the latter is affected by the microstructural features that determine the mean free path for domain wall motion in a small magneticfield. For the service-entry T91 (T91-AR) samples martensitic lath boundaries are the predominant pinning features to domain wall motion. The precipitates on the lath/grain boundaries play a minor role in pinning domain wall motion. Therefore the mean free path to domain wall motion is determined by the martensitic lath width. For the mis-heat treated sample (T91-M) both the precipitates within the grains and the grain boundaries are major pinning sites to domain wall motion whilst the precipitates on the grain boundaries play a minor role in domain wall motion. In this case, the mean free path is determined by the mean spacing between the
[image:6.595.48.289.64.441.2]pinning features (i.e. the intra-grain particles and the grain boundaries) or, equivalently, by the number density of the pre-cipitates and the grain boundaries (i.e. the grain size). The signifi -cantly higher relative permeability of the mis-heat treated samples Fig. 6.(a) SEM micrograph and (b) grain size distribution for the mis-heat-treated T91
[image:6.595.315.558.65.434.2](T91-M) sample.
Fig. 7.SEM micrographs for the ex-service T91 tubes (T91-ES) at (a) high and (b) higher magnification.
[image:6.595.321.551.524.701.2]can therefore be attributed to the increased mean free path to domain wall motion due to the inter particle spacing (and grain size) being larger than the martensitic lath size of the T91-AR sample. For the as-tempered T91 (T91-T100h) and the ex-service T91 (T91-ES) samples two types of microstructural features, i.e. the lath boundaries and the sub-grain boundaries, are effective pinning features to domain wall motion. Therefore the mean free path to domain wall motion, and hence the relative permeability, are collectively determined by the martensitic lath widths and the sub-grain size. Accordingly, the significant coarsening of the martensitic laths as well as the sub-grain development after the accelerated long tempering increase the mean free path to domain wall motion and hence the relative permeability significantly. Similarly, the slightly greater relative permeability for the ex-service (T91-ES) than the as-received T91 (T91-AR) is expected of the coarsening of the martensitic laths and the sub-grain devel-opment increasing the mean free path to domain wall motion after the service exposure.
3.2.2. Laboratory-based major BH loop measurements
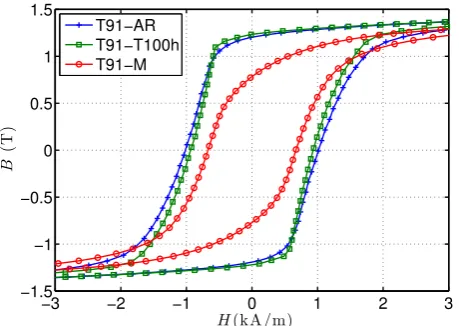
Fig. 9 shows the major BH loops for the T91 samples in the different conditions measured using the lab-based BH measure-ment system on the cylindrical samples. The three samples can be clearly distinguished. The measured coercivity,Hc, values (extrac-ted from the BH loops) dropped by approximately 9% and 31% after the accelerated tempering and the mis-heat treatment respectively, as can be seen inTable 2. The trend inHcvalues follows a qualita-tively similar trend to the Vickers Hardness. The agreement in these trends indicates that as reported in the literature e.g. Ref.[7]there is a relationship between mechanical and magnetic hardness. The drop in the coercivity value after accelerated tempering can be attributed to lath coarsening, sub-grain development and further recovery of dislocations reducing the number density of
microstructural features impeding domain wall motion. In addition, a smaller reversefield is required for the domain walls to overcome the pinning from these features and bring the sample with rema-nence (i.e. the remaining magnetic induction after the magnetic
field has been removed) back to zero induction. The precipitates on the boundaries play a relatively minor role in pinning domain walls, as the boundaries are major pinning features in this case. The precipitates within the sub-grains become effective in pinning domain walls and tend to increase the coercivity. However, as the lath and sub-grain boundaries are predominant pinning features for the as-tempered T91 (T91-T100h), the net effect is an increase in the overall pinning to domain walls, and hence a decrease in coercivity. The lower coercivity value for the mis-heat-treated sample is expected as the ferritic structure is magnetically softer than a martensitic structure owing to its lower dislocation density and larger grain size compared to the lath width and sub-grain size (or equivalently lower number density of boundaries), which overweigh the magnetic hardening (i.e. increase in coercivity) ef-fect of the large precipitates within the ferrite grains.
[image:7.595.31.562.84.138.2] [image:7.595.45.275.528.691.2]3.2.3. Major loop measurements on tube samples
Fig. 10shows theequivalentmajor loopsdwith a same applied amplitude of excitation current as that for the cylindrical sample measurementdmeasured using the system shown inFig. 2on the T91 tube samples in the three different conditions. Generally the measured coercive force for the amplitude(z 3.4 kA/m) of the major loop for the tube samples,Hc, follow the same trend as the measurements on the machined cylindrical samples, as described inTable 2. It should be noted that, as illustrated in a magneticflux density distribution map of the tube cross-section during a test as schematically shown inFig. 2, the shape of the loops is different due to the particular arrangement of theBvalue measurement and non-uniform B and H field distributions in the tube samples. If the measurements using this system are to be comparable to those Table 2
Measured Vickers hardness and EM values for the T91 samples in the different conditions.
Samples Hardness (HV) Resistivity (107U,m) M
0(105H) mra Hc(kA/m) Hc(kA/m)
T91-AR 237±2:1 5:112±0:019 4:224±0:014 92 1.01 1.11
T91-T100h 195±2:2 5:099±0:035 6:127±0:004 161 0.90 0.86
T91-M 157±3:5 5:085±0:043 6:563±0:008 177 0.70 0.57
T91-ES 219±3:4 4:810±0:036 4:850±0:008 112 e e
am
rwas not directly measured but obtained byfitting the modelled EM sensor signals with experimental measurements.
[image:7.595.311.544.541.716.2]Fig. 9.Major BH loops for the T91 samples in the as received (T91-AR), as tempered (T91-T100h) or as mis-heat treated (T91-M) conditions measured using the laboratory-based BH measurement system on the cylindrical samples, for the [-3 3] kA/m region. The full amplitude of H for the measurements was approximately 36.4 kA/m to ensure saturation of the samples.
Fig. 10.Major BH loops for the T91 tube samples in the as received (T91-AR), as tempered (T91-T100h) or as mis-heat treated (T91-M) conditions.
J. Liu et al. / International Journal of Pressure Vessels and Piping 132-133 (2015) 65e71
from the cylindrical samples and comparable between measure-ments with different pipe diameters, some calibration of the B value must be carried out. However, it is clear from these results, on a single tube diameter, that the industrial deployable sensor for tube samples can be used to separate correctly heat treated and mis-heat treated microstructures at service entry, and can distin-guish microstructural changes due to accelerated ageing.
4. Conclusions
The laboratory-based measurements using both the EM sensor systems and BH loop measurement system have proved capable of distinguishing all the heat-treated and the ex-service T91 samples from the service-entry one. Generally the measured coercivity values for the demonstration tube samples follow the same trend as the measurements on the machined cylindrical samples although there is a sample geometry effect on the absolute values of measured coercivity as well as the shape of the major loops. The results indicate that an industrial deployable sensor system can be used for sorting service-exposed or mis-heat-treated/mis-manufactured Grade 91 steel tubes/pipes from the correctly heat treated service-entry ones provided the tubes/pipes are of same diameter or geometry effect can be addressed with necessary calibration of the measured coercivity or other EM sensor signals.
Acknowledgement
This work was carried out withfinancial support from EPSRC (EP/H023429/1) and EPRI under the grant UOBKTS002. The authors would like to thank EPRI and Ken Mitchell at RWE npower for providing the steel tubes and David Allen at E.ON for providing the mis-heat treatment procedure and industrial furnaces for the heat treatments of the demonstration tube samples at E.ON.
References
[1] H.K.D.H. Bhadeshia, A. Strang, D.J. Gooch, Ferritic power plant steels: rema-nent life assessment and approach to equilibrium, Int. Mater. Rev. 43 (2) (1998) 45e69.
[2] EPRI, Service Experience with Grade 91 Components, 2009, 1018151. [3] EPRI, Review of Weld Repair Options for Grade 91, Part 2: Damage
Develop-ment and Distribution, 2013, 3002000087.
[4] J. Parker, In-service behavior of creep strength enhanced ferritic steels Grade 91 and Grade 92ePart 1 parent metal, Int. J. Pressure Vessels Piping 101 (2013) 30e36.
[5] A. Mitra, J.N. Mohapatra, J. Swaminathan, M. Ghosh, A.K. Panda, R.N. Ghosh, Magnetic evaluation of creep in modified 9Cr-1Mo steel, Scr. Mater. 57 (9) (2007) 813e816.
[6] J.N. Mohapatra, J. Swaminathan, M.K. Ghosh, A. Mitra, Magnetic nondestruc-tive evaluation of creep behavior in water-quenched modified 9Cr-1Mo steel, Metall. Mater. Trans. A 41 (4) (2010) 900e905.
[7] H. Kumar, J.N. Mohapatra, R.K. Roy, R. Justin Joseyphus, A. Mitra, Evaluation of tempering behaviour in modified 9Cre1Mo steel by magnetic non-destructive techniques, J. Mater. Process. Technol. 210 (4) (2010) 669e674.
[8] V. Moorthy, S. Vaidyanathan, T. Jayakumar, B. Raj, On the influence of
tempered microstructures on magnetic Barkhausen emission in ferritic steels, Philos. Mag. A 77 (6) (1998) 1499e1514.
[9] C.J. Bong, K.S. Ryu, S.H. Nahm, E.K. Kim, Nondestructive evaluation for rema-nent life of modified 9Cr-1Mo steel by reversible magnetic permeability, J. Magn. Magn. Mater. 323 (5) (2011) 379e382.
[10] W. Yin, X.J. Hao, A.J. Peyton, M. Strangwood, C.L. Davis, Measurement of permeability and ferrite/austenite phase fraction using a multi-frequency electromagnetic sensor, NDT&E Int. 42 (1) (2009) 64e68.
[11] S.J. Dickinson, R. Binns, W. Yin, C. Davis, A.J. Peyton, The Development of a multifrequency electromagnetic instrument for monitoring the phase trans-formation of hot strip steel, IEEE Trans. Instrum. Meas. 56 (3) (2007) 879e886. [12] A. Peyton, C. Davis, P. Morris, F.D. Van Den Berg, P. Hunt, On line electro-magnetic inspection of steel microstructure during hot processing, in: 1st European Steel Technology & Application Days & 31st Journees Sid e-wrurgiques Internationales (JSI), 2014.
[13] X. Hao, W. Yin, M. Strangwood, A. Peyton, P. Morris, C. Davis, Characterization of decarburization of steels using a multifrequency electromagnetic sensor: experiment and modeling, Metall. Mater. Trans. A 40 (4) (2009) 745e756. [14] X.J. Hao, W. Yin, M. Strangwood, A.J. Peyton, P.F. Morris, C.L. Davis, Off-line
measurement of decarburization of steels using a multifrequency electro-magnetic sensor, Scr. Mater. 58 (11) (2008) 1033e1036.
[15] R.J. Haldane, W. Yin, M. Strangwood, A.J. Peyton, C.L. Davis, Multi-frequency electromagnetic sensor measurement of ferrite/austenite phase frac-tioneExperiment and theory, Scr. Mater. 54 (10) (2006) 1761e1765. [16] J. Liu, M. Strangwood, C. Davis, A. Peyton, Magnetic evaluation of
micro-structure changes in 9Cr-1Mo and 2.25Cr-1Mo steels using electromagnetic sensors, Metall. Mater. Trans. A 44 (13) (2013) 5897e5909.
[17] J. Liu, M. Strangwood, C.L. Davis, J. Parker, Non-destructive characterisation of N/Al level in P91 steels using electromagnetic sensors, Mater. Sci. Technol. 31 (9) (2015) 1042e1050.
[18] P.K. Heywood, Elevated Temperature Tensile Test and Microstructure/Hard-ness Examination of P91 Header Material: Results of tests on Materials’As Supplied from the Mill’and after’Anomalous Heat Treatment’, TEi Metallur-gical Service, 2006. MS201B/06.
[19] N. Haned, M. Missous, Nano-tesla magneticfield magnetometry using an
InGaAseAlGaAseGaAs 2DEG Hall sensor, Sensors Actuators A Phys. 102 (3) (2003) 216e222.
[20] H. Ghassemi-Armaki, R.P. Chen, K. Maruyama, M. Yoshizawa, M. Igarashi,
Static recovery of tempered lath martensite microstructures during long-term
aging in 9e12% Cr heat resistant steels, Mater. Lett. 63 (28) (2009)
2423e2425.
[21] EPRI, Life Management of Creep Strength Enhanced Grade 91 SteeleAtlas of Microstructure, 2013, 3002000080.
[22] C.G. Panait, A. Zielinska-Lipiec, T. Koziel, A. Czyrska-Filemonowicz,
A.F. Gourgues-Lorenzon, W. Bendick, Evolution of dislocation density, size of subgrains and MXetype precipitates in a P91 steel during creep and during
thermal ageing at 600C for more than 100,000h, Mater. Sci. Eng. A 527
(16e17) (2010) 4062e4069.
![N (3 Cyano 2 oxo 2,5,6,7,8,9 hexahydro 1H cyclohepta[b]pyridin 1 yl) 4 methylbenzenesulfonamide](data:image/gif;base64,R0lGODlhAQABAIAAAP///wAAACH5BAEAAAAALAAAAAABAAEAAAICRAEAOw==)