warwick.ac.uk/lib-publications
A Thesis Submitted for the Degree of PhD at the University of Warwick
Permanent WRAP URL:
http://wrap.warwick.ac.uk/79967
Copyright and reuse:
This thesis is made available online and is protected by original copyright. Please scroll down to view the document itself.
Please refer to the repository record for this item for information to help you to cite it. Our policy information is available from the repository home page.
University of Warwick
Modelling and Simulation Study of IGCC
Power Plant with Activated Carbon-based
Carbon Capture Process
by
Yue Wang
Thesis
Submitted to the University of Warwick
for the degree of
Doctor of Philosophy
School of Engineering
ii
Table of Contents
List of Figures vii
List of Tables xvi
List of Symbols and Abbreviations xix
Chapter 1 Introduction ... 1
1.1 Background ... 1
1.2 Study Aims and Methodology ... 2
1.3 Thesis Outlines ... 4
1.4 Publications ... 7
Chapter 2 Introduction of IGCC Power Plant and Overview of the Major Sub-Systems .... 9
2.1 Overview of the IGCC Technology Development ... 9
2.2 Description of An IGCC Process ... 12
2.2.1 Introduction of the whole process ... 12
2.2.2 Introduction of Gasifier ... 14
2.2.3 Water Gas Shift Reactor ... 26
2.2.4 Acid Gas Removal (AGR)... 27
2.2.5 Gas Turbine and Combined Cycle ... 29
iii
2.3 Summary ... 31
Chapter 3 Zero-dimension Mathematical Model of Gasification Process Based on Texaco Gasifier 33 3.1 Description of Texaco Gasifier Process ... 33
3.2 Mathematical Model of Texaco Gasifier ... 35
3.2.1 Overview of the Texaco Gasifier Model Development ... 35
3.2.2 Texaco Gasification Syngas Prediction Model Development ... 36
3.3 Texaco Gasifier Syngas Prediction Results and Discussion ... 47
3.3.1 Steady State Prediction and Model Validation ... 47
3.3.2 Syngas contents change with water/coal ratio change ... 49
3.3.3 Syngas contents change with oxygen/coal ratio change ... 51
3.3.4 Syngas contents change with operation temperature change ... 52
3.3.5 Summary of the Texaco gasifier simulation ... 54
3.4 Model test for other type of gasifier ... 55
3.5 Summary ... 57
Chapter 4 One dimension model of Shell slagging gasifier ... 58
4.1 Introduction of Shell Slagging Gasifier ... 58
iv
4.2.1 “Three Zones” Assumption ... 60
4.2.2 Gasification Model Assumptions ... 61
4.2.3 Shell Gasifier Model Development ... 63
4.3 Model Parameterization and Simulation Procedure ... 77
4.3.1 Model Parameterization... 77
4.3.2 Flow Chart for Simulation ... 79
4.4 Results and Discussion ... 82
4.4.1 Results of Oxygen input step change 1% and 5% ... 82
4.4.2 Results of steam input step change 20% ... 90
Chapter 5 Auxiliary Modules In Gasification Enabled Plant ... 98
5.1 Introduction of Thermolib Software ... 98
5.1.1 Gas Phase Calculation ... 99
5.1.2 Liquid Phase Calculation ... 102
5.1.3 Vapour-liquid Equilibrium Calculation ... 106
5.1.4 Mixture Calculation ... 108
5.1.5 Limitation of Thermolib Software... 109
5.2 Gas Quench Process Model for Shell Gasifier ... 110
v
5.2.2 Syngas Cooling Model ... 114
5.3 Total Water Quench Model for Texaco Gasifier ... 117
5.4 Simplified Water Gas Shift Reactor Model ... 120
5.5 Simplified Sulphur Removal Model ... 128
5.5.1 COS Hydrolysis Reactor ... 128
5.5.2 Simplified H2S Removal Unit ... 130
5.6 Summary ... 131
Chapter 6 Modelling of A Combined Cycle Power Plant ... 132
6.1 Gas Turbine Model ... 132
6.1.1 Introduction of Gas Power Cycle ... 132
6.1.2 Gas Turbine Model Developed with Thermolib ... 139
6.2 HRSG Model ... 143
6.2.1 Introduction of Steam Power Cycle ... 143
6.2.2 Single Stage HRSG Model ... 148
6.2.3 Dual Stage HRSG Model ... 150
6.3 Combined Cycle Power Plant Model... 165
6.4 Summary ... 167
vi
7.1 Introduction of PSA Model Developed by UoB ... 169
7.1.1 Activated Carbon Sample Preparation ... 169
7.1.2 Adsorption Isotherms Model for Activated Carbons ... 170
7.2 PSA Model Development and Analysis ... 181
7.3 Penalty Analysis of IGCC with PSA Carbon Capture Process ... 186
7.4 Discussion of CO2/H2 Based on Experiment Data from UoN ... 190
7.5 Summary ... 190
Chapter 8 Conclusion, Limitations and Future work ... 192
8.1 Conclusions ... 192
8.2 Limitations ... 195
8.3 Future work ... 196
References ... 198
Appendix CHP Model Based on UoW Campus Plant with Applied Controllers ... 203
A.1 Introduction of CHP Power Plant Model ... 203
A.2 Performance Analysis of CHP Power Plant Model ... 212
A.3 Discussion and summary ... 218
vii
List of Figures
Figure 2.1.Simplified Schematics diagram of an IGCC system ... 13
Figure 2.2 Simplified Schematics diagram and temerature filed in a moving bed gasifier .... 16
Figure 2.3 Schematics of Lurgi dry ash gasifier with temperature and gas composition files (Supp, 1990) ... 17
Figure 2.4 Simplified Schematics diagram and temperature profile of a fluid bed gasifier (Simbeck et al., 1993) ... 18
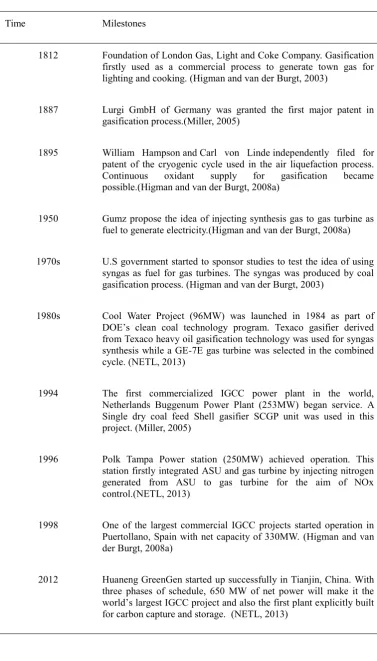
Figure 2.5 Winkler process... 19
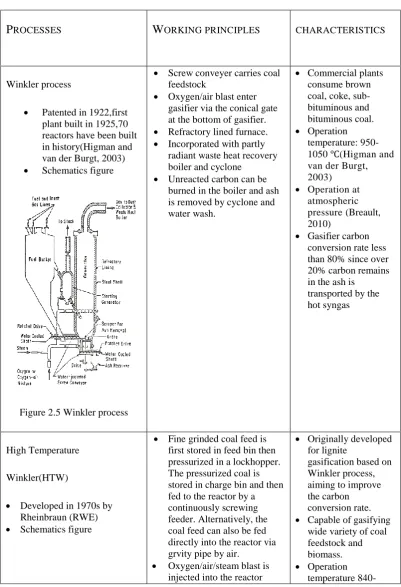
Figure 2.6 HT Winkler gasifier (NETL, 2013) ... 20
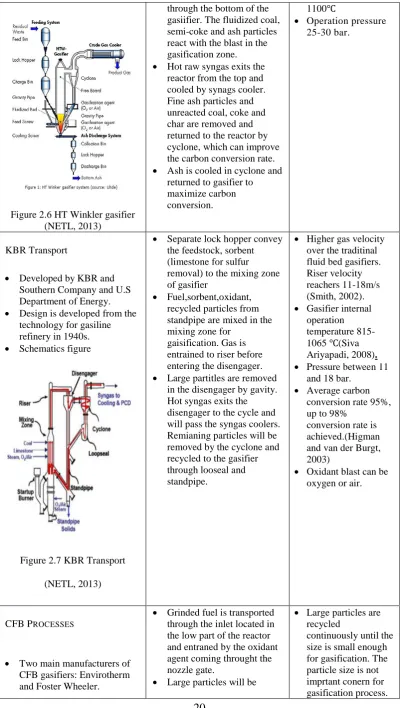
Figure 2.7 KBR Transport ... 20
Figure 2.8 Lurgi CFB gasifier ... 21
Figure 2.9 A top-fired entraned-flow gasifier and its temperaure file(Breault, 2010). ... 22
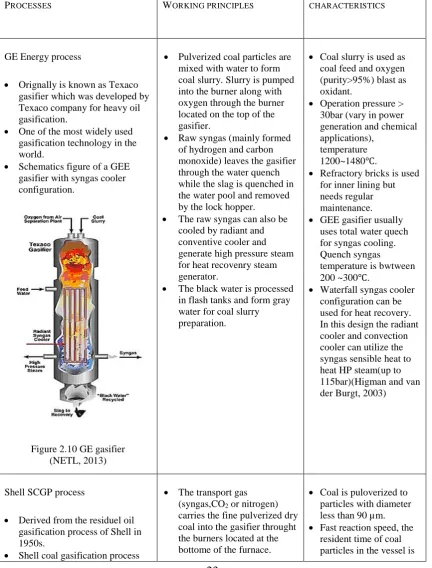
Figure 2.10 GE gasifier ... 23
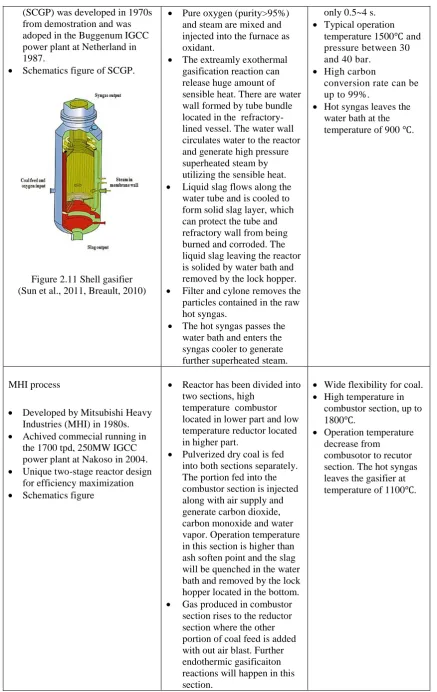
Figure 2.11 Shell gasifier ... 24
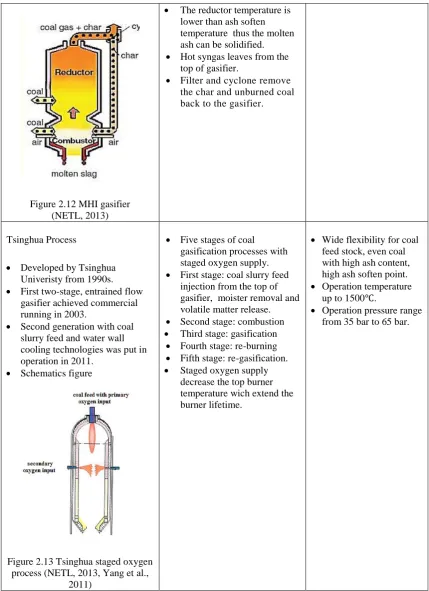
Figure 2.12 MHI gasifier ... 25
Figure 2.13 Tsinghua staged oxygen process (NETL, 2013, Yang et al., 2011) ... 25
viii
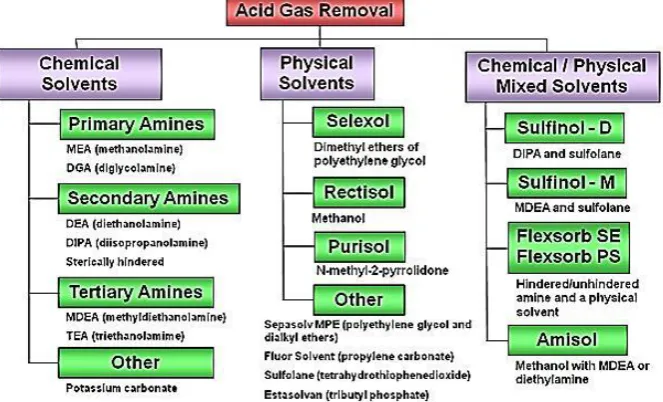
Figure 2.15 AGR technologies classification (NETL, 2013) ... 28
Figure 2.16 a)Tail gas treatment dedicated for H2S removal b) Tail gas treatment integrated with updtream AGR process ... 29
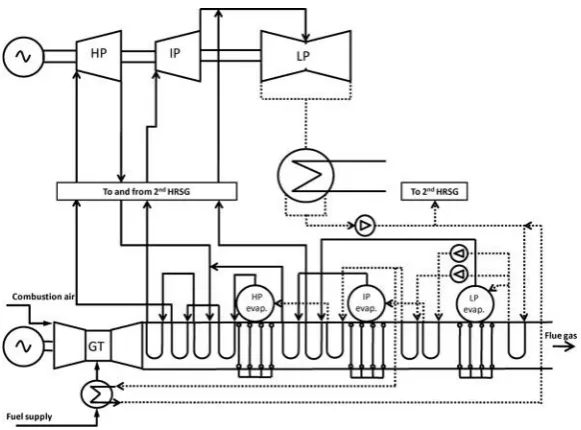
Figure 2.17 Schematics of combined cycle in IGCC process (IEA, 2011) ... 30
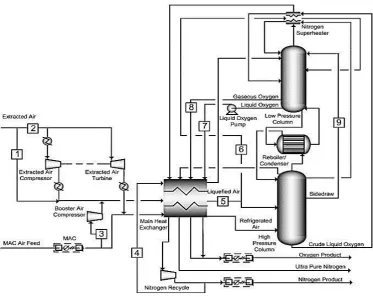
Figure 2.18 Schematics of typical air separation unit (Jones et al., 2011) ... 31
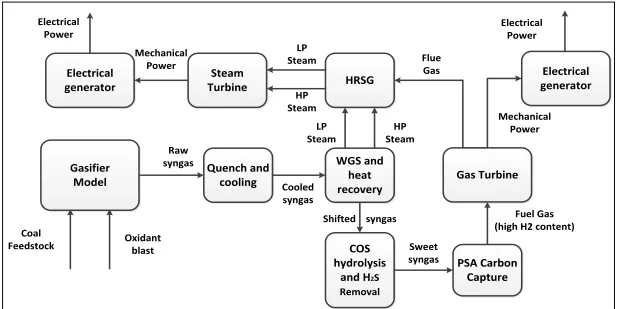
Figure 2.19 Schematics of IGCC process simulated in this thesis ... 32
Figure 3.1Structure of Texaco gasifier (Wang et al., 2015) ... 34
Figure 3.2 Energy balance for gasifier ... 43
Figure 3.3 Flow chart of Newton-Raphson method for syngas contents calculation ... 46
Figure 3.4 Syngas content change with H2O/coal ratio ... 50
Figure 3.5 Syngas content change with H2O/coal ratio ... 50
Figure 3.6 Syngas content change with oxygen/coal ratio unit ... 51
Figure 3.7 Syngas content change with oxygen/coal ratio unit ... 52
Figure 3.8 Syngas contents change with operation temperature ... 53
Figure 3.9 Syngas contents change with operation temperature ... 53
Figure 3.10 Syngas contents change with operation pressure ... 54
Figure 3.11 Syngas content change with operation pressure ... 54
ix
Figure 4.2 The “three zones” inside gasifier (Sun et al., 2011) ... 61
Figure 4.3 The Schematics of slag layer building process ... 69
Figure 4.4 Velocity field in x direction for film fluid with variable viscosity (Bird et al., 2001) ... 70
Figure 4.5 Flow chart of steady state model parameterization ... 80
Figure 4.6 Flow chart of the dynamic performance simulation ... 81
Figure 4.7 Whole process Schematics of Shell gasifer model ... 82
Figure 4.8 Dynamic change of raw syngas temperature with 1% and 5% oxygen input rise . 83 Figure 4.9 Dynamic change of liquid slag surface temperature with 1% and 5% oxygen input rise ... 83
Figure 4.10 Dynamic change of refractory wall temperature with 1% and 5% oxygen input rise ... 84
Figure 4.11 Dynamic change of liquid layer average temperature with 1% and 5% oxygen input rise ... 84
Figure 4.12 Dynamic change of solid layer average temperature with 1% and 5% oxygen input rise ... 85
Figure 4.13 Dynamic change of exit slag mass flow with 1% and 5% oxygen input rise ... 85
x
Figure 4.15 Dynamic change of solid slag layer thickness with 1% and 5% oxygen input rise
... 86
Figure 4.16 Dynamic change of CO concentration with 1% and 5% oxygen input rise ... 88
Figure 4.17 Dynamic change of H2 concentration with 1% and 5% oxygen input rise ... 88
Figure 4.18 Dynamic change of CGE 1% and 5% oxygen input rise ... 89
Figure 4.19 Dynamic change of CO2 concentration with 1% and 5% oxygen input rise ... 89
Figure 4.20 Dynamic changes of gas temperature with 20% steam / 1% Oxygen input rises 90 Figure 4.21 Dynamic changes of liquid layer surface temperature with 20% steam / 1% Oxygen input rises ... 91
Figure 4.22 Dynamic changes of refractory wall temperature with 20% steam/1% Oxygen input step rises ... 91
Figure 4.23 Dynamic changes of liquid slag average temperature with 20% steam/1% Oxygen input step rises ... 92
Figure 4.24 Dynamic changes of solid slag average temperature with 20% steam/1% Oxygen input step rises ... 92
Figure 4.25 Dynamic change of exit slag mass flow rate with 20% steam/1% Oxygen input step rises ... 93
xi
Figure 4.27 Dynamic change of solid slag layer thickness with 20% with 20%
steam/1%oxygen input step rises... 94
Figure 4.28 Dynamic change of CO concentration with 20% steam/1%oxygen input step rises ... 94
Figure 4.29 Dynamic change of H2 concentration with 20% steam/1%oxygen input step rises ... 95
Figure 4.30 Dynamic change of CO2 concentration with 20% steam/1%oxygen input step rises ... 95
Figure 4.31 Dynamic change of CGE with 20% steam/1%oxygen input step rises ... 96
Figure 5.1 Schematics of Thermolib chemical database ... 101
Figure 5.2 Temperature range for each substance in chemical database ... 102
Figure 5.3 Coefficients for the calculation of liquid phase density ... 103
Figure 5.4 Coefficients for the calculation of liquid phase specific heat capacity ... 104
Figure 5.5 Schematic of coefficients and temperature ranges for evaporation enthalpy calculation... 105
Figure 5.6 Flowchart of Shell gasifier with gas quench and syngas cooling system ... 111
Figure 5.7 Schematics of Shell gasifier with gas quench and syngas cooling system(Higman and van der Burgt, 2008d) ... 111
xii
Figure 5.9 Schematics for WGS with heat recovery block for Shell gasifier ... 122
Figure 5.10 Schematics for WGS with heat recovery block for Texaco gasifier ... 122
Figure 5.11 1st stage WGS shifted syngas temperature dynamic change ... 124
Figure 5.12 1st stage WGS shifted syngas CO2 concentration dynamic change ... 124
Figure 5.13 1st stage WGS shifted syngas H2 concentration dynamic change ... 125
Figure 5.14 2nd stage WGS shifted syngas temperature dynamic change... 125
Figure 5.15 2nd stage WGS shifted syngas CO2 concentration dynamic change ... 126
Figure 6.1 Schematics illustration of Brayton cycle ... 133
Figure 6.2 T-s and P-v diagrams of Brayton cycle (MAE115, 2012) ... 134
Figure 6.3 Actual Brayton cycle in T-s diagram by considering the irreversibility (MAE115, 2012) ... 137
Figure 6.4 Gas turbine model developed by Thermolib ... 141
Figure 6.5 Dynamic change of power in gas turbine ... 143
Figure 6.6 Schematics diagram of an ideal Rankine cycle ... 144
Figure 6.7 (a) Ideal Rankine cycle in T-s diagram (b) Actual Rankine cycle in T-s diagram (MAE115, 2012)... 145
Figure 6.8 Schematics of single stage HRSG model developed with Thermolib ... 149
xiii
Figure 6.10 Flue gas pathway in HRSG ... 150
Figure 6.11 LP steam generation in HRSG ... 151
Figure 6.12 HP steam generation ... 151
Figure 6.13 Schematics of dual-stage HRSG developed withThermolib... 153
Figure 6.14 Dynamic change of steam cycle power generations ... 165
Figure 6.15 Combined cycle Schematics ... 166
Figure 6.16 Combined cycle in T-s diagram.(Çengel and Boles, 2006) ... 166
Figure 7.1 Modified AC sample ... 169
Figure 7.2 Test rig built by UoB (Caldwell, 2015) ... 170
Figure 7.3 Experiment isotherms for unmodified AC for CO2 (black circles) and N2 (white circles) at 30 ℃ (a) and 45 ℃ (b) and the simulation results of isotherm models: Langmuir model (dashed), LF model (solid) and DSL model (dotted)(Caldwell et al., 2015) ... 176
Figure 7.4 Experiment isotherms for unmodified AC for CO2 (black circles) and N2 (white circles) at 30 ℃ (a) and 45 ℃ (b) and the simulation results of isotherm models: Langmuir model (dashed), LF model (solid) and DSL model (dotted) (Caldwell et al., 2015) ... 176
Figure 7.5 The Schematics of four step cycle of PSA process (Caldwell, 2015) ... 182
Figure 7.6 Process configuration for 8 beds 9 steps PSA process with two pressure equalisation and one recycled purge stream (Caldwell, 2015). ... 185
xiv
Figure A.2 Shell-tube boiler of UoW (Serth and Lestina, 2014) ... 205
Figure A.3 Power prodcution system Schematics of CHP in UoW ... 206
Figure A.4 Power prodcution system Schematics of CHP in UoW ... 207
Figure A.5Comparison of simulated electrical output without controller and operational data
in a summer working day ... 212
Figure A.6 Comparison of simulated gas flow with feedback control and operational data in a
summer working day ... 212
Figure A.7 Comparison of simulated electrical output withoutcontroller and operational data
in a winter working day ... 213
Figure A.8 Comparison of simulated gas flow with feedback controland operational data in a
winter working day ... 213
Figure A.9 Dynamic bahaviour of electricity generation with/without feedback controller 213
Figure A.10 Comparison of simulated thermal output without control and operational data in
a summer working day ... 214
Figure A.11 Comparison of simulated water flow rate with control and operational data in a
summer working day ... 215
Figure A.12 Comparison of simulated water flow rate without control and operational data in
a winter working day ... 215
Figure A.13 Comparison of simulated water flow rate with control and operational data in a
xv
Figure A.14 Dynamic bahaviour of heat exchanger thermal output ... 216
Figure A.15 Comparison of simulated boiler thermal power output without control and
operational data in winter working day ... 216
Figure A.16 Comparison of simulated boiler thermal power output with control and
operationa data in a spring working day... 217
Figure A.17 Comparison of simulated boiler output water temperaturewith and without
control in a winter working day ... 217
Figure A.18 Dynamic change of boiler themal power outputwith/without control ... 217
xvi
List of Tables
Table 2.1 Main Milestones of IGCC Technology Development ... 11
Table 2.2 Fluid bed gasification processes ... 19
Table 2.3 Entrained-flow gasification processes ... 23
Table 3.1 Model input with three types of coals ... 47
Table 3.2 Comparison of simulation results and Reference data ... 48
Table 3.3 Model input based on Lunan factory ... 49
Table 3.4 Dry Syngas Output Content Compare ... 49
Table 3.5 Shell gasifier Model Input ... 55
Table 3.6 Shell gasifier Model output with reference data ... 56
Table 4.1 Input parameters of dynamic Shell gasifier model ... 77
Table 4.2 Kick off data dynamic Shell gasifier model ... 78
Table 5.1 Parameters of raw syngas, recycled cold gas and quenched gas ... 113
Table 5.2 Model input using typical british coal ... 117
Table 5.3 Simulation results by using typical British coal ... 118
Table 5.4 Calculation for raw syngas and quenched syngas parameters ... 120
xvii
Table 5.6 Parameters of two stages WGS outlet syngas parameters of Texaco gasifier ... 127
Table 5.7 Parameters COS free syngas parameters of Shell and Texaco gasifier ... 129
Table 5.8 Parameters of sweet syngas parameters of Texaco gasifier ... 130
Table 6.1 Gas turbine model input ... 142
Table 6.2 GE 6B Gas turbine operation data comparing with refrence data ... 142
Table 6.3 Parameters of flue gas, exhaust gas to atmosphere and generated main steam ... 149
Table 6.4 Parameters of HP secondary super heater ... 154
Table 6.5 Parameters of LP tertiary super heater ... 155
Table 6.6 Parameters of HP primary super heater ... 156
Table 6.7 Parameters of LP secondary super heater ... 157
Table 6.8 Parameters of HP evaporator ... 158
Table 6.9 Parameters of HP HT economizer ... 159
Table 6.10 Parameters of LP Primary super heater ... 160
Table 6.11 Parameters of LP Evaporator ... 161
Table 6.12 Parameters of HP LT Economizer ... 162
xviii
Table 7.1 The breakthrough capacities of CO2/N2 mixtures separated using unmodified
activated carbon for each experimental run and the predicted capacity for pure components
based on the LF and DSL models... 177
Table 7.2 Breakthrough Predicted multicomponent adsorption capacities based on the
multicomponent LF and DSL models and the corresponding IAST models for CO2/N2
mixtures separated using unmodified activated carbon (Caldwell et al., 2015) ... 178
Table 7.3 Predicted selectivities of CO2/N2 mixture using unmodified AC based on
multicomponent LF and DSL models and the corresponding IAST models (Caldwell, 2015)
... 179
Table 7.4 The breakthrough capacities of CO2/N2 mixtures separated using modified
activated carbon for each experimental run and the predicted capacity for pure components
based on the LF and DSL models... 179
Table 7.5 Breakthrough Predicted multicomponent adsorption capacities based on the
multicomponent LF and DSL models and the corresponding IAST models for CO2/N2
mixtures separated using modified activated carbon (Caldwell, 2015) ... 180
Table 7.6 Predicted selectivities of CO2/N2 mixture using unmodified AC based on
multicomponent LF and DSL models and the corresponding IAST models (Caldwell, 2015)
... 181
Table 7.7 Capture rate and purities for CO2 and N2 using 4-step Skarstrom PSA
process(Caldwell, 2015) ... 183
xix
Table 7.9 Parameters of Texaco-based IGCC power plant under different carbon capture rates
... 187
Table A.1 Cummins 1370 GQMA CHP unit specification ... 203
Table A.2 Design characteristics of gas engine controller ... 210
Table A.3 Design characteristics of heat recovery subsystem controller ... 210
xx
List of Symbols and Abbreviations
List of symbols
A Carbon conversion rate -
p
A Parameters for enthalpy
calculation in NIST polynominals
-
s
A Interface area between
recirculation zone and wall
m2
lsl
A The surface area of liquid slag layer
m2
B Parameters for enthalpy calculation in NIST polynominals
-
C Parameters for enthalpy calculation in NIST polynominals
-
D Parameters for enthalpy calculation in NIST polynominals
-
E Parameters for enthalpy calculation in NIST polynominals
-
F Parameters for enthalpy calculation in NIST polynominals
xxi
G Parameters for enthalpy calculation in NIST polynominals
-
H Parameters for enthalpy calculation in NIST polynominals
-
A0 Parameters for specific enthalpy calculation in NASA polynominals
-
B0 Parameters for specific enthalpy calculation in NASA polynominals
-
C0 Parameters for specific enthalpy calculation in NASA polynominals
-
D0 Parameters for specific enthalpy calculation in NASA polynominals
-
E0 Parameters for specific enthalpy calculation in NASA polynominals
-
F0 Parameters for specific enthalpy calculation in NASA polynominals
-
G0 Parameters for specific enthalpy calculation in NASA polynominals
-
H0 Parameters for specific enthalpy calculation in NASA polynominals
xxii
A1 Parameters for liquid density calculation in NASA polynominals
-
B1 Parameters for liquid density calculation in NASA polynominals
-
C1 Parameters for liquid density calculation in NASA polynominals
-
D1 Parameters for liquid density calculation in NASA polynominals
-
A2 Parameters for liquid mole specific capacity in NASA polynominals
-
B2 Parameters for liquid mole specific capacity in NASA polynominals
-
C2 Parameters for liquid mole specific capacity in NASA polynominals
-
D2 Parameters for liquid mole specific capacity in NASA polynominals
-
A3 Parameters for liquid mole specific enthalpy in
NASA polynominals
-
B3 Parameters for liquid mole specific enthalpy in
NASA polynominals
xxiii
A4 Parameters for saturation pressure calculation in NASA polynominals
-
B4 Parameters for saturation pressure calculation in NASA polynominals
-
, ,
coal moisture O
D mass flow of oxygen
contained in the moisture content carried by coal on a dry ash-free basis
kJ s-1
,
steamblast O
D mass flow of oxygen
contained in the steam blast
kJ s-1
,
oxygenblast Ar
D mass flow of Argon
carried by the oxygen blast
kJ s-1
,
oxygenbalst N
D nitrogen mass flow carried by oxygen blast
kJ s-1
e base of the natural logarithm
-
g Gravitational acceleration m s-2
,
in coal
H Enthalpy flow carried by coal
kJ s-1
2 ,
in H O
H Enthalpy flow carried by 2
H O
kJ s-1
,
in Oxygenblast
H Enthalpy flow carried by oxygen blast
xxiv
,
out rawsynags
H Enthalpy flow carried out by raw syngas
kJ s-1
,
out flyash
H Enthalpy flow carried out by fly ash
kJ s-1
loss
H Heat loss rate kJ s-1
,
out slag
H Enthalpy flow carried out by slag
kJ s-1
steam
H Enthalpy flow carried out
by steam in membrane wall
kJ s-1
T
H standard enthalpy of gas in temperature T
kJ/kmol
,uncarbon
out
H Enthalpy flow carried out by unreacted carbon
kJ s-1
298.15
H standard enthalpy of gas
using standard
temperature 298.15K and pressure 1.01e5 Pa
kJ/kmol
i
HHV Higher heating value of syngas content i
kJ
carbon
HHV Higher heating value of carbon
kJ
coalfeed
HHV Higher heating value of coal feed
kJ
,
raw synags
xxv raw syngas
l
h Enthalpy flow carried by liquid slag layer
kJ kg-1 s-1
ℎ𝑙 The average enthalpy carried by liquid phase slag
kJ kg-1 s-1
m
h The mole enthalpy of
ideal gas
kJ mol-1
mixgas
h Mass specific enthalpy
of mixed gas
kJ kg-1
raw
h Mass specific enthalpy
of raw syngas
kJ kg-1
cold
h Mass specific enthalpy
of raw syngas
kJ kg-1
ssl
h The average enthalpy
carried by solid phase slag
kJ kg-1 s-1
M Number of transfer unit -
( r)
M A Molecular mass of argon -
( )
M C Molecular mass of carbon -
2
( )
M H molecular mass of
hydrogen
-
2
( )
M N molecular mass of
nitrogen
xxvi ( )
M S molecular mass of Sulphur -
2
( )
M O molecular mass of oxygen -
,
ash in
m Liquid ash droplet input
mass flow rate
kg s-1
l
m Mass of liquid slag layer kg
,
lsl out
m Exiting mass flow rate of liquid slag layer
kg s-1
mixgas
m Mass flow rate of mixed syngas
kg s-1
raw
m Mass flow rate of raw
syngas
kg s-1
cold
m Mass flow rate of cold
recirculated syngas
kg s-1
slag
m Mass flow rate of exiting slag
kg s-1
,
ssl m
m Melting flow rate from solid slag layer
kg s-1
flyash
m mass flow rate of fly ash kg s-1
uncarbon
m mass flow rate of
unreacted carbon
kg s-1
,0
C
N equivalent input carbon content mole flow rate
xxvii 2,0
H
N equivalent input hydrogen mole flow
kmol s-1
g
N raw syngas mole flow rate kmol s-1
2,0
O
N equivalent input nitrogen content mole flow rate
kmol s-1
2,0
N
N equivalent input nitrogen content mole flow rate
kmol s-1
,0
S
N equivalent input sulphur mole flow
kmol s-1
i
n mole flow rate of syngas content i
kmol s-1
,
in Ar
n input argon mole flow kmol s-1
2 ,
in N
n input nitrogen mole flow kmol s-1
2 ,
in O
n input oxygen mole flow kmol s-1
P Gasification pressure kPa
ref
P Reference pressure kPa
Q Actual heat transfer rate of
two flows
kW
max
Q Possible maximum heat
flux between two flows
xxviii conv
Q Convective heat transfer kW
.
g lsl
Q Heat flux for gasification zone to liquid slag layer
kW
rad
Q Radiant heat transfer kW
,
g lsl
q Heat flux from gas
volume to liquid slag layer kW
,
ssl w
q Heat flux from solid slag layer to refractory wall
kW
,
w tube
q Heat flux from refractory wall to metal tube
kW
R Universal ideal gas constant
-
m
s Mole entropy J mol-1 K-1
,
m NASA
s Mole entropy parameter
calculated by NASA polynominals
T Temperature K
g
T gasification temperature K
,
in Oxygenblast
T oxygen blast temperature K
,0
lsl
T Liquid phase slag surface
temperature
xxix lsl
T Liquid slag layer surface temperature
K
𝑇𝑙𝑠𝑙 Average temperature of liquid slag
K
ssl
T Average temperature of
solid slag layer
K
m
T Ash melting temperature K
tube
T Temperature of metal tube
w
T Refractory wall
temperature
K
w
T Average temperature of
refractory wall
K
U Overall heat transfer coefficient
W m-2 K
V Gas total volume m3
m
V Mole volume of gas
properties
m3 mol-1
Z
V velocity of the liquid slag flow along z axis
m s-2
z
V Average velocity of the
liquid layer
m s-2
v mean velocity of the gas in recirculation zone
xxx
CO
X mol concentration of CO -
2
CO
X mol concentration of CO2 -
4
CH
X mol concentration of CH4 -
COS
X mol concentration of COS -
2
H O
X mol concentration of H2O -
2
N
X mol concentration of N2
2
SO
X mol concentration of SO2 -
C
Y carbon mass concentration in the dry coal on a ash-free basis
-
H
Y hydrogen mass content in the dry coal on a ash-free basis
-
N
Y nitrogen mass content in
the dry coal on a ash-free basis
-
S
Y sulphur mass content in
the dry coal on a ash-free basis
O
Y oxygen mass content in
coal on a dry ash-free basis
xxxi em
Z Empirical parameter for coal ash melting
temperature calculation -
2
O
Z oxygen purity -
Greek sympols
parameter to describe how fast the viscosity increases as x increase
-
𝜎 Stefan-Boltzman constant kW m-2 K-4
Thickness of film layer m
lsl
Thickness the liquid slag layer
m
ssl
Thickness the solid slag layer
m
Effectiveness of NTU heat exchanger
-
𝜀𝑠 Emissivity of slag layer -
𝛾𝑔 convective heat transfer coefficient
kW m-2 K-1
c
Liquid density at critical temperature
kg m-3
,
f sat
xxxii
𝜌𝑔 gas density kg m-3
ssl
solid slag density kg m-3
µ viscosity kPas
0
viscosity in liquid slag layer surface
𝜀𝑠 Emissivity -
𝛾𝑔 convective heat transfer
coefficient
kWm-2K-1
𝜅 thermal conductivity of raw syngas
kW m-1 K-1
Parameter for evaporation calculation
-
Parameter used for liquid density calculation
-
xz
viscous momentum flux
on flat xz
Pa
angle between x axis and vertical direction
grad
m
Melting slag mass flow
rate per unit square
kg s-1 m-2
m
h
xxxiii
max
T
Maximum temperature
difference of two flows
K
Dimensionless groups
𝑅𝑒 Renolds
-Nu Nusselt number -
xxxiv
List of Abbreviations
ACs Activated carbons
AGR Acid Gas Removal unit
ASU Air Separation Unit
BLT Biggest Log Modulus tuning
CC Carbon Capture
CGE Cold Gas Efficiency
DSL Dual site Langmuir-Freundlich
FAD Fundamental angle difference
GEM Gasification-Enabled Module
HP High Pressure
HRSG Heat Recovery Steam Generator
IASL Ideal Adsorbed Solution Theory
LF Langmuir-Freundlich
IGCC Integrated Gasification Combined Cycle
LP Low Pressure
MP Medium Pressure
xxxv MAE Mean Absolute Error
PSA Pressure Swing Adsorption
SISO Single Input and Single Output
SSE Sum of Squared relative Errors
SCGP Shell Coal Gasification Process
UoB University of Birmingham
UoN University of Nottingham
UoW University of Warwick
xxxvi
Acknowledgements
First and foremost, I would like to express gratitude to my supervisor, Professor Jihong Wang.
As a meticulous scholar, her persistence attitude and inspiring ideas continuously guide me in
the research life. The project aims can’t be achieved without her support and advices on the
modelling equation derivation and documents revision. I will benefit with the knowledge and
spirit learnt from her in my following career.
Secondly, I would also like to give thanks to my parents and my wife Lily. My families’
support is the great drive during my Ph.D. study. They are always there when I need support
thus I can dedicate myself to the work. My families’ love and patience will always be the
power sauce to crack any obstacle in my life.
Thirdly, I would like to thank colleagues and friends, Shen Guo, Hao Liu, Hao Sun, Xing
Luo, Zhiwei Yang, Jacek Wojcik , Chirstopher Krupke, Mark Dooner and Simon Caldewell. I
learnt a lot form them. I will always remember the time we spend together and cherish this
period as the most beautiful memory.
In addition, I would also like to give my thanks to Dr. Zacharie Tamainot-Telto and Prof.
Hao Liu for spending time to read my thesis. I would like to give special thanks to Prof. Hao
Liu and Prof. Junfu Lv, the books and papers they provided help me learn the fundamental
knowledge of gasification and carbon capture.
Finally, I would like to thank EPSRC and CSC council for providing the financial support to
xxxvii
Declaration
This thesis is submitted in partial fulfilment for the degree of Doctor of Philosophy under the
regulations set out by the Graduate School at the University of Warwick. This thesis is solely
composed of research completed by Yue Wang, except where stated, under the supervision of
Professor Jihong Wang between the dates of June 2011 and September 2015. No part of this
work has been previously submitted to any other institution for a higher degree.
Yue Wang
xxxviii
Abstract
Integrated Gasification Combined Cycle (IGCC) is considered as a viable option for low
emission power generation and carbon-dioxide sequestration. Modelling development and
simulation study is essential part for the process of IGCC design and development. This PhD
project is aiming to conduct the modelling and simulation study of IGCC power plant by
building sub-modules such as gasifier, water gas shift reactor, acid gas removal unit, gas
turbine and HRSG, etc. and connecting these modules together for the whole process study.
In addition, the impact for the integration of IGCC with activated carbons-based pressure
swing adsorption carbon capture process is investigated by using a PSA model developed and
validated by University of Birmingham.
A simplified zero dimension gasification model is developed based on Texaco gasifier and
validated by reference and industry data. The model development is based on mass balance,
chemical equilibrium and energy balance. The prediction results for syngas contents
concentrations are proved to be reasonably acceptable and the syngas contents changes with
key input parameters changes are studied. The model is then used to generate a variable
syngas stream to study the dynamic performance of the other sub-modules.
A one dimension dynamic model based on Shell slagging gasifier is developed. The model
can successfully show the characteristics of slag layers formation and the syngas stream
change with response to input parameters change. By using step rise of oxygen input and
steam blast input, the dynamic performance of syngas temperature, syngas contents, slag
mass flow rate and slag layers thickness is analysed and compared. It is found that oxygen
input show relative larger impact on gasifier operation than steam blast for the studied
xxxix
Auxiliary modules in a gasification enabled plant and combined cycle power plant are
modelled with Thermolib Software. Basic principles of this software are introduced.
Simplified quench process, WGS with heat recovery, acid gas removal unit, gas turbine,
HRSG and electrical generator are modelled by using the blocks from Thermolib. The
simulation results show the dynamic changes of key output variables such as power output,
syngas temperature and contents concentrations.
PSA model developed by UoB based on ACs is introduced and a 9 step 8 beds cycle model is
used for the integration with IGCC model. This PSA model can achieve 80.89% CO2 capture
rate with 87.33% of N2 recovery rate without any additional equipment. N2 is used to
represent H2 for the simulation. Four cases for IGCC integrated with carbon capture are
studied for the energy penalty analysis. It is predicted that the efficiency loss for IGCC power
plant with 80.89% carbon capture will be 10.96%. The limitations of using N2 to represent H2
for the PSA model are discussed and it is predicted the real efficiency loss will be lower than
1
Chapter 1
Introduction
This chapter introduces the background of the research project first. It explains the
motivations for the research work. Secondly, study aims and methodology to conduct the
work is explained. Then the outlines of this thesis is given, which gives a brief introduction of
each chapter. Finally, the publications during the study are listed.
1.1 Background
In the next decades, fossil fuel will continue to be the main energy in power and industry
sectors worldwide, the CO2 emission caused by fossil fuel combustion now becomes a global
issue. Carbon capture and storage (CCS) technology is an attractive greenhouse mitigation
strategy, which can be integrated with conventional power generation stations. Although
demonstration projects have shown the viability of CCS integration with small scale coal and
gas fired power plants (Rubin et al., 2007), the reduction in power plant efficiency, capital
cost of construction and system operation complexity are still the main barriers for the
deployment of CCS.
Integrated gasification combined cycle (IGCC) offers the benefits over conventional coal
fired power plants, especially with regard to the environment and feedstock flexibility (Yue et
al., 2013). The gasification of solid fuels such as coal and biomass can not only generate
much less hazardous gas and inhalable particles than traditional power plants, but also offer
its advantages in the integration with carbon capture and storage units. Since the synthesis
gas produced by coal gasification is primarily formed by hydrogen and carbon monoxide, the
water shift reaction of synthesis gas with steam can easily covert the carbon monoxide to
carbon dioxide and generate additional hydrogen, which offers ideal environment for
2
swing adsorption (PSA), with easy operation procedure and low economic cost, is an
attractive technology for the pre-combustion capture in IGCC power plant (Bell et al., 2010).
Meanwhile, activated carbons (ACs) based adsorbents have gained interests and are proved to
be suitable for pre-combustion carbon capture, some of these large microporous materials
show high selectivity of CO2 over other gases hence they are ideal for the utilisation in pressure
swing adsorption process (Caldwell et al., 2015, Drage et al., 2009).
In order to investigate the operation of IGCC with PSA carbon capture based on activated
carbon adsorbents, the University of Nottingham (UoN), the Unviesity of Warwick, the
University of Birmingham (UoB), the University college of London (UCL), Tsinghua
University (THU) and the Chinese Academy of Sciences (CAS) set up a collaborative
research project with the funding support from the Engineering and Physical Sciences
Research Council (project number: EP/I010955/1). The role of Warwick in the project is to
conduct the modelling and simulation study of IGCC and explore the impact of its integration
with ACs based PSA unit. The work presented in this thesis focuses on the development of
IGCC model and the efficiency loss caused by PSA carbon capture process is discussed as
well.
1.2 Study Aims and Methodology
The work conducted by the University of Warwick is to develop the whole IGCC plant model
and perform simulation study to IGCC power plant dynamic responses and the impact of
integration with a carbon capture process. This work starts with the mathematical modelling
of the essential sub-modules in an IGCC power plant, which is formed by the gasification -
enabled module (GEM) and combined cycle power generation block. The performance of an
IGCC power plant without carbon capture is studied to understand the operation of the sub
3
process. The results of the PSA model developed by UoB are then used to investigate its
impact to the IGCC power plant, especially the efficiency loss caused by the reduction of
hydrogen in syngas, the subsequent performance of gas turbine and heat recovery steam
generator blocks (HRSG) are studied.
The modelling work of the IGCC process starts from the GEM plant model development. The
GEM module includes the gasifier with quench block, shift reactor with heat recovery block,
COS hydrolysis block and H2S removal block. Two types of gasifiers (Texaco gasifier with
water quench and Shell gasifier with gas quench) are modelled based on mass balance and
energy balance equations. The lumped gasifier model can predict the syngas contents and
other properties when given the parameters of feedstock inputs and oxidants. The syngas
stream generated by the gasifier block will then pass the shift reactor with heat recovery and
sulphur removal blocks developed with Simulink based toolbox-Thermolib. The equation
based toolbox provides variable blocks which are viable for thermodynamic system
modelling and simulation. Moreover, the syngas contents simulation benefits from the
powerful chemical media database of Thermolib, which makes it possible to simulate the
reactions and thermodynamic processes. The performance of each block are analysed, the
property changes of syngas stream such as temperature, pressure, enthalpy and syngas
contents concentrations are tracked and studied. The modules in gasification enabled module
(GEM) plant are developed and validated based on published references and internal research
report (M.Karmarkar, 2005).
The fuel gas stream is then transported to the power generation block which is formed by gas
turbine, HRSG and electricity generators. The gas tubine (GT), heat recovery steam generator
4
configuration and parameterization of each module are based on published references and
internal research report as well.
The final stage of this project work is to investigate the impact of PSA unit to IGCC power
plant. After integrating the PSA unit model with the power plant model, it is viable to analyse
the energy conversion efficiency of the IGCC power plant. In addition, the fuel gas changed
caused by the PSA unit under different carbon capture rates will also influence the operation
of power block, which leads to power efficiency changes.
1.3 Thesis Outlines
There are eight chapters in this thesis. Chapter 1 introduces the background of project and
outlines the study aims and methodology. Meanwhile, the publications during the period of
the Ph.D. study are listed in the next section.
Chapter 2 provides a detailed description of an IGCC power plant. The history of gasification
technologies and the widely used commercial gasification technologies are outlined and
compared. The working principles of shift reactor, sulphur removal unit and combined cycle
power plant are depicted in this chapter as well. This chapter is aiming to reveal the whole
picture of the IGCC power plant and the blueprint of the IGCC model developed in this work.
Chapter 3 presents the development of a zero-dimension Texaco gasifier model. This model
is capable of predicting the syngas composition with the given feed stock and oxidant
parameters. The detailed derivation of mass balance and energy balance equations are
outlined. The model is then validated by comparing the simulation results of different types
of coal under pre-defined working conditions. The comparison of simulation results with data
5
give accurate prediction of syngas stream. Meanwhile, the impact of the key parameter
changes such as coal slurry concentration, oxygen/coal ratio and working pressure are
studied. To show the model flexibility, it is also used for the steady state simulation of Shell
gasifier in the end of this chapter.
Chapter 4 focuses on the development of a dynamic model of Shell-slagging gasifier. Shell
gasifier is selected because its unique slagging characteristic offers conservation of energy
and mass. The detailed derivation of mass balance and energy balance equations are mainly
presented in this chapter, the dynamic performance of Shell gasifier (slag layers thickness,
syngas output contents concentrations, temperature files of syngas, slag layers and refractory
wall and cold gas efficiency) with step changes of oxygen and steam inputs are studied as
well.
Chapter 5 presents the background knowledge of Thermolib toolbox first; the gas phase and
liquid phase calculation equations are detailed. The theories used in Thermolib for stream
state calculation are the main focus in this part. Since the auxiliary modules of the
gasification enabled module plant (GEM) are developed based on Thermolib, it is necessary
to introduce the theory to explain the basic working principles of Thermolib blocks. The
second part of the chapter introduces the modules of water quench for Texaco gasifier, gas
quench and heat recovery for Shell gasifier, shift reactor with heat recovery for both Texaco
and Shell gasifiers. The heat exchanger which utilises heat released by the endothermic water
gas shift reaction is modelled to study the process of generating low pressure (LP) and high
pressure (HP) steam for the HRSG module in power generation section. The shifted syngas is
then treated by COS hydrolysis reactor and a simplified H2S removal unit, the sulphur
6
Chapter 6 starts from outline of the development of power generation plant, which is formed
by gas turbine, HRSG and electricity generator. The gas turbine module is developed based
on Brayton cycle while the single stage HRSG is developed based on Rankine cycle. In order
to study the integration of shift reactor with power generation plant, a two stage HRSG is
developed and validated based on an internal research report (M.Karmarkar, 2005). The
dynamic performance of the combined cycle based on Texaco gasifier is studied.
In order to study the impact of ACs-based PSA unit to the IGCC power plant, the experiment
and simulation work conducted by the University of Birmingham is introduced in Chapter 7.
The work starts from the pure isotherm tests for two ACs samples (unmodified AC and
modified AC). N2 is used to represent H2 in this part. Several isotherm models are built and
compared for the adsorption capacity prediction, which aims to provide a viable model to
predict the cyclic outputs of the PSA process. The multicomponent DSL model is found to
give the best prediction results for CO2/N2 mixture adsorption; it is then used as the basic unit
for PSA cyclic model. Finally the 9 steps 8 beds PSA model simulation results provide
relative high purity and capture rate for both of CO2 and N2. The results are used to build a
model which is then connected with the IGCC power plant model; the efficiency losses on
different CO2 capture rate are then simulated. At the end of Chapter 7, the potential of using
CO2/H2 for the PSA process is discussed based on the experiment data provided by the
University of Nottingham; it is concluded that the CO2/N2 predicts a worse separation than
CO2/H2 separation, which indicates that the actual efficiency losses for CO2/H2 separation
should be lower.
Chapter 8 provides the main conclusions and limitations of the project work. The potential
7
Appendix A detailed a research project based on the combined cycle power (CHP) plant
elaborated on the campus of the University of Warwick. The model is developed with
Thermolib and Simulink and simplified controllers are applied. The CHP model simulation
results for different seasons are compared with the operation data collected from the
University of Warwick and the dynamic performance of the CHP power plant is analysed.
1.4 Publications
Journal papers:
Y, Wang, A, Bermukhambetova,J. Wang, M. Dooner, J. Lv, Q. Gao, Modelling of the
Whole Process of a University Campus CHP Power Plant and Dynamic Performance
Study, accepted by International Journal of Automation and Computing.
The contents of this paper are presented in chapter 6.
Y. Wang, J. Wang, X, Luo., S, Guo., J. Lv, Q. Gao., Dynamic modelling and
simulation of IGCC process with Texaco gasifier using different coal, System Science
and Control Engineering, Vol.3, pp198-210, 2015.
Part of the contents of this paper is presented in chapter 3 and 5.
Conference papers:
Y. Wang, J. Wang, A. Bermukhambetova, S. Guo, J. Lv, Q. Gao ,Dynamic
simulation of combined heat and power system in University of Warwick,
8
of Texaco Gasifier in an IGCC Process, International Conference on Automation &
Computing, London UK, Sep 2013.
Z. Sun, Y. Dai, H. Liu, Y. Wang, J. Wang, Dynamic performance of a dual-pressure
waste heat recovery system under partial load operation, International Conference on
Automation & Computing, Loughborough University, UK, Sep 2012.
Oral presentations:
J. Wang, J. Wood, S. Caldwell and Y. Wang, 2011. Modelling of Pre-Combustion
Carbon Dioxide Capture and Power Plant Cycle at IGCC Power Stations. Oral
Presentation at the Mathematical Modelling and Simulation of Power Plants and CO2
Capture Workshop, Warwick, UK, 20-21 March 2012.
Y. Wang, S. Caldwell, J. Wang, J. Wood, S. Guo, Dynamic simulation study on
IGCC process with novel activated carbon based pre-combustion carbon capture,
presentation in 10th European Conference on Coal Research and its Applications,
Hull, UK, Sep 2014.
Poster competitions:
Y. Wang, J. Wang, Modelling and Simulation Study of an IGCC Power Plant with
Carbon Capture Processes, poster competition in IET Engineering Prize Award
Evening(in association with industry, Mar 2014).
Y. Wang, J. Wang, IGCC+CCS: An Odyssey to Clean Coal and Low Carbon Power
Generation, The Midlands Energy Graduate School Annual Conference, System
9
Chapter 2
Introduction of IGCC Power Plant and Overview of the Major
Sub-Systems
This chapter gives an introduction of IGCC process and an overview of IGCC technology
development. A detailed description to the IGCC sub-systems is presented including: gasifier,
water quench, air separation unit, water gas shift reactor, Sulphur removal, gas turbine and
heat recovery generator. The potential benefits of IGCC process combined with
pre-combustion carbon capture process is discussed, physical-adsorbents and activated
carbon-based pressure swing adsorption process are described as the technologies can be
incorporated with IGCC for CO2 abatement.
2.1 Overview of the IGCC Technology Development
The conversion from solid fuel such as coal, biomass to gas fuel has contributed to human
civilization development from ancient time. Although the production and utilization of coal
and biomass can trace back to Stone Age, gasification didn’t achieve industrial operation until
the foundation of the London Gas, Light and Coke Company in 1812 (Higman and van der
Burgt, 2003). Gasification technology was only developed to generate town gas, blast furnace
gas and producer gas in the early stage (1900s to 1920s) due to the limitation of oxidant
production technology (Higman and van der Burgt, 2008a). In the late 1920s to 1940s, the
commercialization of cryogenic air separation technology which is developed by Carl Linde
(Higman and van der Burgt, 2008a) finally achieved continuous supply of oxygen as oxidant,
this revolutionary progress makes it available for the production of synthesis gas rich in
hydrogen and carbon monoxide. The well-known Lurgi moving bed pressurized gasification
technology and Koppers-Totzek entrained-flow process emerged during this period. During
the following 40 years, gasification technologies were mainly used in the ammonia industry
10
coal gasification for power generation and offers an alternative to the shortage of petrol
supply (Higman and van der Burgt, 2008a). Using syngas for power generation starts from
the idea of injecting it to gas turbines during 1950s to 1960s (Zhang et al., 2013). The
development of gas turbine technology, especially the largely rise of tolerance for the gas
turbine inlet temperature, made this application into reality. Hence, the conceptual technology
known as Integrated Gasification Combined Cycle (IGCC) was proposed, theoretically tested
and verified in 1970s. It is considered as a promising process which can efficiently synthesis
fuel gas from coal or biomass for power generation with low emission. The first generation of
demonstration IGCC power plants includes Cool Water, Plaquemine (USA, 1987), Lünen
(Germany, 1972). During 1990s, more commercial scale IGCC power plants with larger
capacity were built and considerable experiences in construction, operation and
commercialization were gained and researched at this stage, hence it is also known as
“lessons learned” period. The main milestones in the IGCC development history are listed in
Table 2.1. Since beginning of this millennium, global warming and extreme weather caused
by greenhouse gases such as carbon dioxide and methane started to attract more and more
interests on IGCC technology. As considered as a “capture ready” technology for CO2
abatement, IGCC regained governments and researchers interests for its availability for CO2
sequestration as well as low pollutants emission. A large number of IGCC projects were
announced and constructed worldwide, especially in countries with rich coal reserves such as
China, India and Malaysia (Higman and van der Burgt, 2008a). Although some uncertainty
comes along with IGCC, the interests in this technology will continue and grow for some
11
Table 2.1 Main Milestones of IGCC Technology Development
Time Milestones
1812 Foundation of London Gas, Light and Coke Company. Gasification firstly used as a commercial process to generate town gas for lighting and cooking. (Higman and van der Burgt, 2003)
1887 Lurgi GmbH of Germany was granted the first major patent in gasification process.(Miller, 2005)
1895 William Hampson and Carl von Linde independently filed for patent of the cryogenic cycle used in the air liquefaction process. Continuous oxidant supply for gasification became possible.(Higman and van der Burgt, 2008a)
1950 Gumz propose the idea of injecting synthesis gas to gas turbine as fuel to generate electricity.(Higman and van der Burgt, 2008a)
1970s U.S government started to sponsor studies to test the idea of using syngas as fuel for gas turbines. The syngas was produced by coal gasification process. (Higman and van der Burgt, 2003)
1980s Cool Water Project (96MW) was launched in 1984 as part of DOE’s clean coal technology program. Texaco gasifier derived from Texaco heavy oil gasification technology was used for syngas synthesis while a GE-7E gas turbine was selected in the combined cycle. (NETL, 2013)
1994 The first commercialized IGCC power plant in the world, Netherlands Buggenum Power Plant (253MW) began service. A Single dry coal feed Shell gasifier SCGP unit was used in this project. (Miller, 2005)
1996 Polk Tampa Power station (250MW) achieved operation. This station firstly integrated ASU and gas turbine by injecting nitrogen generated from ASU to gas turbine for the aim of NOx control.(NETL, 2013)
1998 One of the largest commercial IGCC projects started operation in Puertollano, Spain with net capacity of 330MW. (Higman and van der Burgt, 2008a)
12
2.2 Description of An IGCC Process
2.2.1 Introduction of the whole process
IGCC is a complicated system consists of several sub-systems, which make its construction
and operation more difficult than the traditional pulverized coal power plants. Figure 2.1
shows a Schematic of an IGCC power plant using coal slurry-feed Texaco gasifier with water
quench. Pure oxygen generated by ASU is used as the oxidant for the gasification process. In
this process, coal is pulverized into particles with diameter of less than 0.1mm (Siva
Ariyapadi, 2008) by coal handling and preparation system. Then the pulverized coal is mixed
with water to form coal water slurry and then injected into the gasifier and react with oxygen.
The high temperature (1250~1600℃), and high pressure (over 40 bar) reaction environment
can easily generate synthesis gas rich in hydrogen and carbon monoxide with high sensible
heat, meanwhile the ash contents in the coal will form liquid phase slag of low viscosity and
be removed from the gasifier (Higman and van der Burgt, 2008d).
The synthesis gas is firstly cooled in the quench water and releases part of the sensible heat.
After cooling process, the raw syngas will pass the water gas shift reactor. The
catalyst-supported water gas shift reaction will convert the carbon monoxide contents in the syngas
into hydrogen and carbon dioxide, which enhances the syngas heat value and the partial
pressure of carbon dioxide. The high carbon dioxide content condition is favoured by the
pressure-swing adsorption of CO2 in the carbon capture unit.
The other impurities in the syngas such as particles sulphur and mercury will be further
removed in the syngas clean-up process. The sweet syngas will then be further compressed
and heated and injected into the gas turbine, the combustion of syngas in the combustion
13
generated by ASU will be used as diluents for the fuel gas combustion to control NOx
emission (Wang et al., 2015) since the mixing of nitrogen and syngas can decrease the
combustion chamber temperature. The degree of ASU and gas turbine integration is often
discussed in this process. 100% of integration means that there is no independent compressor
in the ASU and all of the air input to ASU is compressed by gas turbine compressors. The
higher degree of integration will result in electrical efficiency and less construction cost.
However, independent ASU will improve the maximum power output and improve the
flexibility by shortening the start-up time and avoiding the shock combustion in the gas
turbine. (Xu et al., 2012).
The flue gas exiting the gas turbine will be directed to heat recovery steam generator; the
sensible heat in the flue gas will be recovered to generate steam to drive steam turbine and
electrical generator for additional electricity generation. Hence the net efficiency is improved
by the combined cycle, which makes IGCC economically competitive with traditional PC
power plants. The submodules modelled in this thesis include gasifier with quench, shift
reactor with heat recovery, sulphur removal unit, gas turbine, heat recovery steam generator,
electrical generator and carbon capture unit.
14
2.2.2 Introduction of Gasifier
Among all the sub-systems of an IGCC process, the most important and complicated one
is the gasifier, where complicated partial oxidation reactions will ha ppen and convert
coal to raw synthesis gas. Oxygen and steam are used as oxidant in this process. For
example, the basic working process of a typical Texaco gasifier is: coal feed is injected
into the gasifier through nozzles. The high temperature and high pressure within the
furnace will make the moisture content evaporate rapidly and the pulverized coal
particles will devolatilize and yield coal tar, gaseous hydrocarbons and oil. The gaseous
components and volatiles will consume rapidly with steam and oxygen. The burning
carbon char will react with oxygen, carbon dioxide, hydrogen while the reaction products
will react with each other as well. The raw syngas generated by the gasifier is rich in H2
and CO and also includes CO2, CH4, N2, H2O, particle and some sulphide such as COS,
H2S and SO2. The wet syngas leaves the gasification zone with liquid slag and enters
water quench zone where the slag will be cooled and deposited, then removed from the
lock hopper (Higman and van der Burgt, 2003).
A number of different gasification technologies have been developed in the past 100
years (Higman and van der Burgt, 2003). Nowadays, over 90% (Higman and van der
Burgt, 2003) of commercialised gasifiers running in the world are either directly
provided or derived from four major commercial gasifier manufacture companies:
Sasol-Lurgi Company, GE (originally developed by Texaco company), Shell Company and
ConnocoPhillips E-gas (originally developed by Dow). The most widely accepted
classification of gasifiers is based on the fluid regime of the coal feed inside. The classic
15
(Rao and Rubin, 2002). Although all of the three types of gasifiers have their own pros
and cons, they can all be utilized in IGCC power plants (Rao and Rubin, 2002).
Currently, the most widely used technology in commercialized IGCC power plants is the
entrained-flow gasifier. Some typical gasifier of these three technologies will be
introduced and compared below:
2.2.2.1 Moving Bed Gasifier
Moving bed gasifier which is also known as fixed bed gasifier is the oldest gasification
technology among the three types. Since 1882 the first Lurgi gasifier was launched in
Germany (Higman and van der Burgt, 2003), this technology has been developed and
improved continuously. A moving bed gasifier uses lump coal as raw material, which are
located in a moving bed from the top of the refractory-lined vessel. The bed moves
downward slowly and reacts with a blast of air or oxygen contents coming from the
bottom of the gasifier vessel. This counter-flow arrangement leaves the coal
continuously react with oxygen and the resident time for coal in the gasifier can be as
long as 1 hour (Higman and van der Burgt, 2003). The gasification process in this type
of gasifier is under moderate pressure (25~30bar) and temperature of 1250℃(Higman
and van der Burgt, 2003). The synthesis gas temperature is generally low when the blast
flow is wet air. This is caused by the high nitrogen content (over 50%) in the syngas.
The Schematics of moving bed gasification process and temperature file from top to
16
Figure 2.2 Simplified Schematics diagram and temerature filed in a moving bed gasifier (Higman and van der Burgt, 2008d)
One of the most widely used moving bed gasification technologies is the Sasol -Lurgi dry
bottom process (Figure 2.3). The gasifier vessel is built with double refractory wall. The
boiling water filling between these two walls can provide intensive cooling for the
furnace while generating moderate pressure steam. From the top to the bottom, the gasifier can be geometrically divided into four zones: “dry zone”, “decarbonisation
zone”, “gasification zone” and “combustion zone”. The coal feed from the top lock
hopper will be distributed by the mechanic coal distributor; it will be heated and dried in the “drying zone” near the top area while cooling the upward moving syngas flow. Then
the coal will be further heated and devitalized in the “decarbonisation zone” by the hot
blast of syngas flow. In the “gasification zone”, the devitalized coal will react with
upstream of oxygen, CO2 and steam and generate raw syngas. In the “combustion zone”
where temperature reaches highest point, remaining char and residual oil will react with
oxygen and burn. It needs to be emphasized that the “four zones” division is not strictly
pure, the transition between these zones are gradual (Higman and van der Burgt, 2008d).
A rotating grate is installed at the bottom of the gasifier to remove the ash from