University of Warwick institutional repository:http://go.warwick.ac.uk/wrap
A Thesis Submitted for the Degree of PhD at the University of Warwick
http://go.warwick.ac.uk/wrap/74256
This thesis is made available online and is protected by original copyright. Please scroll down to view the document itself.
Regulation of Endoplasmic Reticulum Stress in
Adipose Tissue Metabolism
By
Philip Demos Voyias, BSc Hons
A thesis submitted in partial fulfilment of the requirements for the degree of
Doctor of Philosophy in Medical Sciences
Division of Translational and Systems Medicine, Warwick Medical School,
University of Warwick
Table of Contents
Abbreviations ... 8
List of tables ... 15
List of figures ... 15
Acknowledgements ... 18
Declaration ... 20
List of publications ... 21
Abstract ... 22
Chapter 1: Introduction ... 23
Introduction ... 24
1.1 Type II diabetes mellitus ... 25
1.1.1 Definition of diabetes mellitus ... 25
1.1.2 Clinical sequelae of type II diabetes mellitus ... 25
1.1.3 Epidemiology of type II diabetes mellitus ... 26
1.1.4 Obesity and type II diabetes mellitus ... 28
1.2 Adipose tissue heterogeneity ... 29
1.2.1 Brown adipose tissue ... 29
1.2.2 Distinct adipose tissue depots ... 30
1.2.3 Gender and race differences in adipose tissue distribution ... 32
1.2.4 Adipose tissue composition ... 34
1.3 Integrative adipose tissue functions ... 35
1.3.1 Immune functions ... 35
1.3.3 Energy homeostasis ... 39
1.4 Metabolism in human adipose tissue ... 40
1.4.1 Lipid metabolism ... 41
1.4.2 Carbohydrate metabolism ... 45
1.4.3 Regulation of adipose metabolism ... 47
1.5 Adipogenesis ... 50
1.5.1 Progenitor origin and cell lineage ... 51
1.5.2 Adipogenesis regulation ... 53
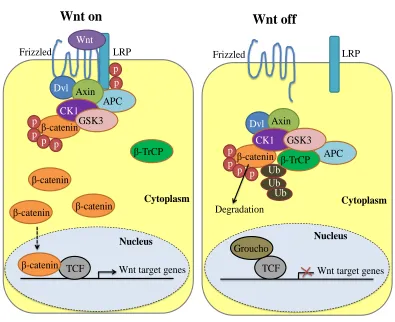
1.5.3 Wnt signalling in adipogenesis ... 56
1.6 Adipocyte endoplasmic reticulum stress ... 59
1.6.1 Endoplasmic reticulum stress and the unfolded protein response ... 60
1.6.2 Adipose tissue endoplasmic reticulum stress ... 64
1.6.3 Obesity induces adipocyte endoplasmic reticulum stress ... 65
1.7 Endoplasmic reticulum stress induced insulin resistance in adipose tissue ... 66
1.7.1 IRE1 activation of JNK and NFB ... 67
1.7.2 ER stress induced inflammation and subsequent insulin resistance .... 69
1.7.3 ER stress integration with metabolism ... 73
1.7.4 ER stress in adipogenesis ... 76
1.8 Translation to the clinic ... 77
1.9 Summary ... 81
1.10 Research hypothesis, aims and objectives ... 82
1.10.1 Research hypothesis ... 82
1.10.2 Research aims ... 82
Chapter 2: Subjects, methods and materials ... 84
2.1 Ethical approval ... 85
2.1.1 Bariatric study ... 85
2.1.2 Human adipose tissue collection... 85
2.2 Subjects ... 85
2.2.1 Subjects who underwent bariatric surgery ... 85
2.2.2 Adipose tissue collection ... 87
2.3 Tissue culture ... 87
2.3.1 Extracting primary human preadipocytes ... 87
2.3.2 Human preadipocyte ChubS7 cell line ... 89
2.3.3 Cell culture media composition ... 89
2.3.4 Propagation and differentiation of preadipocytes ... 91
2.3.5 Treatments ... 92
2.3.6 Small interfering RNA transfection ... 92
2.3.7 Collection of conditioned media, protein and RNA ... 93
2.4 Analysis of samples ... 94
2.4.1 Analysis of blood samples ... 94
2.4.2 RNA analysis ... 94
2.4.3 Protein analysis ... 97
2.4.4 Agarose gel electrophoresis ... 98
2.4.5 Lipolysis assay ... 98
2.4.6 Adipocyte staining ... 99
2.4.7 Glucose uptake assay ... 100
2.4.8 Cell viability assay ... 101
Chapter 3: Endoplasmic reticulum stress in human adipose tissue ... 103
3.1 Introduction ... 104
3.2 Results ... 106
3.2.1 Body composition, basal metabolic variables and sample analyses .. 106
3.2.2 Adipose tissue expression of UPR related genes and proteins were reduced post bariatric surgery ... 109
3.2.3 Regulation of UPR markers was improved in adipose tissue 6 months post-surgery ... 112
3.2.4 Effect of surgery type on ER stress (Restrictive versus Malabsorptive) ... 115
3.2.5 Adipose tissue inflammation and macrophage infiltration ... 118
3.3 Discussion ... 120
3.4 Conclusions ... 124
Chapter 4: Regulation of ER stress during adipogenesis ... 125
4.1 Introduction ... 126
4.2 Results ... 129
4.2.1 Cultured primary human preadipocytes had depot and BMI specific differences in lipid metabolism during adipogenesis ... 129
4.2.2 Cultured primary human preadipocytes had depot and BMI specific differences in glucose uptake during adipogenesis: VAT is insulin resistant ... 134
4.2.3 The IRE1 - XBP1s UPR pathway was elevated during adipogenesis in obese subjects compared to lean ... 136
4.2.5 To investigate the IRE1 - XBP1s pathway further a reproducible
model system, human preadipocyte cell line ChubS7, was used ... 142
4.3 Discussion ... 146
4.4 Conclusions ... 151
Chapter 5: The role of the IRE1α - XBP1s UPR pathway in human
adipogenesis and metabolism ... 152
5.1 Introduction ... 153
5.2 Results ... 155
5.2.1 IRE1 endonuclease activity was specifically inhibited with the small
molecule inhibitor 48C in adipocytes without effecting cell viability ... 155
5.2.2 During adipogenesis 48C reduced adipogenic capacity depending on
time and duration of treatment ... 161
5.2.3 During adipogenesis 48C inhibited XBP1s, adipogenic regulator and
adiponectin mRNA expression depending on treatment duration ... 165
5.2.4 During adipogenesis 48C consistently reduced adipogenic capacity
and function in adipocytes ... 171
5.2.5 During adipogenesis 48C inhibited XBP1s and adipogenic regulator
mRNA expression ... 174
5.2.6 48C reduced insulin stimulated glucose uptake and inhibited Akt
phosphorylation ... 180
5.2.7 XBP1 siRNA transfection during early adipogenesis reduced adipocyte function ... 183
5.3 Discussion ... 187
Chapter 6: Wnt10b in human adipogenesis ... 195
6.1 Introduction ... 196
6.2 Results ... 199
6.2.1 Body composition and metabolic profile of a WNT10B C256Y subject ... 199
6.2.2 Functional Wnt10b was not required for adipogenesis ... 200
6.2.3 XBP1s mRNA expression was reduced during adipogenesis in SAT WNT10B C256Y adipocytes compared to lean ... 204
6.2.4 Adipogenesis regulator CEBPα gene expression was altered during adipogenesis in SAT WNT10B C256Y adipocytes compared to lean ... 207
6.2.5 Wnt signalling was altered during adipogenesis in SAT WNT10B C256Y adipocytes compared to lean ... 210
6.3 Discussion ... 214
6.4 Conclusions ... 221
Chapter 7: Overall discussion ... 222
7.1 Overall discussion ... 223
7.2 Future work ... 229
7.3 Overall conclusions ... 233
Abbreviations
% Percent
% EBL Percent excess body mass index lost 20x 20 times magnification
40x 40 times magnification
48C 4-methyl umbelliferone 8-cabaldehyde
-TrCP Beta-transducin repeat containing E3 ubiquitin protein ligase
∆Ct Delta threshold cycle
μCi/mL Microcurie per millilitre
g Microgram
g/mL Microgram per millilitre
L Microlitre
M Micromolar
m Micrometre
U/L Microunits per litre
Abd SAT Abdominal subcutaneous adipose tissue
acyl-CoA Acyl-coenzyme A
Akt Akt, also known as protein kinase B (PKB)
AMPK AMP-activated protein kinase AP-1 Activation protein 1
APC Adenomatous polyposis coli
ARC Arcuate nucleus
AT Adipose tissue
ATP Adenosine triphosphate AU Arbitrary units
AXIN2 Axis inhibitory protein 2 BAT Brown adipose tissue
Bip Binding immunoglobulin protein BMI Body mass index
BPD Biliopancreatic diversion
Bq Becquerel
Bq/mg Becquerel per milligram
BSA Bovine serum albumin
C Celsius
C256Y Cysteine to tyrosine mutation at residue 256
CCL2 C-C motif ligand 2
CD14/68 Cluster of differentiation 14/68
cDNA Complimentary deoxyribonucleic acid
CEBP// CCAAT/enhancer-binding protein alpha/beta/delta
CHOP C/EBP homologous protein
ChREBP Carbohydrate response element binding protein
CKI Casein kinase-1
cm Centimetre
cm3 Cubic centimetre
CVD Cardiovascular disease
DAG Diacylglycerol
DMEM/F12 Dulbecco’s modified eagle medium/nutrient mixture F-12 DMSO Dimethyl sulfoxide
DNA Deoxyribonucleic acid DNL De novo lipogenesis
Dvl Dishevelled
EDTA Ethylenediaminetetraacetic acid
eIF2 Eukaryotic translation initiation factor 2 A
ER Endoplasmic reticulum
ERAD Endoplasmic reticulum associated protein degradation FA(s) Fatty acid(s)
FABP Fatty acid-binding protein FFA(s) Free fatty acid(s)
g/day Grams per day
g/L Grams per litre
GADD34 Growth arrest and deoxyribonucleic acid damage-inducible protein
GLP-1 Glucagon-like peptide-1 GLUT4 Glucose transporter type 4
GRP78 Glucose regulated protein 78 kilodalton GRPs Glucose regulated proteins
GSK-3 Glycogen synthase kinase-3
GWAS Genome wide association studies HbA1c Glycated haemoglobin
HDL High-density lipoprotein
HE Hematoxylin and eosin
HOMA-IR Homeostatic model assessment – insulin resistance HSL Hormone sensitive lipase
IDF International diabetes federation
IgG Immunoglobulin G
IKK I kappa B kinase
IR Insulin receptor
IRE1 Inositol requiring enzyme 1 alpha
IRS1/2 Insulin receptor substrate 1/2
IL-6/10 Interleukin - 6/10 JNK c-Jun N-terminal kinase
kcal Kilocalorie
kDa Kilodalton
kg Kilogram
kg/m2 Kilogram per metre squared KHB Krebs-Henseleit buffer
L Litre
LAGB Laparoscopic adjustable gastric banding
LDL Low-density lipoprotein LD(s) Lipid droplet(s)
LGCP Laparoscopic greater curvature plication
LPS Lipopolysaccharide
LRP5/6 Low-density-lipoprotein-related protein 5/6
LXR Liver X receptor
mg Milligram
mg/dL Milligram per decilitre
mg/mL Milligram per millilitre
MHO Metabolically healthy but obese
miRNA micro ribonucleic acid
mL Millilitre
mm Millimetre
mM Millimolar
mmol/L Millimoles per litre
mmol/mol Millimoles per mole
MONW Metabolically obese but normal weight mRNA Messenger ribonucleic acid
MTT 3-[4,5-dimethylthiazol-2-yl]-2,5-diphenyl tetrazolium bromide NEFA Nonesterified fatty acids
NFB Nuclear factor kappa-light-chain-enhancer of activated B cells
ng Nanogram
ng/L Nanogram per litre
ng/mL Nanogram per millilitre NHS National health service
NICE National institute for health and care excellence
nm Nanometre
nmol Nanomole
NPY neuropeptide Y
NT Non-targeting
P. Page
p Phosphorylated
P Probability
PBS Phosphate buffered saline
PBST Phosphate buffered saline - tween PCOS Polycystic ovary syndrome PCR Polymerase chain reaction
PERK Protein kinase RNA-like endoplasmic reticulum kinase
pH Power of hydrogen
PKR Protein kinase ribonucleic acid – activated
PM Plasma membrane
PPAR Peroxisome proliferator-activated receptor gamma
qRT-PCR Quantitative real time polymerase chain reaction
RIPA Radioimmunoprecipitation RNA Ribonucleic acid
ROS Reactive oxygen species rpm Revolutions per minute
RYGB Roux-en-Y gastric bypass SAT Subcutaneous adipose tissue siRNA Small interfering ribonucleic acid
SNS Sympathetic nervous system
SREBP2 Sterol regulatory element-binding protein 2
T2DM Type II diabetes mellitus
TCF7 T-cell factor 7
TCF/LEF T-cell factor/lymphoid enhancer factor
TLR(s) Toll like receptor(s)
TM Tunicamycin
TNF Tumor necrosis factor alpha
TRAF2 Tumor necrosis factor receptor associated factor 2 TUDCA Tauroursodeoxycholic acid
U/μL Units per microlitre
Ub Ubiquitin
UPR Unfolded protein response
USA United States of America
UV Ultraviolet
V Volt
VAT Visceral adipose tissue VLDL Very low-density lipoprotein
WAT White adipose tissue WEF World economic forum
WHO World health organisation
Wnt (10b) Wingless-type mouse mammary tumour virus integration site family protein (10b)
List of tables
3.2.1 P.108 Body composition and metabolic profile before and after
bariatric surgery
6.2.1 P.200 Body composition and metabolic profile of a WNT10B C256Y
subject
List of figures
1.2.2 P.32 Major adipose tissue depots
1.4.3 P.50 The importance of adipose tissue 1.5.3 P.57 Wnt signalling pathway
1.6.1 P.63 Mammalian unfolded protein response pathways
1.7.1 P.68 IRE1 activation of XBP1s and JNK
1.7.2 P.72 Unfolded protein response, inflammation and insulin resistance 1.7.3 P.75 Balance between nutritional status, unfolded protein response
activation and adipose tissue function
2.2.1 P.86 Bariatric surgery procedures under investigation
3.2.2 P.110 ER stress in abdominal subcutaneous adipose tissue was reduced
six months after bariatric surgery in obese T2DM subjects 3.2.3 P.113 ER stress signalling regulation in abdominal subcutaneous
adipose tissue was improved six months after bariatric surgery 3.2.4 P.116 Post-surgery ER stress improvements in abdominal subcutaneous
adipose tissue varied by bariatric surgery type
4.2.1 P.130 Primary human adipocytes had depot and BMI specific differences in lipid accumulation and lipolysis during
adipogenesis
4.2.2 P.135 Glucose uptake and insulin sensitivity in primary human
adipocytes varied depending on adipose tissue depot and BMI
4.2.3 P.137 The IRE1 - XBP1s pathway was elevated during adipogenesis in
adipocytes derived from obese subjects compared to lean 4.2.4 P.139 Chronic disruption of the UPR after induction of adipogenesis
inhibited adipogenic capacity
4.2.5 P.143 To investigate the IRE1α - XBP1s pathway further, a reproducible
model system, human preadipocyte cell line ChubS7, was used 5.2.1 P.157 IRE1α endonuclease activity was specifically inhibited with the
small molecule inhibitor 48C in adipocytes without effecting cell
viability
5.2.2 P.162 During adipogenesis 48C reduced adipogenic capacity
depending on time and duration of treatment
5.2.3 P.167 During adipogenesis 4μ8C inhibited XBP1s and adipogenic regulator mRNA expression depending on treatment duration 5.2.4 P.172 During adipogenesis 4μ8C consistently reduced adipogenic
capacity and function in adipocytes
5.2.5 P.176 During adipogenesis 4μ8C inhibited XBP1s and adipogenic
regulator mRNA expression
5.2.7 P.184 XBP1 siRNA transfection during early adipogenesis reduced adipocyte function
5.3.1 P.192 Proposed roles of unfolded protein response molecular signalling in adipocyte metabolism
6.2.2 P.201 Functional Wnt10b was not required for adipogenesis
6.2.3 P.205 XBP1s mRNA expression was reduced during adipogenesis in WNT10B C256Y adipocytes compared to lean
6.2.4 P.208 Adipogenesis regulator CEBP gene expression continued to
increase during adipogenesis in WNT10B C256Y adipocytes unlike lean
6.2.5 P.211 Wnt signalling protein and gene expression significantly differed during adipogenesis in WNT10B C256Y adipocytes compared to lean
Acknowledgements
This thesis was made possible through the continued help, advice, support,
collaboration and funding from several people and organisations. Therefore I would like to acknowledge and thank the following:
Gyanendra Tripathi, my academic supervisor, for giving me the opportunity to undertake this research and providing excellent supervision throughout my
studies.
The Diabetes Team at Warwick Medical School, University Hospitals Coventry
and Warwickshire, my second academic supervisor Philip McTernan, industrial supervisors Nancy Fernandes da Silva and Alastair Brown, and colleagues:
Adaikala Antonysunil, Alison Harte, Kirsty McGee, Warunee Kumsaiyai, Ciara McCarthy, Milan Piya, Ioannis Kyrou, May Khin, Abi Patel, Hema Venkataraman, Nithya Sukumar, Lucia Martinez de la Escalera Clapp, Alice
Murphy and Sahar Azharian for continued help, advice, discussion and support.
Manu Vatish; Oxford University, Nasser Al-Daghri; King Saud University, Lorenzo Romero Ramirez; Cajal Medical Institute, Narendra Reddy, University Hospital Coventry and Warwickshire, Thomas Barber, Saravanan Ponnusamy,
Sudhesh Kumar, Jan Brosens, Patrick Unwin, and Binoy Paulose Nadappuram; Warwick University, for collaborating and providing advice and support.
Clinic, Prague, Czech Republic, for collaborating for the bariatric study, and all the patients who gave consent for the study.
Sean James, Arden Tissue Bank Lead, and the team of surgeons, research nurses
and pathologists at University Hospital Coventry and Warwickshire, for obtaining patient consent, collecting and transferring clinical samples to Warwick Medical School, and all the patients who gave consent.
David Ron, University of Cambridge, England, for responding to my request and
sending me the IRE1 endonuclease inhibitor 48C, characterised in his groups
PNAS article (Cross, et al., 2012), before it was commercially available. Ulf Smith, University of Gothenburg, Sweden, for responding to my request and sending me the WNT10B primer sequences used in his groups Diabetes article
(Isakson, et al., 2009).
The Biotechnology and Biological Sciences Research Council (BBSRC) and AstraZeneca for funding my collaborative awards in science and engineering
(CASE) studentship.
The personnel at the University of Warwick and Warwick Medical School for
making an exceptional host institution and department and creating an environment conducive to undertaking medical research.
My parents, George Voyias and Carole Voyias, and family and friends for
Declaration
This thesis is submitted to the University of Warwick in support of my application
for the degree of Doctor of Philosophy. I, Philip Demos Voyias, declare that it has been composed by myself and has not been submitted in any previous application for any degree and all the research has been undertaken in accordance with
University safety policy and Guidelines on Ethical Practice.
The presented work, including data generation and data analysis, was carried out by the author except in the cases outlined below:
The bariatric study: obtaining ethical approval, patient recruitment,
obtaining patient consent, performing bariatric surgery and collecting and sending anthropometric data and SAT biopsies to Warwick Medical
School were carried out by Jana Vrbikova, Vojtech Hainer and Olga Bradnova; Institute of Endocrinology, Prague, Czech Republic, Martin
Fried, Petra Sramkova and Karin Dolezalova; OB Clinic, Prague, Czech Republic.
Human adipose tissue collection: obtaining ethical approval, patient
recruitment, obtaining patient consent, collecting WAT samples and transferring samples to Warwick Medical School was carried out by Philip McTernan and Sean James; University of Warwick, and a team of
List of publications
Parts of this thesis have been published by the author:
The findings in chapter 3 have been submitted for peer review to be published as an original article in the journal Diabetes with the following details:
Title: Bariatric surgery reduces endoplasmic reticulum stress in human
adipose tissue and is associated with improvement in metabolic risk factors in obese type 2 diabetes patients
Authors: Philip D Voyias1, Adaikala Antonysunil1, Ioannis Kyrou1, Jana Vrbikova2, Vojtech Hainer2, Olga Bradnova2, Martin Fried3, Petra Sramkova3, Karin Dolezalova4, Nasser M Al- Daghri5, Majed S
Alokail5, Ponnusamy Saravanan1, Sudhesh Kumar1, Philip G McTernan1, and Gyanendra Tripathi1*
Institutions: 1Division of Metabolic and Vascular Health, Warwick Medical School, University of Warwick, University Hospital, Clifford Bridge Road, Coventry, CV2 2DX, United Kingdom
2Institute of Endocrinology, Narodni 8, Prague 1 116 94, Czech
Republic
3OB Clinic - Center for Treatment of Obesity and Metabolic
Disorders, Prague, Czech Republic
41st Faculty of Medicine, Charles University, Prague, Czech
Republic
5Department of Biochemistry, College of Science, King Saud
University, PO Box 2455, Riyadh, 11451, Kingdom of Saudi Arabia
Abstract
Introduction
People with type II diabetes mellitus (T2DM) experience reduced quality and length of life. The disease presents a huge burden on global society through
medical, social and financial implications. Current clinical interventions are failing to ensure patient glycaemic control. The initiation of insulin resistance in T2DM requires further elucidation. If the underlying cellular mechanisms that
drive the initiation of insulin resistance can be characterised then a novel therapeutic window will be presented allowing early intervention and potentially
reducing the encumbrance of the metabolic disease. This chapter reviews current literature about the importance of white adipose tissue (WAT) in metabolic health and reviews endoplasmic reticulum (ER) stress in adipocytes as a key factor in the
initiation of insulin resistance. The review is human-focused, holistic, and organised in a reductionist way. It opens with the impact of T2DM on people and
the global population. Then WAT multifunctional integrated physiology is considered because of its role in metabolism and because obesity, characterised by WAT expansion, is the most significant risk factor for developing T2DM. The
importance of adipogenesis in WAT regulation is highlighted. ER stress as an initiator of T2DM through inhibiting insulin action and inducing WAT
1.1 Type II diabetes mellitus
1.1.1 Definition of diabetes mellitus
Diabetes mellitus is defined in the Oxford Concise Medical Dictionary as ‘a disorder of carbohydrate metabolism in which sugars in the body are not oxidized to produce energy’ (Oxford, 2015). Type I diabetes mellitus is characterised by
patients having little or no ability to produce insulin from birth or an early age.
Type II diabetes mellitus (T2DM) is acquired and is characterised by patients where the pancreas retains some ability to produce insulin but this is inadequate
for the needs of the body; or, the body becomes resistant to the effects of insulin (Oxford, 2015). The World Health Organisation (WHO) published its current diagnostic criteria for diabetes mellitus in 2006 as fasted plasma glucose above
7.0 mmol/L (126 mg/dL) or 2-hours post 75 g oral glucose challenge plasma glucose above 11.1 mmol/L (200 mg/dL) (WHO, 2006). In the United Kingdom,
the National Institute for Health and Care Excellence (NICE) recommended the WHO diagnostic criteria in their ‘Type 2 diabetes: The management of type 2 diabetes’ guidelines published in 2009, updated in July 2014 (NICE, 2009) and
they are currently being recommended for the National Health Service (NHS).
1.1.2 Clinical sequelae of type II diabetes mellitus
Patients with T2DM must balance their diet and clinical interventions to ensure glycaemic control and avoid hyperglycaemia or hypoglycaemia (plasma glucose
below 4.0 mmol/L (DiabetesUK, 2015)) to prevent pathophysiology. People with T2DM without appropriate glycaemic control utilise fatty acids instead of glucose
accumulate in the bloodstream (ketosis) and if untreated can cause diabetic coma (Umpierrez, et al., 2006). Hypoglycaemia is associated with several pathologies
including a higher risk of cardiovascular disease (CVD) as reviewed in a recent meta-analysis with almost one million T2DM participants (Goto, et al., 2013).
Chronic hyperglycaemia gives rise to a greater risk of microenvironmental defects including; retinopathy, neuropathy, nephropathy, microangiopathy and mobilopathy (impaired stem cell mobilisation) (Fadini, et al., 2014; Gerstein and
Werstuck, 2013), and macrovascular complications including; ischaemic heart disease, peripheral vascular disease and stroke (Zoungas, et al., 2014). These
hyperglycaemic and glucose toxicity induced pathologies arise via a myriad of cellular mechanisms including altered reduction and oxidation (redox) reactions, accumulation of advanced glycated end products, reviewed by Campos (Campos,
2012), and recently emerging epigenetic mechanisms (Kato and Natarajan, 2014). Lipid metabolism is also dysregulated in diabetes causing diabetic dyslipidemia,
characterised by elevated postprandial triglyceride, also known as triacylglycerol (TAG), low levels of high-density lipoprotein (HDL) cholesterol, elevated low-density lipoprotein (LDL) cholesterol and the predominance of small, dense LDL
particles, presenting a major cardiovascular risk (Wu and Parhofer, 2014). T2DM is therefore associated with reduced quality of life, significant morbidity and
reduced life expectancy (Jia, et al., 2013).
1.1.3 Epidemiology of type II diabetes mellitus
The prevalence of T2DM is increasing globally, over the last three decades it has more than doubled (Chen, et al., 2012). The International Diabetes Federation
million in 2013 to 592 million in 2035 (IDF, 2014). The WHO predicts that deaths due to diabetes will double between 2005 and 2030 (WHO, 2011). There
are variations in prevalence by geographical location, ethnicity, sex and age. Geographic variations have been attributed to differences in socio-economic
status whilst ethnic variations seem to have more profound metabolic causes, possibly linked to adipose tissue (WAT) distribution and function (Chan, et al., 2009). There is a small gender difference in the global numbers of people with
diabetes, with about 14 million more men than women estimated to have diabetes in 2013, and the prevalence increases sharply with age in both sexes (Forouhi and
Wareham, 2014).
T2DM costs individuals their quality and length of life whilst the clinical
management of the chronic disease and reduced productivity has considerable financial implications. The excess lifetime medical spending of a person
diagnosed with T2DM at 40 years old compared to without T2DM in the United States of America (USA) has been estimated to be $211,400 (Zhuo, et al., 2014). People with diabetes require at least two to three times the health-care resources
compared to people who do not have diabetes, and diabetes care may account for up to 15 % of national health care budgets (Zhang, et al., 2010). An inexorable
increase in the direct medical cost of diabetes and its detrimental economic impact through reduced productivity has been recorded (Herman, 2013). The World Economic Forum (WEF) have warned in their 2014 Global Risks Report that the
projected increase in number of people with T2DM and the associated healthcare funding will pose ‘a defining challenge for all countries over the next 10 years’
medically and financially. Understanding the risk factors and causes of T2DM will allow development of suitable interventions to reduce this burden on global
society.
1.1.4 Obesity and type II diabetes mellitus
There are several risk factors associated with developing T2DM, including smoking, adverse developmental origins, and genetic susceptibility (Chan, et al.,
2009). The main aetiological risk factors are age, obesity, family history and physical inactivity (Forouhi and Wareham, 2014). However the single most
important risk factor in contributing to T2DM is obesity (Guh, et al., 2009). Obesity is heterogeneous and alone it is not a definitive propensity for T2DM. For example, there is a defined subset of obese people who are metabolically healthy
but obese (MHO) that do not exhibit an increased mortality, increased risk of CVD, or an increased risk of T2DM compared to normal weight controls (Seo and
Rhee, 2014). In obesity there is an expansion of adipose tissue, and where the excess adipose tissue is deposited and how it functions influences T2DM risk. Excess abdominal adipose tissue, termed ‘central obesity’ poses a greater risk for
developing T2DM than excess gluteal adipose tissue (Balkau, et al., 2007). Paradoxically, obesity is not a prerequisite for T2DM. Indeed there are individuals
who are not obese on the basis of height and weight, with a body mass index (BMI) of less than 30 kg/m2, but are hyperinsulinemic, insulin-resistant and have T2DM (Ruderman, et al., 1998). These individuals have been described as ‘metabolically obese but normal weight’ (MONW) (Ruderman, et al., 1998).
MHO and MONW populations have been investigated and WAT distribution,
groups in risk of developing T2DM (Karelis, et al., 2004). WAT dysfunction can lead to the accumulation of lipids in tissues not primarily intended for fat storage
such as liver, pancreas, muscle and kidney. This ectopic fat has pathophysiological effects and may in part explain the difference in risk of
developing T2DM in MHO and MONW (Hill, et al., 2009; Strohle and Worm, 2014). WAT plays a vital role in systemic metabolism and since T2DM is a disease of metabolism, the initiation of insulin resistance and subsequent T2DM
may arise due to adverse adipose tissue function.
1.2 Adipose tissue heterogeneity
1.2.1 Brown adipose tissue
Adipose tissue found in mammals can be broadly split into two categories; white adipose tissue (WAT) and brown adipose tissue (BAT) (Peirce, et al., 2014).
Investigations into BAT over thirty years ago in rats found the tissue has important thermogenesis functions that can be cold-induced and diet-induced (Rothwell and Stock, 1979). BAT is especially abundant in neonates and in
hibernating mammals where it serves to generate body heat (Gesta, et al., 2007). BAT contains a much higher number of mitochondria per cell and has a more
extensive capillary network than WAT and therefore it can be distinguished from WAT by histology. BAT also has a characteristic protein, uncoupling protein-1 (UCP-1), which can be used as a marker of the tissue (Cannon and Nedergaard,
2004). Although BAT had been found in human neonates, evidence confirming the presence of BAT in adult humans remained sparse until recently. Paired
indicated the presence of BAT in adult humans in the region of anterior neck to thorax and were confirmed by immunostaining and histology (Cypess, et al.,
2009). Furthermore, magnetic resonance (MR) imaging has been used to identify human BAT (Reddy, et al., 2014). Not only has BAT been identified in adult
humans, its activity has also been revealed. BAT thermogenesis activity has been demonstrated in healthy men when exposed to cold temperatures (16 C) and BAT activity was reduced in men who are overweight or obese (van Marken
Lichtenbelt, et al., 2009). BAT activity in humans has also been
pharmacologically activated by an orally administered 3-adrenergic receptor
agonist and shown to increase resting metabolic rate by about 200 kcal compared
to control (Cypess, et al., 2015). Cellular mechanistic studies have been conducted to compare properties of BAT and WAT, however these have been mostly restricted to rodent model systems (Rosell, et al., 2014). BAT may play a
role in adult human metabolism but WAT has a much larger role in metabolism, energy storage and energy regulation and WAT comprises the vast majority of
human AT (Obregon, 2014). Furthermore, WAT is expanded in obesity, the most significant risk factor for developing T2DM. Therefore WAT will be considered
further.
1.2.2 Distinct adipose tissue depots
WAT, like skeletal muscle, is distributed through the body in discrete depots (figure 1.2.2) (Shen, et al., 2003). Subcutaneous adipose tissue (SAT) represents about 85 % of all body fat and is unequally distributed through the body, with
in the abdomen than SAT and include omental that connects to the stomach. The functions and properties of each WAT depot overlap but there are distinct
differences (White and Tchoukalova, 2014). Accumulation of adipose tissue in different depots has differential risk associated with development of T2DM. Early
clinical observations by Vague suggested upper-body obesity, commonly referred to as central obesity, was associated with a much greater incidence of insulin resistance than lower-body obesity (Vague, 1956). In central obesity, different
depths of abdominal SAT are functionally distinct and independently correlate with metabolic complications of obesity (Smith, et al., 2001). These observations
have been supported by several studies, reviewed by Frayn et al. (Frayn, et al., 2003). The difference in risk of developing T2DM conferred by different WAT depots is likely to be due to a combination of WAT properties including lipid and
carbohydrate metabolism (lipolysis, lipid accumulation and glucose uptake) and systemic signalling (protein and lipid secretion and innervation). Lipolysis, TAG
synthesis and storage, and protein secretion varies between WAT depots as reviewed by Lee et al. (Lee, et al., 2013). Hormone secretion varies between WAT depots, for example the hormone resistin is secreted from both
preadipocytes and adipocytes and both gene and protein expression is higher in abdominal WAT compared to femoral or mammary WAT (McTernan, et al.,
2002). VAT has been found to secrete more pro-inflammatory molecules like interleukin 6 (IL-6) compared to SAT (Fried, et al., 1998). However abdominal SAT can also secrete large quantities of pro-inflammatory proteins
(Youssef-Elabd, et al., 2012). WAT depots can have protective effects against T2DM, for example increased gluteal and femoral WAT in people with a lower waist hip
protective phenomenon of gluteal and femoral fat is credited to its beneficial secretion profile (Manolopoulos, et al., 2010). WAT distribution therefore plays a
role in relative risk of developing T2DM. Naturally occurring differences in WAT distribution may provide further insight into important depots for developing
[image:33.595.116.511.244.575.2]T2DM.
Figure 1.2.2 Major adipose tissue depots
Epicardial
Retroperitoneal Visceral (VAT)
Abdominal subcutaneous (Abd SAT)
Femoral Gluteal
Gonadal
Mammary
Figure 1.2.2 legend: Major adipose tissue depots. Adipose tissue is distributed
throughout the body in discrete depots with functionally distinct properties.
1.2.3 Gender and race differences in adipose tissue distribution
(Blaak, 2001). Women accumulate more WAT in lower body depots like gluteal and femoral, while men accumulate more WAT in central areas, both Abd SAT
and VAT (Geer and Shen, 2009). Perhaps this is partly why more men develop obesity linked T2DM than women. Mechanisms that underlie this sexual
dimorphism are unclear. Sex steroid hormones androgen and estrogen have been investigated. Testosterone-treated men have less adiposity and selective loss of central WAT (Allan and McLachlan, 2010), however women with polycystic
ovary syndrome (PCOS) with a hyperandrogenic state are prone to central obesity (Escobar-Morreale and San Millan, 2007). Sex specific differences in lipid and
glucose metabolism have been investigated and may be an underlying explanation for the observed differences in WAT distribution (Varlamov, et al., 2015). Sex hormone milieu has been linked to gender and race differences in obesity (Perry
and Martin, 2014).
Evidence of race disparities in adiposity has been accumulating and these differences are becoming apparent from early childhood (Zilanawala, et al., 2014). Obesity is the most significant risk factor for developing T2DM across
different ethnicities, however the risk of developing T2DM varies by extent of obesity in different ethnicities. For example, a prospective study found that
Europeans developed T2DM at a much higher obesity, measured by BMI and waist circumference, compared to South Asians and Arfican-Caribbeans (Tillin, et al., 2015). These differences may be due to altered WAT function in different
that is abnormal or impairment in the regulation of metabolic or physiological processes, may contribute to T2DM development.
1.2.4 Adipose tissue composition
WAT is comprised of many cell types that together orchestrate several important
physiological processes (Trujillo and Scherer, 2006). WAT is a multifaceted tissue consisting of preadipocytes, adipocytes, endothelial cells, fibroblasts,
vascular smooth muscle cells and resident immune cells such as monocytes, macrophages, T cells and B cells (Caspar-Bauguil, et al., 2005; Nishimura, et al.,
2013). The precursor cells constitute the stromal vascular fraction of adipose tissue. Human WAT is a source of multipotent stem cells (Zuk, et al., 2002). Adipocytes are the main cellular component of WAT and the key functional
energy-storing unit at the interface of energy homeostasis dynamically influenced by a number of cues from surrounding cells and distant hormonal and neuronal
stimuli. To facilitate systemic integration, WAT is supplied with a highly regulated and dynamic network of vasculature (Frayn and Karpe, 2014; Yilmaz and Hotamisligil, 2013), lymph nodes (Pond and Mattacks, 1995) and is
innervated by the sympathetic nervous system (SNS) (Bartness and Song, 2007). The WAT as a whole is greater than the sum of the individual parts and the parts
1.3 Integrative adipose tissue functions
1.3.1 Immune functions
WAT plays such an extensive role in immunology it has been described as an ‘immunological organ’ by Grant and Dixit in their recent review (Grant and Dixit,
2015). WAT serves as a key site for the interaction of adipocytes with other specialised effectors of the immune system. This is particularly advantageous in
SAT immediately below the skin as a first line of defence and may have arisen due to the primitive need to both acquire nutrients and defend against pathogens.
Infiltration of inflamed WAT by immune cells such as eosinophils, macrophages and neutrophils bolsters the existing WAT resident immune cell repertoire and is an important feature of the immune system to provide host defence against
pathogens (Exley, et al., 2014). There are several similarities between adipocytes and a wide range of immune cells including macrophages, dendritic cells and T
cells (Wellen and Hotamisligil, 2005). These features include pathogen sensing, phagocytic properties, complement activation and production of inflammatory mediators (Shoelson, et al., 2006). In vitro studies on human adipocytes have
shown antigenic stimuli increased the secretion of the adipokine resistin and that proinflammatory cytokine levels were increased in response to resistin
(Kusminski, et al., 2007). Toll like receptors (TLRs) are expressed on human adipocytes (Wang and Nakayama, 2010). The TLR family of receptors recognise specific components conserved among microorganisms but distinguishable from
host molecules, collectively referred to as pathogen-associated molecular patterns (PAMPs). Examples of conserved features of pathogens include bacterial
circulating gut derived bacteria and therefore stimulate an innate immune response (Creely, et al., 2007). Although WAT immune responses and the
associated local inflammation assist the defence against pathogens they can be detrimental if the tissue remains inflamed. Resident WAT regulatory B cells play
a role in reducing inflammation by secreting anti-inflammatory interleukin-10 (IL-10) (Nishimura, et al., 2013). WAT inflammation must be regulated to prevent adipose tissue dysfunction and subsequent T2DM.
1.3.2 Endocrine functions
Cells within the WAT secrete several proteins and therefore to perform appropriately they require a functional protein secretion system. Given the resident cells of WAT secrete signalling proteins the WAT can itself be
considered as an ‘endocrine organ’ (Galic, et al., 2010). Cloning of the obese gene and the identification of its product, leptin (Zhang, et al., 1994), was one of the
first discoveries of an adipocyte derived signalling molecule and established an important role for adipose tissue as an endocrine organ. Since the discovery of leptin several other adipokines have been characterised, including chemerin,
interleukin-6 (IL-6), apelin, visfatin, adiponectin, tumor necrosis factor-alpha (TNFα), plasminogen activator inhibitor-1 and retinol binding protein 4 (Ouchi, et
al., 2011). The term ‘adipokinome’ has been suggested to describe collectively the proteins and lipid moieties, such as prostaglandins and fatty acids, released by adipocytes (Trayhurn and Wood, 2004). The secreted molecules of the
adipokinome have diverse roles in lipid metabolism, insulin sensitivity, vascular homoeostasis, the alternative complement system, blood pressure regulation,
their possible application as a treatment for obesity has been reviewed (Khan and Joseph, 2014).
Adiponectin is an adipokine synthesized almost exclusively by adipocytes and is
the most abundant adipokine in circulation (3 to 30 µg/mL) (Ouchi, et al., 2003). However adiponectin levels are decreased in obese individuals compared to lean individuals (Ryo, et al., 2004). Consistent with this, the synthesis of adiponectin
by adipocytes is inhibited by obesity related pro-inflammatory molecules such as
IL-6 and TNF (Berg and Scherer, 2005) as well as by oxidative stress and
hypoxia (Hosogai, et al., 2007). An association between adiponectin levels and
obesity-linked metabolic dysfunction is supported by several clinical observations. Namely, high adiponectin levels are associated with a lower risk for developing type 2 diabetes, plasma adiponectin levels are decreased in patients
with type 2 diabetes (Li, et al., 2009), and plasma adiponectin levels negatively correlate with VAT accumulation (Ryo, et al., 2004) therefore ‘hypoadiponectinemia’ is closely associated with the clinical phenotype of the
metabolic syndrome. Experimental models indicate that adiponectin protects
against obesity linked metabolic dysfunction. Diabetic mice have been shown to reduce hyperglycaemia following administration of adiponectin by enhancing insulin activity (Berg and Scherer, 2005), and when given to obese mice it
reduced plasma levels of glucose, TAG and free fatty acids (FFAs) by increasing fatty acid oxidation in muscle tissue (Fruebis, et al., 2001). Consistent with this,
AMP-activated protein kinase (AMPK) in liver and skeletal muscle which leads to inhibition of gluconeogenesis in the liver and an increase in fatty acid oxidation
and glucose uptake in muscle tissue (Tomas, et al., 2002; Yamauchi, et al., 2002). Adiponectin is synthesised as a 32 kDa monomeric protein and then assembled
into low molecular weight trimers, medium molecular weight hexamers and high molecular weight (HMW) multimers (Galic, et al., 2010). The HMW form has insulin sensitising effects (Liu and Liu, 2014).
Leptin is a 16 kDa pro-inflammatory adipokine produced mainly by adipocytes
and is required for control of bodyweight and reproduction (Lord, 2006). Mice defective in leptin or the leptin receptor are hyperphagic, obese, insulin resistant and infertile (Lord, 2006). The leptin deficient (ob/ob) mouse has been used
extensively as an in vivo model of obesity and T2DM (Drel, et al., 2006). Mice injected with leptin on a daily basis experienced a fast reduction in food intake,
body mass and percent body fat, but maintained lean muscle mass, and increased energy expenditure and restored reproductive function and euglycemia (Pelleymounter, et al., 1995). Leptin is effective at improving metabolic
dysfunction in patients with congenital leptin deficiency or lipodystrophy (Farooqi, et al., 2002; Oral, et al., 2002). Leptin resistance in obesity has been
suggested since levels in the blood positively correlate with adipose mass and obese individuals have high leptin levels without the expected anorexic responses (Friedman and Halaas, 1998). Leptin interacts with both the neuronal and immune
The diverse roles of the leptin and adiponectin and their altered expression in the obese state demonstrate the complexity of adipokine signalling. The two
aforementioned adipokines influence the level of WAT inflammation; an important factor given increasing evidence indicates that obesity is causally linked
to a chronic low-grade inflammatory state and T2DM ensues (Hotamisligil, 2006; Shoelson, et al., 2006).
1.3.3 Energy homeostasis
Systemic energy homeostasis requires appropriate function of several
physiological systems including the digestive, circulatory, musculoskeletal, endocrine, and nervous systems. WAT adipocytes play a vital integrative role between these systems and are the main energy store in the body (Rosen and
Spiegelman, 2006). Energy homeostasis is governed by a neuroendocrine system that links WAT to the brain. An example of the WAT – hypothalamus axis is the
reciprocal integration of WAT derived peripheral anorexic signal leptin and hypothalamic orexigenic peptide neuropeptide Y (NPY) (Zhang, et al., 2014b). The arcuate nucleus (ARC) of the hypothalamus contains NPY neurons that sense
and integrate peripheral energy signals, such as blood glucose concentration, leptin and insulin due to the unique anatomical structure of the ARC in lacking a
blood brain barrier (Kohno and Yada, 2012). Energy deficiency and greater metabolic demand such as increased exercise induces the synthesis of ARC NPY (Leibowitz and Wortley, 2004). NPY regulates energy utilisation in WAT by
promoting adipogenesis and lipid accumulation and inhibiting lipolysis, and affects food intake by innervating with other appetite regulatory factors in the
homeostasis by influencing liver and muscle metabolism as reviewed by Saltiel and Kahn (Saltiel and Kahn, 2001). Adipocytes release FFAs into the circulation
that reduce glucose uptake in muscle, insulin secretion from pancreatic -cells and
increase glucose production from the liver (Bergman and Ader, 2000). Adiposity influences muscle derived peptide irisin, which may have a central role in
metabolism given it has been identified in human cerebrospinal fluid (Piya, et al., 2014). WAT regulation is imperative for systemic energy homeostasis and if it becomes dysfunctional then diseases of energy homeostasis, such as T2DM, may
arise.
1.4 Metabolism in human adipose tissue
The ability to take up and store energy during a fed state and break down and
release energy in a fasted state provides an advantage through the ability to withstand fluctuations in energy supply. WAT adipocytes undertake anabolic and
catabolic metabolic processes in response to the needs of the body and contain the biggest reserve of energy in the body in the form of lipid TAG; therefore WAT plays a vital role in systemic energy regulation. WAT adipocytes are able to take
up energy from the blood, mostly in the form of carbohydrate (glucose) and lipid (nonesterified fatty acids – NEFA), store energy predominantly as lipid (TAG)
and release energy when required predominantly as lipid (NEFA). WAT adipocytes have a very dynamic pattern of metabolism influenced by hormonal
and neuronal stimuli and consequently rapidly respond to energy requirements. A dynamic crosstalk between systemic metabolic organs in which WAT plays a prominent role exists to ensure the energy needs of the body are supplied. During
liver-brain-adipose neural axis that shifts the energy source from carbohydrate to TAG in adipocytes in order to maintain energy balance (Izumida, et al., 2013).
Conversely, in a fed state glycogen accumulates in the liver and lipogenesis is stimulated in adipocytes (Lu, et al., 2014).
Proteins are essential at virtually every stage of systemic energy transfer; digestive enzymes, transport proteins in cellular uptake and circulation transfer,
biochemical enzymes that catalyze anabolic and catabolic reactions, energy regulatory hormones, energy storage proteins such as those coating lipid droplets
and many more function in systemic and WAT metabolism. Therefore functional protein metabolism, especially protein synthesis, is vital for systemic energy regulation. Thus the intracellular organelle ER that processes proteins plays a vital
role in energy regulation and impaired ER function can cause several pathologies (Kim and Arvan, 1998; Ni and Lee, 2007). In this section about metabolism in
human WAT, the roles of proteins are presented in an integrated way just as the roles of proteins are integrated in WAT metabolism. Excess WAT in obesity is the main risk factor for T2DM, a disease of impaired metabolism; therefore
metabolic processes in WAT may play an important role in the initiation of T2DM.
1.4.1 Lipid metabolism
Dietary fat is absorbed by the gut and transported to the circulation in
chylomicrons (Mansbach and Gorelick, 2007). Fatty acids from circulating lipids are provided to WAT by the albumin-bound NEFA pool, or either TAG
low-density lipoprotein (VLDL) in the post-absorptive state. TAG must be hydrolyzed to fatty acids by extracellular enzyme lipoprotein lipase bound to the wall of
capillaries before they can be taken up by adipocytes (Mead, et al., 2002). The trafficking of fatty acids into and out of adipocytes is regulated by several proteins
and enzymes and is under control by hormonal and metabolic factors (Thompson, et al., 2010). Within adipocytes NEFAs are converted to TAG and stored in lipid droplets (LDs), the lipid storage organelles of all organisms. When energy is
required in other tissues TAG is converted by lipases to NEFA and glycerol and both are released into the circulation (Walther and Farese, 2012). During fasting,
plasma NEFA is almost entirely from hydrolysis of TAG stored in SAT LDs (Karpe, et al., 2011). NEFA circulates predominantly bound to albumin and is taken up and oxidized in muscle, liver and other tissues. A proportion will be
re-esterified to form new TAG in the liver, which is exported in VLDL and can be taken up by adipocytes after being broken down to NEFA by lipoprotein lipase
(Frayn and Humphreys, 2012).
LDs and their associated proteins in adipocytes play a specific role in maintaining
systemic energy homeostasis. The cytosolic LD is composed of a core of TAG surrounded by a monolayer of phospholipids and lipid droplet-associated proteins,
including enzyme coactivators and structural proteins. Neutral lipids occupy the core of LDs and in human adipocytes are primarily TAG with few sterol esters. In mammalian cells TAG synthesis is catalyzed by acyl-coenzyme A:diacylglycerol
acyltransferase (DGAT) enzymes DGAT1 and DGAT2 (Buhman, et al., 2001). DGAT1 and DGAT2 both reside within the ER, although DGAT2 is also found in
2009). LD formation requires further clarification, however evidence suggests LDs form de novo in mammalian cells from the ER membrane. ER diacylglycerol
(DAG) enrichment recruits perilipin 3, a LD coat protein (Skinner, et al., 2009), LDs are arrested in the ER membrane by tight binding of lipidated apolipoprotein
B-100 (ApoB) (Ohsaki, et al., 2008), and ER localised fat storage-inducing transmembrane proteins 1 and 2 (FIT1 and FIT2) mediate partitioning of cellular TG into LDs (Gross, et al., 2010). Lipid droplet formation is tightly regulated
with cholesterol efflux to maintain intracellular free cholesterol level within a narrow range (Martin and Parton, 2006). Studies in macrophages have found that
increases in ER free cholesterol can lead to the induction of the unfolded protein response via changes in the activity of the ER calcium pump sarco(endo)plasmic-reticulum calcium ATPase-2b (SERCA2b) that lead to the depletion of ER
calcium stores (Feng, et al., 2003; Li, et al., 2004). Therefore the ER plays a vital role in the formation of lipid droplets and ER functional integrity is essential for
appropriate LD formation and energy storage.
Lipolysis is the catabolism of TAG in LDs. In WAT lipolysis is a key process to
regulate cellular and systemic energy homeostasis. Lipolytic pathways converge on either protein kinase A (PKA) or protein kinase G (PKG), which phosphorylate
several proteins interacting with the LD, the site of action of lipases and cofactors (Arner and Langin, 2014). At the LD surface TAG are sequentially hydrolysed into DAG, monoacylglycerol (MAG) and glycerol, releasing one molecule of fatty
acid (FA) at each step. Three lipases work in sequential fashion in human adipocytes to ensure complete hydrolysis of TAG: adipose triglyceride lipase
monoglyceride lipase (Bezaire, et al., 2009). Both ATGL and HSL require phosphorylation to become fully active lipases (Krintel, et al., 2008; Pagnon, et
al., 2012). Key proteins, including perilipin (Brasaemle, 2007) and cell death-inducing DFFA-like effector A (CIDEA) (Puri, et al., 2008), associate with the
LD in human adipocytes and seem to play a role in TAG deposition and lipolysis. Lipolysis in WAT and the subsequent increase in plasma NEFA has been considered inevitable in obesity and was suggested as a mechanism for obesity
induced T2DM. However many studies have shown that as WAT mass expands, NEFA release per kilogram WAT is downregulated. Furthermore, obese T2DM
subjects can have normal NEFA concentrations and subjects with elevated NEFA concentrations do not necessarily have insulin resistance (Karpe, et al., 2011). Lipolytic products including FAs and DAGs serve as signalling intermediates and
may play a role in metabolic regulation (Masoodi, et al., 2014; Zechner, et al., 2012).
Adipose tissue is the body’s biggest pool of cholesterol. In adipocytes nearly all cholesterol (>95 %) exists as free, non-esterified form and resides mostly in the
LD (Murphy, et al., 2009) and a lower amount in plasma membrane (PM) invaginations called caveolae (Pilch, et al., 2011). Adipocyte cytoplasmic
cholesterol derives mostly from lipoprotein uptake, whereas PM cholesterol is predominantly from de novo cholesterol biosynthesis (Musso, et al., 2013). Caveolae are important signalling platforms, serving as a concentrating point for
several signalling molecules, including glucose transporter type 4 (glut4) and insulin receptor, and their stability and functionality depends on high PM
adipocytes in dysregulated obesity, dilutes the PM cholesterol across an increased cell surface (Le Lay, et al., 2001). Consequently, sterol regulatory
element-binding protein 2 (SREBP2) detects cholesterol PM dilution as cholesterol depletion and activates transcription of cholesterol biosynthesis genes, further
promoting cholesterol accumulation (Bauer, et al., 2011). In addition, PM cholesterol depletion disrupts caveolae integrity and function and subsequently impairs intracellular insulin signalling (Breen, et al., 2012). The regulation of
adipocyte lipid metabolism is therefore paramount to ensure appropriate energy utilisation.
1.4.2 Carbohydrate metabolism
Metabolism of carbohydrates in WAT is essential for the transfer of energy to
quickly available energy via the generation of adenosine triphosphate (ATP) and for long-term energy storage via integration with lipid synthesis. WAT stores the
largest energy reserve in the body, however this is almost exclusively made up of TAG and relatively little carbohydrate is stored. The liver and skeletal muscle store most of the body’s carbohydrate reserve as glycogen, and glycogen storage
diseases primarily affect these tissues (Hicks, et al., 2011). Glucose enters adipocytes through glut4 responsible for basal (unstimulated) and
insulin-stimulated glucose uptake (Mueckler and Thorens, 2013). In WAT, glucose is mostly used for mitochondrial dependent aerobic respiration to generate ATP. Mitochondrial dysfunction in WAT has been linked to activation of ER stress
(Rainbolt, et al., 2014) and progression of T2DM (Kusminski and Scherer, 2012). Within adipocytes the interorganellar organisation between the mitochondria and
between these two compartments is supported by evidence suggesting the regulation of numerous physiological processes including mitochondrial
metabolism, calcium signalling and cell death (de Brito and Scorrano, 2010). Therefore the functional integrity of the ER plays a vital role in cellular energy
homeostasis and thus in turn systemic energy homeostasis.
In lipogenic tissues, such as WAT, the expression and activity of glycolytic and
lipogenic pathways are linked. Carbohydrates are utilised in adipocytes both for the synthesis of TAG from existing fatty acids, and for the synthesis of new fatty
acid molecules from non-lipid substrates in de novo lipogenesis (DNL). The synthesis of TAG requires glycerol-3-phoshate (G3P) for the initial step of fatty acid esterification. G3P is produced in adipocytes either from glucose through the
first steps of glycolysis or from gluconeogenic precursors through glyceroneogenesis (Reshef, et al., 2003). Human DNL contributions from liver
(1.5 kg) and WAT (12 – 15 kg), on a whole body basis, are comparable between 1 – 2 g/day for each tissue (Diraison, et al., 2003). DNL in human adipocytes is
stimulated by glucose and a full stimulation requires the simultaneous presence of
glucose and insulin (Foufelle, et al., 1992). In the liver glucose acts by dephosphorylation of carbohydrate response element binding protein (ChREBP)
allowing it to enter the nucleus where it binds to a specific response element in the promoter of glycolytic (liver pyruvate kinase, L-PK) and lipogenic (fatty acid synthase, FAS and acetyl-CoA carboxylase, ACC) genes. The roles of glucose
and ChREBP in WAT are not as extensively studied as in the liver, however evidence suggests signalling is mediated through the activation of the classical
ChREBP- (Herman, et al., 2012). This new isoform is a potent stimulator of the
lipogenic pathway. Therefore carbohydrate metabolism in WAT is essential for systemic energy regulation and dysfunction in T2DM can have many adverse
consequences.
1.4.3 Regulation of adipose metabolism
Adipocyte metabolism is subject to several levels of regulation, including endocrine, metabolic and neuronal that synergistically coordinate appropriate
energy transfer for the varying needs of the body influenced by diet, physical activity and physiological processes. Endocrine and metabolic regulators are
distributed to adipocytes via the blood flow, hence the regulation of blood flow itself can alter the metabolism of WAT (Frayn and Karpe, 2014). Insulin is the classical regulator of metabolism in WAT. The hormone is secreted by pancreatic
-cells and has systemic metabolic effects, altering liver, muscle and WAT
metabolism. In adipocytes insulin activates several signalling cascades that include the activation by phosphorylation of Akt, also known as protein kinase B,
that result in enhanced glucose uptake and inhibited lipolysis, as reviewed by Guo (Guo, 2014). Insulin secretion is stimulated in the post-prandial state by a class of
gut hormones called incretins that include glucagon-like peptide-1 (GLP-1) and glucose-dependent insulinotropic peptide (GIP) (Kim and Egan, 2008). Conversely, in the fasted state insulin secretion is inhibited by a recently
identified hormone called limostatin which is expressed in -cells and described as a ‘decretin’ (Alfa, et al., 2015). Other important endocrine hormones also
control adipose tissue physiology and metabolism, including growth hormone and
androgens (O'Reilly, et al., 2014) and glucocorticoids (Lundgren, et al., 2008). Metabolic nutrients including glucose, amino acids and fatty acids are capable of
activating intracellular signalling cascades such as the hexosamine, mammalian target of rapamycin (mTOR) and adenosine monophosphate-activated protein
kinase (AMPK) signalling pathways (Marshall, 2006). The aforementioned pathways are interconnected, coupled to insulin signalling and linked to the release of metabolic hormones from WAT (Holzer, et al., 2011). Vitamin B12
deficiency has been linked to an adverse lipid profile in subjects with T2DM in multiple populations, therefore micronutrients including vitamin B12 may also
influence WAT metabolism (Adaikalakoteswari, et al., 2014). WAT is innervated by the SNS and adipocyte lipolysis can be stimulated by norepinephrine (NE)
activating -adrenoceptor and consequent downstream activation of HSL
(Bartness, et al., 2014). These endocrine, metabolic and neuronal factors interplay
to coordinate adipocyte metabolism.
Adipocyte metabolism is also influenced by genetic makeup and epigenetic mechanisms of genome regulation. Genome wide association studies (GWAS)
have identified candidate genes such as transcription factor 7-like 2 (TCF7L2) with specific alleles that confer an increased relative risk for developing T2DM through altered metabolism (Grant, et al., 2006). Not only do certain genes confer
an increased risk for developing T2DM, but also how genes are regulated. This is important during embryonic development, where several factors including the
confined to development; indeed it is a dynamic process that occurs throughout life. DNA methylation profiles of several genes biologically relevant to the
development of adiposity including lipase, hormone sensitive (LIPE) encoding HSL, in SAT of adult men and women are associated with extent of adiposity
(Agha, et al., 2014). Vitamin B12 insufficiency has been shown to induce cholesterol biosynthesis by limiting s-adenosylmethionine and modulating the methylation of SREBF1 and LDLR genes (Adaikalakoteswari, et al., 2015). A
further link between genome and metabolic profile has been hypothesised via telomere length. Enhanced biological aging in South Asian T2DM men with
reduced telomere length tracked changes in lipids and BMI (Harte, et al., 2012a). Therefore adipocyte metabolism plays a vital role in energy homeostasis and is regulated by several mechanisms. In T2DM these regulatory mechanisms fail and
adipocyte metabolism becomes dysregulated causing considerable pathologies. Elucidating the initiation of adipocyte dysregulation will allow development of
Figure 1.4.3 The importance of adipose tissue
Immune integration Appetite
regulation
Energy
mobilisation Energy storage,
cholesterol sequestration
Glucose uptake Lipid and glucose
metabolism
Energy supply
Brain Muscle Immune system
Gut
Pancreas Liver
Vasculature
Adipose tissue
Figure 1.4.3 legend: The importance of adipose tissue. Adipose tissue is multifunctional and integrates several systems in the body to fulfill several vitally important roles.
1.5 Adipogenesis
Adipocytes are specialised cells that synthesise and store fat in WAT and play a
major role in systemic energy homeostasis. In order to accommodate the energy requirements of the body WAT is able to expand and contract during adult life despite most development during prenatal and early postnatal life (Poulos, et al.,
2010). WAT expansion occurs primarily in two ways, by increasing adipocyte cell number (hyperplasia) or by increasing the size of existing adipocytes