http://wrap.warwick.ac.uk
Original citation:
Shi, Lei, Cristea, Alexandra I. and Hadzidedic, Suncica (2014) Multifaceted open social
learner modelling. In: Popescu, Elvira and Lau, Rynson W. H. and Pata, Kai and Leung,
Howard and Mart, Laanpere, (eds.) Advances in Web-Based Learning – ICWL 2014.
Lecture Notes in Computer Science, Volume 8613 . Springer International Publishing,
pp. 32-42. ISBN 9783319096346
Permanent WRAP url:
http://wrap.warwick.ac.uk/61701
Copyright and reuse:
The Warwick Research Archive Portal (WRAP) makes this work by researchers of the
University of Warwick available open access under the following conditions. Copyright ©
and all moral rights to the version of the paper presented here belong to the individual
author(s) and/or other copyright owners. To the extent reasonable and practicable the
material made available in WRAP has been checked for eligibility before being made
available.
Copies of full items can be used for personal research or study, educational, or not-for
profit purposes without prior permission or charge. Provided that the authors, title and
full bibliographic details are credited, a hyperlink and/or URL is given for the original
metadata page and the content is not changed in any way.
Publisher’s statement:
"The final publication is available at Springer via
http://dx.doi.org/10.1007/978-3-319-09635-3_4
"
A note on versions:
The version presented here may differ from the published version or, version of record, if
you wish to cite this item you are advised to consult the publisher’s version. Please see
the ‘permanent WRAP url’ above for details on accessing the published version and note
that access may require a subscription.
Multifaceted Open Social Learner Modelling
Lei Shi, Alexandra I. Cristea and Suncica Hadzidedic
Department of Computer Science, University of Warwick, CV4 7AL, Coventry, United Kingdom
{lei.shi, acristea, s.hadzidedic}@dcs.warwick.ac.uk
Abstract. Open social learner modelling (OSLM) approaches are promoted in order to assist learners in self-directed and self-determined learning in a social context. Still, most approaches only focus on visualising learners’ performance, or providing complex tools for social navigation. Our proposal, additionally, emphasises the importance of visualising both learners’ performance and their
contribution to a learning community. We seek also to seamlessly integrate
OSLM with learning contents, in order for the multifaceted OSLM’s prospect
for ubiquity and context-awareness to enrich the adaptive potential of social e-learning systems. This paper thus presents the design of multifaceted OSLM by introducing novel, personalised social interaction features into Topolor, a social personalised adaptive e-learning environment. The umbrella target is to create and study aspects of open social learner models. An experimental study is conducted to analyse the impact of the newly introduced features. The results are finally concluded to suggest future research and further improvements.
1 Introduction
Following from existing studies, the main research goal presented in this paper is to explore the design of multifaceted open social learner models (OSLM) in a social personalised adaptive e-learning environment [14]. Compared to existing studies, this research aims at enabling interactive visualisation of different OSLM angles, to potentially promote metacognitive activities. Unlike existing approaches that use OSLM visualisation only as a social navigation tool, our approach also seeks to seamlessly and adaptively integrate OSLM with the learning contents, so that its ubiquity and context-awareness can support new adaptation and personalisation methods for social e-learning. It is also noteworthy that, unlike existing studies that focus only on visualising learners’ performance, we emphasise the possibility and (in our view) necessity of visualising both performance and contribution, reflecting not only a learner’s role as a knowledge consumer, but also that of a knowledge producer, which can better integrate in the Web 2.0 and Web 3.0 era. Importantly, the visualisation is built on a Facebook-like appearance, and on features inspired from popular games, instead of on traditional learning environment visualisations.
In the remainder of the paper, section 2 details related work on OSLM and systems supporting social learner models visualising, explaining the need of a multifaceted OSLM. Section 3 shortly describes Topolor, a social e-learning environment and the basis for the new multifaceted OSLM. Section 4 elaborates on Topolor’s new features. An experimental study is reported in section 5, analysing users’ perceived acceptance of these features; and section 6 outlines conclusions and future work suggestions.
2 Related Work
A learner model often refers to a model of knowledge, or other characteristics of a learner, constructed from direct input or observation of learning activities in, e.g., adaptive educational hypermedia systems (AEHS), and updated according to the learner’s current understanding of the target learning contents; while an open learner model has specific provisions for the learner to explicitly view the information in her model, so as to support self-reflection of her own and her peer learning processes, and explain the reason of getting a recommendation [9]. OLM have been implemented using a wide range of modelling approaches, and its various educational benefits are thoroughly discussed in the literature, such as raising learners’ awareness of their current knowledge levels and encouraging them to reflect on the learning process [6].
In comparison with OLM, social OLM (OSLM) have pushed the research area of AEHS towards fostering diversification of learner modelling, richer visualisation and interaction of learner models [2], and accumulating a great set of theories and techniques to build a variety of e-learning environments with personalised, adaptive and social features. Recent studies, as visited below, mainly focus on visualising the learning progress and providing social navigation support based on learner models.
4-level hierarchical representation of a tree-map, and each 4-level clusters different 4-level of information in detail (from entire class’s performance to individual’s performance on a single question). A learner can also observe her own performance in comparison with the rest of the class. However, QuizMap cannot fit larger classes that generate too many cells on the TreeMap, causing it to become too crowded (information overload). ProgressiveZoom [12] is built upon the Google-Maps paradigm, seeking to address information overload issues, by enabling learners to zoom in or out in a multi-layer fashion. However, it has limited ability to control comparisons between learners.
To address these limitations, we thus seamlessly integrated multifaceted OSLM at all granularity levels of learning contents, i.e., at course level, topic level, resource level, etc. This addresses the limited-level granularity learning content representations in IntrospectiveViews, and the concern of too crowded user interface or information overload in QuizMap. Moreover, a multifaceted OSLM allows a learner to compare to individuals and groups, unlike in Progressive Zoom. Additionally, unlike these systems, we build multifaceted OSLM with Facebook-like and popular game-like visualisation, which potentially makes features easier to use by now-a-day’s learners.
3 Topolor
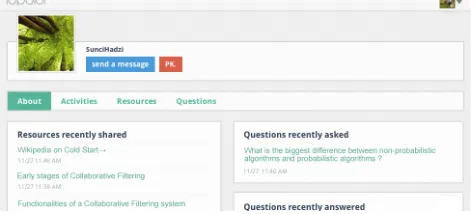
[image:4.595.180.418.558.665.2]Topolor is a social personalised adaptive e-learning environment. Its design refers to the connectivist learning theory [7], which argues that learning is process of creating networks of information, contacts and resources [20]. The first version of Topolor [17], launched in Nov 2012, was used as an online learning environment for MSc level students at two universities. It has been evaluated from various perspectives [15, 19]. Based on the evaluation results, the second version Topolor has been developed, as the environment where we added and evaluated the proposed multifaceted OSLM. This section only presents those features related to multifaceted OLSM. The backbone of Topolor is a hybrid network connecting learning contents and learners. Learning contents are organised in a classic course-topic-resource structure: a course consists of a set of tree-structured topics; a topic contains one or more resources, and could be shared by different courses. A learner can, e.g., register to a course, learn a topic, and share a resource. The multifaceted OLSM are seamlessly integrated at all granularity levels of learning content pages (Fig. 2) beside learners’ profile pages (Fig. 1).
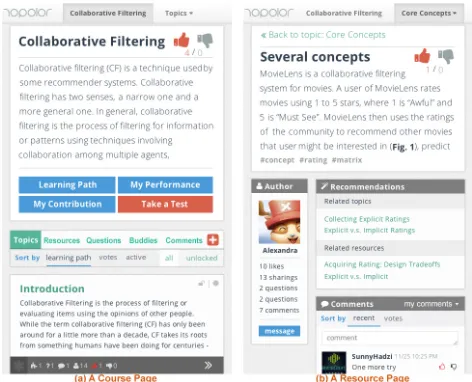
Fig. 1 shows a learner’s profile page presenting her model. In the ‘about’ tab there are lists about her learning status, e.g., topics learnt, questions asked and answered. By clicking on the button ‘PK.’ she can compare her learner model to the profile owner’s learner model. In Fig. 2, (1) and (2) illustrate a course page and a resource page, respectively. Learner models can be visualised in pop-up views by clicking buttons such as “Learning Path” and “My Performance” (see section 4 for details).
Fig. 2. User interface on smart phone: (a) a course page; (b) a resource page.
4 Multifaceted Open Social Learner Modelling
We call the OSLM in Topolor ‘multifaceted’, because, firstly, a learner can access her model and her peers’ models ubiquitously, and Topolor adapts the visualisations to fit
various contexts, corresponding to the hierarchy course pages, topic pages, resource pages and profile pages. Additionally, it provides various visualisation modes, e.g., comparison between individuals, to all other learners, etc. These modes of multi-context and multi-cohort comparisons require enhancements of both adaptivity and adaptability, and are expected to further promote metacognitive activities. Unlike existing systems providing a single complex view of OSLM with many criteria to manually select in order to adjust visualisations, We propose to adapt appropriate views of visualisations automatically, to potentially improve the system’s usability; and to visualise both learners’ performance and contribution, reflecting learners’ roles as both knowledge consumers and producers; specific features are shown below.
4.1 Visualisation of performance
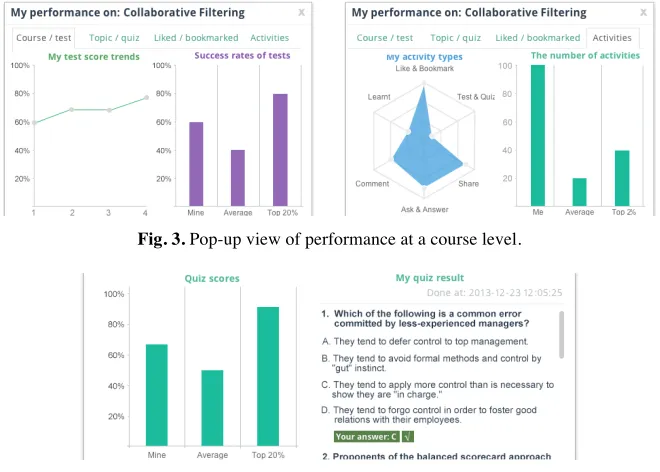
of a timeline by presenting, e.g., test score trends, and the importance of comparisons, e.g., via the comparison of success rate in test between learners. On a course page (see Fig. 1 (a)) or a topic page, by clicking on the button ‘My Performance’, a pop-up view shows a learner’s performance on the current course or topic. Fig. 3 demonstrates the pop-up view on performance of a course page. The default view contains the test score trends and the comparison of success rates of tests (Fig. 3 left). For brevity not all tabs are shown here, but in short: the tab-view ‘Topic / quiz’ shows a two column charts presenting the comparisons of the average quiz score between a learner, the whole class and the top 20% learners. The tab-view ‘Liked / bookmarked’ shows a two column charts presenting how many times the shared resources were ‘liked’ / bookmarked. The tab-view ‘Activities’ shows a radar chart and a column chart comparing activities (Fig. 3 right). Fig. 4 illustrates the respective pop-up view of performance in a topic page, showing on the left the comparison of quiz scores, and on the right, the learner’s corrected quiz answers.
[image:6.595.133.463.320.556.2][image:6.595.136.465.321.434.2]
Fig. 3. Pop-up view of performance at a course level.
Fig. 4. Pop-up view of performance at a topic level.
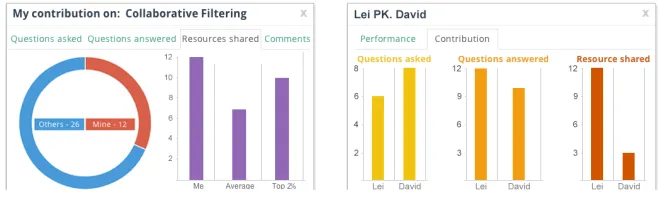
4.2 Visualisation of contribution
[image:7.595.132.463.147.247.2]
Fig. 5. Pop-up view of contribution, compared to others.
Fig. 6. The PK. mode: one-to-one comparison of contribution of two learners.
4.3 The PK. mode
The PK. mode is designed drawing from educational gamification [18], as an acronym for ‘Player Killer’. On a profile page (Fig. 1), by clicking on the button ‘PK.’, a pop-up view shows, presenting comparisons of performance and contribution
between a learner and the profile page’s owner (Fig. 6). Contributions are questions asked and answered, resources, comments shared. Performances include correct tests, topic completion rate, the number of shared (‘liked’ and bookmarked) resources.
4.4 Visualisation of learning path
On a course page or a topic page (see (1) and (2) in Fig. 1), by clicking on the button ‘Learning Path’, a learning path visualisation view pops-up, as shown in Fig. 7. The tree structure graph represents the whole course structure, and the icons represent the learner’s progress. For instance, a hollow circle means the learner has not learnt this topic yet; a solid circle means the learner has already learnt this topic; an unlocked lock means the learner is ready to learn this topic; a locked lock means the learner should finish learning all the prerequisite topics before start to learn this topic; and the
[image:7.595.167.429.547.640.2]blue-coloured-background label with the text ‘Up next’ recommends the learner that this topic is the most appropriate topic to learn for the next step.
4.5 Visualisation of activities
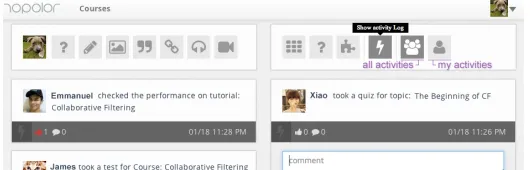
Topolor exposes learners’ activity logs to learners, and they can ‘like’ and comment on each other’s activity logs. This feature is designed based on our hypothesis that
[image:8.595.166.431.270.355.2]observation of activity logs of a learner and her peers’ can stimulate interactions, hereby improve the system’s engagement. There are two ways of viewing learners’ activity logs. One is on the Topolor home page, as shown in Fig. 8, where a learner can filter to view her own activity logs or to view all learners’ activity logs; the other is on a profile page (see Fig. 1) by clicking on the button ‘Activities’, where a learner can view the profile owner’s activity logs, to allow various paths to information.
Fig. 8. List of activity logs on the Topolor home page
5 Experimental Study
To investigate students’ benefits from Topolor’s new features designed based on the multifaceted OSLM, we have started the evaluations from various perspectives such as how and how much these features support and improve learning outcomes by analysing learning behaviour data logged in the database. In this section, to isolate research variables, we focus on students’ perceived acceptance of these features. Student perception of technologies is among the determining factors for successful e-learning environments. The technology acceptance model (ATM) [5], incorporating students’ perception on the technology’s usefulness and ease of use has the ability to investigate their intention to use a system as a result of a group of perceived qualities, hence interpreting students’ desired outcomes. Following ATM, this section reports on the results of perceived usefulness and ease of use of these new features.
The experiment involved 15 students registered for an MSc module ‘Dynamic Web-Based Systems’, at University of Warwick, learning a lesson on ‘Collaborative Filtering’ using Topolor, and familiarizing themselves with the multifaceted OSLM
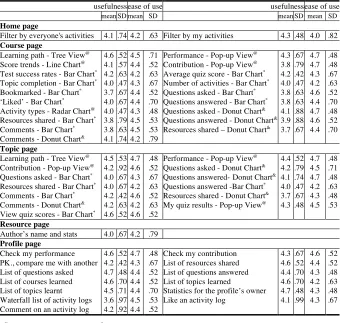
Table 1 compresses these 48 features with the evaluation results including the mean values and standard deviations for their usefulness and ease of use respectively.
Table 1. Theevaluated multifaceted OSLM-related features and the evaluation results.
usefulness ease of use usefulness ease of use mean SD mean SD mean SD mean SD
Home page
Filter by everyone's activities 4.1 .74 4.2 .63 Filter by my activities 4.3 .48 4.0 .82
Course page
Learning path - Tree View@ 4.6 .52 4.5 .71 Performance - Pop-up View@ 4.3 .67 4.7 .48
Score trends - Line Chart@ 4.1 .57 4.4 .52 Contribution - Pop-up View@ 3.8 .79 4.7 .48
Test success rates - Bar Chart* 4.2 .63 4.2 .63 Average quiz score - Bar Chart* 4.2 .42 4.3 .67
Topic completion - Bar Chart* 4.0 .47 4.3 .67 Number of activities - Bar Chart* 4.0 .47 4.2 .63
Bookmarked - Bar Chart*
3.7 .67 4.4 .52 Questions asked - Bar Chart*
3.8 .63 4.6 .52 ‘Liked’ - Bar Chart*
4.0 .67 4.4 .70 Questions answered - Bar Chart*
3.8 .63 4.4 .70 Activity types - Radar Chart@
4.0 .47 4.3 .48 Questions asked - Donut Chart&
4.1 .88 4.7 .48 Resources shared - Bar Chart* 3.8 .79 4.5 .53 Questions answered - Donut Chart& 3.9 .88 4.6 .52
Comments - Bar Chart* 3.8 .63 4.5 .53 Resources shared – Donut Chart& 3.7 .67 4.4 .70
Comments - Donut Chart& 4.1 .74 4.2 .79
Topic page
Learning path - Tree View@
4.5 .53 4.7 .48 Performance - Pop-up View@
4.4 .52 4.7 .48 Contribution - Pop-up View@
4.2 .92 4.6 .52 Questions asked - Donut Chart&
4.2 .79 4.5 .71 Questions asked - Bar Chart*
4.0 .67 4.3 .67 Questions answered-Donut Chart&
4.1 .74 4.7 .48 Resources shared - Bar Chart*
4.0 .67 4.2 .63 Questions answered -Bar Chart*
4.0 .47 4.2 .63 Comments - Bar Chart* 4.2 .42 4.6 .52 Resources shared - Donut Chart& 3.7 .67 4.3 .48
Comments - Donut Chart& 4.2 .63 4.2 .63 My quiz results - Pop-up View@ 4.3 .48 4.5 .53
View quiz scores - Bar Chart* 4.6 .52 4.6 .52
Resource page
Author’s name and stats 4.0 .67 4.2 .79
Profile page
Check my performance 4.6 .52 4.7 .48 Check my contribution 4.3 .67 4.6 .52 PK., compare me with another 4.2 .42 4.3 .67 List of resources shared 4.6 .52 4.4 .52 List of questions asked 4.7 .48 4.4 .52 List of questions answered 4.4 .70 4.3 .48 List of courses learned 4.6 .70 4.4 .52 List of topics learned 4.6 .70 4.2 .63 List of topics learnt 4.5 .71 4.4 .70 Statistics for the profile’s owner 4.7 .48 4.3 .48 Waterfall list of activity logs 3.6 .97 4.5 .53 Like an activity log 4.1 .99 4.3 .67 Comment on an activity log 4.2 .92 4.4 .52
@: my data; &: comparison between me and the rest of the class; *: comparison between me, the whole class and the top 20% of the class.
As shown in Table 1, the mean values of the perceived usefulness of these features rank between 3.6 and 4.7, with standard deviations between 0.42 and 0.99. All the reported mean values are larger than 3 (the neutral response), suggesting students’ attitudes to be generally positive. Table 2 also shows that the mean values of the perceived ease of use of these features rank between 4.0 and 4.7, and the standard deviations are between 0.48 and 0.82. As all these mean values are greater than 3, we infer most students found these features to be relatively easy to use.
Cronbach’s alpha is adopted to measure the reliability of the test. A Cronbach’s Alpha of 0.8 is considered as highly reliable [4]. The Cronbach’s Alpha value of
6 Discussion and Conclusion
We introduced a multifaceted open social learner model (OSLM), and populated it with features. The multifaceted OSLM visualises not only learners’ performance but also their contribution to a learning community, potentially better catering for social e-learning, where learners are both knowledge consumer and producer. Additionally, the multifaceted OSLM provides various comparison modes that allow for visualising the differences between learners’ learning history (e.g., in terms of test score trends), between her and another learner, and between her and a group (i.e., the whole class and the top 20% of the class). Moreover, the multifaceted OSLM is integrated and adapted to learning contents, so that its ubiquity and context-awareness could enhance any system's adaptivity and adaptability, which potentially improves usability.
We also reported on an experimental study and the evaluation, which illustrates a generally high level of learner acceptance of our proposed multifaceted OSLM
features. This result may appear possibly counter-intuitive, due to the high number of features introduced, which may seem complex to a learner. In fact, in our previous study [16], we have found that using a Facebook-like appearance, and a game-inspired paradigm, quickly transforms learners into system experts. The main study limitation is the low number of participants, although Cronbach’s Alpha suggests a high level of reliability of the results. Moreover, Topolor has been opened to public (www.topolor.com), with larger learner cohorts expected in the near future, allowing for feedback, use data and suggestions collecting, in further studies. Other evaluation perspectives are on our agenda, e.g., if learners feel in control in interactions with
multifaceted OSLM; if and how multifaceted OSLM leads learners to access recommended learning contents and to communicate with others, if and to what extent it promotes metacognition and makes Topolor more engaging.
It is noteworthy that, apart from the focus of this paper, i.e., the social interaction and visualisation parts, the proposed multifaceted OSLM also maintains attributes that record learning status such as “know”, “unknown” and “learning”, which inherit in traditional user modelling approach in adaptive educational hypermedia area. Besides, though the visualisation of comparisons between a learner and her learning group e.g. top 20% learners of the class hides other learners’ personal data, in a “PK.” mode it may raise ethic issues in all learners being able to view each other’s data. Therefore, further studies are needed to solve this issue, e.g., by introducing privacy management mechanisms to allow learners to expose data to different groups in different ways.
Other suggests on future works include: (1) metacognitive activity visualisation to promote self-reflection, self-direction and transparency; (2) adaptive visualisation-modes to provide personalised visualisation of the same data.
References
2. Bull, S., Gardner, P.: Highlighting Learning Across a Degree with an Independent Open Learner Model. Proceedings of the 2009 Conference on Artificial Intelligence in Education: Building Learning Systems That Care: From Knowledge Representation to Affective Modelling. pp. 275–282 IOS Press, Amsterdam, The Netherlands (2009).
3. Bull, S., Kay, J.: Open Learner Models as Drivers for Metacognitive Processes. In: Azevedo, R. and Aleven, V. (eds.) International Handbook of Metacognition and Learning Technologies. pp. 349–365 Springer New York (2013).
4. Carmines, E.G., Zeller, R.A.: Reliability and validity assessment. Sage (1979).
5. Davis, F.D.: Perceived usefulness, perceived ease of use, and user acceptance of information technology. MIS Q. 319–340 (1989).
6. Dimitrova, V.: STyLE-OLM: Interactive open learner modelling. Int. J. Artif. Intell. Educ. 13, 1, 35–78 (2003).
7. Downes, S.: Connectivism and connective knowledge: Essays on meaning and learning networks. National Research Council Canada (2012).
8. Hsiao, I.-H. et al.: Open Social Student Modeling: Visualizing Student Models with Parallel IntrospectiveViews. In: Konstan, J. et al. (eds.) User Modeling, Adaption and Personalization. pp. 171–182 Springer Berlin Heidelberg (2011).
9. Kay, J.: Stereotypes, Student Models and Scrutability. In: Gauthier, G. et al. (eds.) Intelligent Tutoring Systems. pp. 19–30 Springer Berlin Heidelberg (2000).
10. Kop, R.: The challenges to connectivist learning on open online networks: Learning experiences during a massive open online course. Int. Rev. Res. Open Distance Learn. 12, 3, 19–38 (2011).
11. Kurilovas, E. et al.: Web 3.0–Based personalisation of learning objects in virtual learning environments. Comput. Hum. Behav. 30, 654–662 (2014).
12. Liang, M. et al.: Collaborative e-learning through open social student modeling and Progressive Zoom navigation. Collaborative Computing: Networking, Applications and Worksharing, 2012 8th International Conference on. pp. 252–261 (2012).
13. Long, Y., Aleven, V.: Supporting students’ self-regulated learning with an open learner model in a linear equation tutor. Artificial Intelligence in Education. pp. 219–228 (2013). 14. Shi, L. et al.: A social personalized adaptive e-learning environment: a case study in
Topolor. IADIS Int. J. WWWInternet. 11, 2, (2013).
15. Shi, L. et al.: Evaluating System Functionality in Social Personalized Adaptive E-Learning Systems. In: Hernández-Leo, D. et al. (eds.) Scaling up Learning for Sustained Impact. pp. 633–634 Springer Berlin Heidelberg (2013).
16. Shi, L. et al.: Social e-learning in topolor: a case study. Proceedings of the 7th IADIS Conference e-Learning 2013. pp. 57–64 IADIS Press, Prague, Czech Republic (2013). 17. Shi, L. et al.: Social Personalized Adaptive E-Learning Environment: Topolor -
Implementation and Evaluation. In: Lane, H.C. et al. (eds.) Artificial Intelligence in Education. pp. 708–711 Springer Berlin Heidelberg (2013).
18. Shi, L. et al.: To build light gamification upon social interactions: requirement analysis for the next version of Topolor. Proceedings of the 6th York Doctoral Symposium on Computer Science and Electronics. (2013).
19. Shi, L. et al.: Towards Understanding Learning Behavior Patterns in Social Adaptive Personalized E-Learning Systems. Proceedings of The 19th Americas Conference on Information Systems. pp. 1–10 Association for Information Systems, Chicago, Illinois, USA (2013).
20. Siemens, G.: What is the unique idea in Connectivism. Connect. Blog - Httpconnectivismcacgi-Binmtmt-Tbcgi112. (2008).
21. Tschofen, C., Mackness, J.: Connectivism and dimensions of individual experience. Int. Rev. Res. Open Distance Learn. 13, 1, 124–143 (2012).