Introduction
Protein and glycoprotein biomarkers in tissue
diagnosis and treatment of varied human
can-cers rely on the use of formalin-fixed and
paraf-fin embedded (FFPE) tissue based
immunohis-tochemistry. There are known drawbacks to the
formalin-fixed tissue based
immunohistochemi-cal method including tissue fixatives [1], length
of fixation, age of fixed tissues [2] and slides
before staining, antigen loss, technical issues of
antigen retrieval, antibody types and manual
scoring of the stain, varied cut-off values and
false positives [3]. The introduction of the
high-throughput method of tissue microarrays [4],
and its use in validating other methods for
can-cer biomarker selection has also spurred the
need for automated image analysis and
quanti-tation methods for scoring of stains [5-9].
Tis-sue microarrays can be used to validate cDNA
microarray profiling findings [10] but the
immu-nohistochemical data may need to be as
rigor-ously processed or normalized [11] as for other
high-throughput data sets. For example, a
meta-analysis of melanoma biomarkers showed a
wide variation of cut-off points for the
expres-sion of multiple markers and their utility in
de-termining survival [12] which creates some
diffi-culty in comparing outcome analysis.
Further-more markers to differentiate pulmonary from
breast cancer used 7 antibodies but did not
normalize the intensity scores before data
analysis [13]. Other high-throughput methods
such as oligonucleotide (DNA) microarrays [14],
quantitative real-time polymerase chain
reac-tion (qTR-PCR) and quantitative proteomics [15]
and array comparative genomics (CGH) ([16])
that have data standards and methods of
analy-sis including normalization [17]. Efforts to
stan-dardize immunohistochemical data sets are
Original Article
Quantitative analysis of p53 expression in human normal
and cancer tissue microarray with global normalization
method
Halliday A Idikio
Department of Pathology and Laboratory Medicine, University of Alberta, Edmonton, ALBERTA T6G 2B7, Canada.
Received February 21, 2011; accepted June 12, 2011; Epub June 15, 2011; published June 20, 2011
Abstract: Tissue microarray based immunohistochemical staining and proteomics are important tools to create and validate clinically relevant cancer biomarkers. Immunohistochemical stains using formalin-fixed tissue microarray sections for protein expression are scored manually and semi-quantitatively. Digital image analysis methods remove some of the drawbacks of manual scoring but may need other methods such as normalization to provide across the board utility. In the present study, quantitative proteomics-based global normalization method was used to evaluate its utility in the analysis of p53 protein expression in mixed human normal and cancer tissue microarray. Global nor-malization used the mean or median of β-actin to calculate ratios of individual core stain intensities, then log trans-formed the ratios, calculate a mean or median and subtracted the value from the log of ratios. In the absence of global normalization of p53 protein expression, 44% (42 of 95) of tissue cores were positive using the median of intensity values and 40% (38 of 95) using the mean of intensities as cut-off points. With global normalization, p53 positive cores changed to 20% (19 of 95) when using median of intensities and 15.8%(15 of 95) when the mean of intensities were used. In conclusion, the global normalization method helped to define positive p53 staining in the tissue microarray set used. The method used helped to define clear cut-off points and confirmed all negatively stained tissue cores. Such normalization methods should help to better define clinically useful biomarkers.
proposed (MISFISHIE), but as yet do not
em-brace normalization standards. The recent
con-sensus draft from the Food and Drug
Admini-stration (FDA) group defines biomarkers as
“objectively measured and evaluated” marker
for disease detection, classification, predictive
and for treatment outcome and the need for
comparable analytical protocols and validation
[18].
Normalization in high throughput (TMA)
immu-nohistochemical studies can accommodate the
technical aspects of immunohistochemical
staining, image acquisition, antibody types and
dilution, temporal changes in protein content in
cells, and variations in protocols. Normalization
is important in data sets derived from protein or
antibody microarrays to accommodate the many
variables from platform, slide to slide variables
[19]. Liquid chromatography/mass
spectrome-try (LC-MS) data requires normalization
meth-ods to reduce false positives [20].
Normaliza-tion of data in western blotting and qRT-PCR
use endogenous reference genes and proteins,
such as
β
-actin, as controls to define relative
expression levels of target genes or proteins
[21] and is centered on their relative stability in
the cell and their functional needs. There are
many endogenous controls and arguments
abound as to which and when to use [22].
The objective of the study was to test a
pro-teomics data normalization method on the
ex-pression of p53 obtained by digital image
analy-sis [23]. Digital image analyanaly-sis method was
pre-ferred so that similar measurement criteria
were used for all samples. The p53 oncoprotein
was chosen for its functions as tumor
suppres-sor, transcription factors and its myriad
interac-tions with other proteins; p53 is also mutated in
many cancers, touted as a biomarker for
diag-nosis of cancer and target for use in therapy
[24, 25]. This means that its expression in both
normal, proliferating and cancer tissues is
de-pendent on the level of stress in the cell and
hence subject to more variations and more
dy-namic [26]. The p53 protein expression in
breast cancer was concordant with its mutation
status [27]. The protein p53 interacts with cell
death and survival proteins in the cytoplasm
including autophagy proteins [28], responds to
endoplasmic reticulum stress, and thus not
ex-clusive to the nucleus in function [29].
In this study, the global normalization (central
tendency) method was used in the analysis of
p53 expression staining in human normal and
cancer tissue microarrays (TMAs). The
immu-nostaining for
β
-actin in a similar TMA set was
used as the endogenous control and for
calcu-lating the p53 to
β
-actin ratios before applying
normalization method. The number of p53
posi-tive tissue cores changed from 44% (42 of 95)
to 20% (19 of 95; using median intensities for
all calculations) and 15.8% (15 of 95; using
mean intensities for calculations). This also
af-fected sensitivities, specificities, positive and
negative likelihood for p53. The introduction of
similar methods in studies aiming to validate or
create new biomarkers may help adoption of
markers for clinical and diagnostic use.
Materials and methods
Antibodies
The antibodies for the study were (a) p53 rabbit
monoclonal antibody #1026-1 from Epitomics
Inc (b).
β
-Actin, rabbit monoclonal antibody from
Cell Signaling Biotechnology-New England
Bio-labs Inc #4970. Antibodies were used as
sug-gested by the manufacturers and used at
dilu-tion of 1/50 after optimizadilu-tion.
Tissue microarrays (TMAs)
The MUT951 9x12 (96 cores) normal and
can-cer array from Pantomics Inc (California, USA).
The cores are derived from separate sources
and are treated as individual cases and not as
duplicates or quadruplicates from a single
source.
Immunohistochemistry
All immunohistochemical stains were carried
out on the Ventana Discovery XT (Ventanna AZ
USA) using the DAB Map protocol and included
standard depaffinization, blocking endogenous
peroxidase and biotin, incubation with primary
and secondary antibodies and development
with DAB (di-aminobenzidine). The tissue arrays
were stored at 4C and heated to 60C for 1hour
before use. The slides were counterstained
with hematoxylin.
Scanning of TMA cores and quantitative
immu-nohistochemical analysis
stored in a separate folder as tiff files.
The tissue microarray cores were individually
analyzed using the NIH Image J (v1.42) plug-in
deconvolTMA (and its dependent G. Landini’s
Color Deconvolution v1.3 [30, 31]. The cores
were stored in separate folders for p53 and
b-actin. The steps involved annotation and
markup of individual cores, and analysis of
indi-vidual core tissues. The data sets obtained
in-cluded tissue area, brown area, brown ID,
mean, standard deviation (sd), and median of
intensities for each tissue core. The mean and
median for median or mean intensities for the
set were used as cut-off for positive stain
with-out ratio. The mean or median of mean and
median intensities of
β
-actin was used for
nor-malizing the mean of individual cores and then
calculating the mean ratio for cut-off.
Global normalization
The normalization method adopted was
previ-ously used for quanitative proteomics and
ap-peared simple and easy to use [23]. The ratios
obtained by dividing
β
-actin mean or median
intensities were log transformed, then a mean
or median calculated and then subtracted from
individual log ratio values; only values above 0
were used as positive for p53.
Statistical analysis
Statistical analyses for all data were performed
using Gretl (v1.8).
Results
The mean of the median intensity values for
β
-actin was 16.78 and the mean of the mean
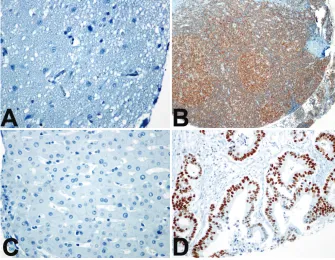
val-ues was 18.4. Figure 1 (A-D) illustrates the
negative and positive tissue cores for p53 and
β
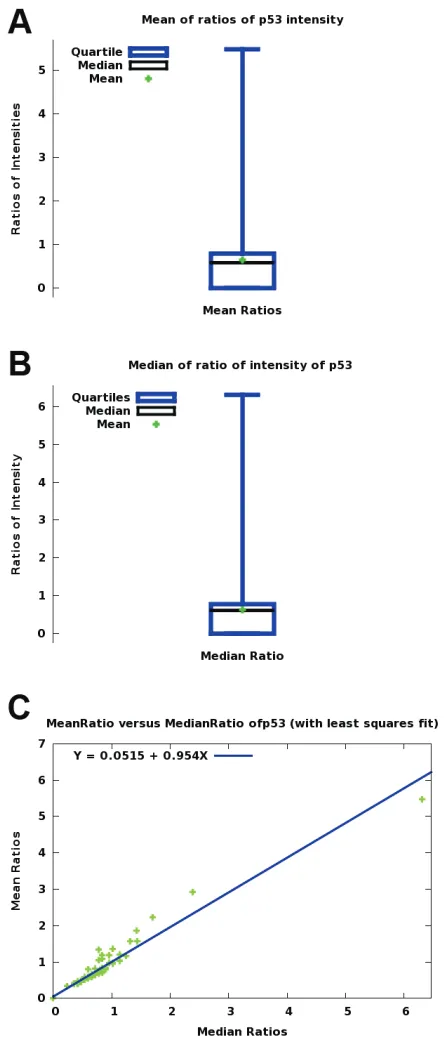
-actin. Figure 2 (A, B, C) shows comparison of
median and mean intensities and scatter plots
of mean and median (ratios) intensities.
The data for MUT951 TMA are shown Tables 1
(A, B, C. D). In using the median intensity values
for calculating ratios and applying global
nor-malization, the total number of p53 positive
tissue cores changed from 42 of 95 when no
ratio and normalization was used (44%) to 19 of
95 (20%) after global normalization. In addition,
using the mean of the ratios alone for cut-off
also reduced the number of p53 positive cores
(35 0f 95, 37%).
[image:3.612.80.415.83.343.2]When the calculations of ratios, log
transforma-tions and global normalization were based on
the mean of the mean intensities, 15 of 95
(15.8%) tissue cores were positive for p53 after
global normalization.
Discussion
In this study using human mixed normal and
cancer tissue microarrays, the introduction of a
global normalization method removed false
positives. The ratio method alone also
con-firmed all negatives in normal tissues. The ratio
method alone could be deemed suitable for
manual or semiquantitative scoring [32-37] and
could improve clinical utility of biomarkers. As
shown in this study, the ratio method is still not
adequate to remove false positives. The
re-moval of positive status in the majority of
nor-mal and benign tumor tissues means that
ex-cessive p53 in benign or normal tissues should
alert one to other possibilities such as
muta-tions in closely related gene networks or in p53
itself [24, 38].
[image:4.612.78.302.84.606.2]The digital image acquisition and analysis also
suffers from use of different algorithms from
different manufacturers [39] and some other
method of normalization will be necessary to
compare results from different algorithms.
Fur-thermore, there is a growing interest and use of
different methods of image processing and
analysis for dia-aminobenzidine-based (DAB)
immunohistochemical staining such as spectral
imaging and analysis [40], color deconvolution
[30, 31, 41], Hue-Saturation-Intensity [42],
nor-malized RGB [43] and CMYK [44].The ability to
create meaningful predictive and prognostic
markers is not enhanced by observer variations
in scoring and variations in scoring systems [45,
46]. In a study comparing five different
meth-ods for DAB-immunohistochemistry stained
tis-sues [43], there were differences in
classifica-tion errors. These dilemmas may be reduced by
use of appropriate proteomic normalization
methods.
The use of ratio and normalization method is
necessary for estimating the amplification of
Her-2 determined by fluorescent-insitu
hybridi-zation (FISH [47]. Furthermore TMA are used in
validation of other high-throughput methods [48
-50] and correlates well with conventional slide
immunohistochemical staining [51]. So that
should enable introduction of simple and easily
applicable normalization methods in IHC–based
tissue microarray studies.
The use of p53 for diagnosis of cancer and
bio-marker of cancer progression [52] and as a
Figure 2. Comparison of p53 immunohistochemicaltherapeutic target [53] may need integration of
all methods of gene expression including
vali-dation by immunohistochemistry [17]. The
choice of methods of validation and cut-off
points of relative protein content will be
impor-tant for translating high-throughput data sets
and studies into clinical use [18, 54, 55]. In
addition, methods of determining positive
pro-tein expression should enable correlation with
genomics data as gene expression also reflects
possible structural alterations while protein
con-tent is also subject to protein life-cycle effects,
and gene copy number variations [56, 57].
In the TMA sets used for the study,
β
-actin stain
was not universally present and probably
re-flects the minimum detectable by the method
(unlike Western blotting that detects in
nanograms of protein). This variable expression
of
β
-actin in its use as endogenous control,
though similar variabilities are noted with
en-dogenous control ([58]) can be redeemed by
using more than one endogenous control. In
normalizing western blotting of proteins such as
p53 and estrogen receptor-
β
, both tubulin and
β
-actin are used as both are reliable
house-keeping genes [59, 60].
[image:5.612.79.532.432.493.2]The use of global normalization method could
make high-throughput TMA studies better
un-derstood for clinical use and improve
agree-ments between studies.
Table 1. Quantitative Analysis of p53 staining in MUT951 TMA Comparing Non-ratio and Ratio Plus Global
Normalization. Sensitivity, specificity, likelihood of positive and negative tests using p53 to separate
can-cer from non-cancan-cer tissue cores were as follows Sensitivity=52%, Specificity=68%, LR positive=1.6, LR
negative=0.71.
(A) p53 (No ratio and using the mean of median values as cut-off;mean=10.344)
Tissue Type Negative (%) Positive (%) Total
Normal (23) 18 (78.3%) 5(21.7%) 23
Cancer (60) 29 (48.3%) 31 (51.7%) 60
Adenomas/Meningioma (12) 6 (50%) 6 (50%) 12
(B) p53 Ratio and Global Normalization( using positive values after subtraction of the mean of log of ratios). Sensi-tivity=28%, Specificity=94%, LR positive=4.7. LR negative=0.06
Tissue Type Negative (%) Positive (%) Total
Normal (23) 22 (94.5%) 1(4.5%) 23
Cancer (60) 43 (71.7%) 17(28.3%) 60
Adenoma/Meningiomas(12) 11(91.7%) 1 (8.3%) 12
(C) p53 staining analysis using mean of the mean intensities for ratio and global normalization ( mean of mean intensities=11.68
Tissue Type Positive Negative Total
Normal (23) 4 (17%) 19 (83%) 23
Cancer (60) 31(52%) 29 (48%) 60
Adenoma (12) 3 (25%) 9 (75%) 12
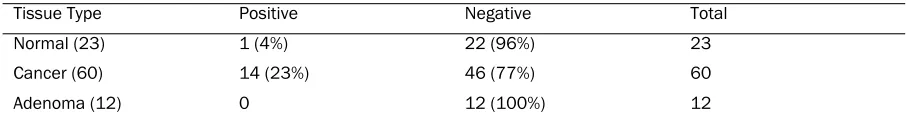
(D) p53 staining status after global normalization using mean of the mean intensities(mean of log ratios = -0.30085)
Tissue Type Positive Negative Total
Normal (23) 1 (4%) 22 (96%) 23
Cancer (60) 14 (23%) 46 (77%) 60
Acknowledgement
I am thankful for the help from R. Stokes B.Sc.,
RMLT, Immunohistochemistry Section, Division
of Anatomical Pathology, Department of
Pathol-ogy and Laboratory Medicine, Walter McKenzie
Health Sciences Center/University of Alberta
Hospital.
Please address correspondence to: Halliday Idikio, MD, University of Alberta, Department of Pathology and Laboratory Medicine, 5B4.11 Walter MacKenzie Health Sciences Center, 8440-112 th Street, Edmon-ton, ALBERTA T6G 2B7, Canada. Tel: 1-780-407-7271; Fax 1-780-407-3009, E-mail: [email protected]
References
[1] Nassiri M, Ramos S, Zohourian H, Vincek V, Morales A and Nadji M. Preservation of bio-molecules in breast cancer tissue by a formalin-free histology system. BMC Clinical Pathology 2008; 8: 1.
[2] Wester K, Wahlund E, Sundstrom C, Ranefall P, bengtsson E, Russell P, Ow K, Malmstrom P-U and Busch C. Parrafin Section Storage and Immunohistochemistry. Applied Immunohisto-chemistry and Molecular Morphology 2000; 8: 61-70.
[3] Bast R, Lilja H, Urban N, Rimm D, Fritsche H, Gray J, Veltri R, Klee G, Allen A, Kim N, Gutman S, Rubin M and Hruszkewycz A. Translational Crossroads for Biomarkers. Clin Cancer Res 2005; 11: 6103-6108.
[4] Kononen J, Bubendorf L, Kallioniemi A, Barlund M, Schrami P, Leighton S, Torhorst J, Mihatsch M, Sauter G and Kallioniemi O. Tissue microar-rays for high-throughput molecular profiling of tumor specimens. Nature Medicine 1998; 4: 844-847.
[5] Rimm D. What brown cannot do for you. Nature Biotechnology 2006; 24: 914-916.
[6] Rubin M, Zerkowski M, Camp R, Kuefer R, Hofer M, Chinnaiyan A and Rimm D. Quantita-tive Determination of Expression of the Pros-tate Cancer Protein alpha-methylacyl-CoA Race-mase Using Automated Quantitative Analysis (AQUA). Am J Pathol 2004; 164: 831-840. [7] Divito K and Camp R. Tissue
microarrays-automated analysis and future directions. Breast Cancer Online 2005; 8:
[8] Cregger M, Berger A and Rimm D. Immunohis-tochemistry and Quantitative Analysis of Pro-tein Expression. Archives of Pathology and Laboratory Medicine 2006; 130: 1026-1030. [9] McCabe A, Dolled-Filhart M, Camp R and Rimm
D. Automated Quantitative Analysis (AQUA) of In situ Protein Expression, Antibody Concentra-tion, and Prognosis. Journal of the National
Cancer Institute 2005; 97: 1808-1815. [10] Pollack J. A Perspective on DNA Microarrays in
Pathology Research and Practice. Am J Pathol 2007; 171: 375-385.
[11] Mecham B, Nelson P and Storey J. Supervised normalization of microarrays. Bioinformatics 2010; 26: 1308-1315.
[12] Rothberg B, Bracken M and Rimm D. Tissue Biomarkers for Prognosis in Cutaneous Mela-noma: A Systematic Review and Meta-analysis. J Natl Cancer Inst 2009; 101: 452-474. [13] Yang M and Nonaka D. A study of
immunohisto-chemical differential expression in pulmonary and mammary carcinomas. Modern Pathology 2010; 23: 654-661.
[14] Lim W, Wang K, lefebvre C and Califano A. Com-parative analysis of microarray normalization procedures: effects on reverse engineering gene networks. Bioinformatics 2007; 23: 1282-1288.
[15] Panchaud A, Affolter M, Moreillon P and Kuss-mann M. Experimental and computational ap-proaches to quantitative proteomics: Status quo and outlook. Journal of Proteomics 2008; 71: 19-33.
[16] van Houte B, Binsl T, Hettling H and Heringa J. CGHnormaliter: a Bioconductor package for normalization of array CGH data with many CNAs. Bioinformatics 2010; 26: 1366-1367. [17] Mathew J, Taylor B, Bader G, Pyarajan S,
Anto-niotti M, Chinnaiyan AM, Sander C, Burakoff S and Mishra B. From Bytes to Bedside: Data Intergration and Computational Biology for Translational Cancer Research. Plos Computa-tional Biology 2007; 3: e12.
[18] Khleif S, Doroshow J and Halt W, for the FDA-NCI Cancer Biomarker Collaborative. AACR-FDA-NCI CANCER Biomarkers Collaborative Consensus Report: Advancing the Use of Bio-markers in Cancer Drug Development. Clinical Cancer Research 2010; 16: 3299-3318. [19] Perlee L, Christiansen J, Dondero R, Grimwade
B, Lejnine S, Mullenix M, Shao W, Sorrette M, Tchernev V, Patel D and Kingsmore S. Develop-ment and standardization of multiplexed anti-body microarrays for use in quantitative pro-teomics. Proteome Science 2004; 2: 9. [20] Katajamaa M and Orešič M. Processing
meth-ods for differential analysis of LC/MS profile data. BMC Bioinformatics 2005; 6: 179. [21] de Kok J, Roelofs R, Giesendorf B, Pennings J,
Waas E, Feuth T, Swinkles D and Span P. Nor-malization of gene expression measurements in tumor tissues: comparison of 13 endoge-nous control genes. Laboratory Investigation 2005; 85: 154-159.
[23] Callister S, Barry R, Adkins J, Johnson E, Qian W, Bobbie-Jo M, Smith R and Lipton M. Nor-malization Approaches for Removing System-atic Biases Associated with Mass Spectometry and Label-Free Proteomics. J Proteome Res 2006; 5: 277-286.
[24] Olivier M, Hollstein M and Hainaut P. TP53 Mutations in Human Cancers: Origins, Conse-quences, and Clinical Use. Cold Spring Harb Perspec Biol 2010; 2: a001008.
[25] Vousden K and Prives C. Blinded by the Light: The Growing Complexity of p53. Cell 2008; 137: 413-431.
[26] Loewer A, Batchelor E, Gaglia G and Lahav G. Basal Dynamics of p53 Reveal Transcriptionally Attenuated Pulses in Cycling Cells. Cell 2010; 142: 89-100.
[27] Miller L, Smeds J, George J, Vega V, Vergara L, Plonet A, Pawitan Y, Hall P, Klaar S, Liu E and Bergh J. An expression signature for p53 status in human breast cancer predicts mutation status, transcriptional effects, and patient sur-vival. PNAS 2005; 102: 13550-13555.
[28] Tasdemir E, Maiuri MC, Galluzzi L, Vitale I, Djavaheri-Mergny M, D'Amelio M, Criollo A, Morselli E, Zhu C, Harper F, Nannmark U, Sam-ara C, Pinton P, Vicencio JM, Carnuccio R, Moll UM, Madeo F, Paterlini-Brechot P, Rizzuto R, Szabadkai G, Pierron G, Blomgren K, Taverna-rakis N, Codogno P, Cecconi F and Kroemer G. Regulation of autophagy by cytoplasmic p53. Nat Cell Biol 2008; 10: 676-687.
[29] Stavridi E and Halazonetis T. p53 and stress in the ER. Genes & Development 2004; 18: 241-244.
[30] Halushka M, Cornish T, Lu J, Selvin S and Selvin E. Creation, validation, and quantitative analysis of protein expression in vascular tissue microarrays. Cardiovascular Pathology 2009; doi:10.1016/j.carpath.2008.1012.1007. [31] Halushka M, Selvin E, Macgregor A and Cornish
T. The use of vascular tissue microarrays for measurement of advanced glycation end prod-ucts. Journal of Histochem and Cytochem 2009; DOI:10.1369/jhc.2009.953273.
[32] Idikio H. Galectin- expression in human breast carcinoma: correlation with cancer histologic grade. International Journal of Cancer 1998; 12: 1287-1290.
[33] Idikio H. Spindle Checkpoint Protein hMad2 and Histone Phosphoserine 10 Mitosis marker i Pediatric Solid Tumors. AntiCancer Research 2006; 26: 4687-4694.
[34] Hussein M. Analysis of Bcl-2 protein expression in choroidal melanomas. J Clinical Pathology 2005; 58: 486-489.
[35] Alonso S, Ortiz P, Pollan M, Perez-Gomez B, Sanchez L, Acuna M, Pajares R, Martinez-Tello F, Hortelano C, Piris M and Rodriguez-Peralto J. Progression in Cutaneous Malignant Melanoma is Associated with Distinct Expression Profiles. Am J Pathol 2004; 164: 193-203.
[36] Korsching E, jeffrey S, Meinerz W, Decker T, Boecker W and Beuger H. Basal carcinoma of the breast revisited: an old entity with new in-terpretations. J Clinical Pathology 2008; 61: 553-560.
[37] Chu I, Hengst L and Slingerland J. The Cdk in-hibitor p27 in human cancer: prognostic poten-tial and relevance to anticancer therapy. Nature Reviews Cancer 2008; 8: 288-298.
[38] Vousden K and Lane D. p53 in health and dis-ease. Nature Reviews Molecular Cell Biology 2007; 8: 275-283.
[39] Camp R, Dolled-Filhart M and Rimm D. X-Tile: A New Bio-Informatics Tool for Biomarker Assess-ment and Outcome-Based Cut-Point Optimiza-tion. Clin Cancer Res 2004; 10: 7252-7259. [40] van der Loos C. Multiple Immunoenzyme
Stain-ing: Methods and Visualizations for the Obser-vation With Spectral Imaging. The Journal of Histochemistry & Cytochemistry 2008; 56: 313-328.
[41] Ruifrok A, Katz R and Johnson D. Comparison of Quantification of Histochemical Staining By Hue-Saturation-Intensity(HSI) Transformation and Color-Deconvolution. Applied Immunohisto-chemistry and Molecular Morphology 2003; 11: 85-91.
[42] Ruifrok A and Johnson D. Quantification of his-tochemical staining by color deconvolution. Anal Quant Cytol Histol 2001; 23: 291-299. [43] Brey E, Lalani Z, Johnston C, Wong M, McIntire
L, Duke P and Patrick Jr C. Automated Selection of DAB-labeled Tissue for Immunohistochemi-cal Quantification. The Journal of Histochemis-try and CytochemisHistochemis-try 2003; 51: 575-584. [44] Pham N-A, Morrison A, Schwock J, Aviel-Ronen
S, Iakolev V, Tsao M-S, Ho J and hedley D. Quantitative image analysis of immunohisto-chemical stains using a CMYK color model. BMC Diagnostic Pathology 2007; 2: 8.
[45] Zlobec I and Lugli A. Prognostic and predictive factors in colorectal cancer. J Clinical Pathology 2008; 61: 561-569.
[46] Kirkegaard T, Edwards J, Tovey S, McGlynn L, Krishna S, Mukherjee R, Tam L, Munro A, Dunne B and bartlett J. Observer variation in immunohistochemical analysis of protein ex-pression, time for a change? Histopathology 2006; 48: 787-794.
[47] Sassen A, Rochon J, Wild P, Hartman A, Hof-staedter F, Schwarz S and brockhoff G. Cytoge-netic analysis of HER1/EGFR, HER2, HER3, and HER4 in 278 breast cancer patients. Breast Cancer Research 2008; 10: R2(doi:10.1186/ bcr1843).
[48] Segal Ep, Friedman N, Kaminski N, Regev A and Koller D. From signature to models: under-standing cancer using microarrays. nature Ge-netics (Sup) 2005; 37: S38-45.
[50] Torhorst J, Bucher C, Kononen J, Haas P, Zuber M, Kochli O, Mross F, Dietrich H, Moch H, Mi-hatsch M, Kallioniemi O and Sauter G. Tissue Microarrays for Rapid Linking of Molecular Changes to Clinical Endpoints. Am J Pathol 2001; 159: 2249-2256.
[51] Boone J, van Hillegersberg R, van Diest P, Offer-haus G, Borel Rinks I and Ten Kate F. Validation of tissue microarray technology in squamous cell carcinoma of the esophagus. Virchows Archives 2008; 452: 507-514.
[52] Gonzalez S, Aubert S, Kerdraon O, Haddad O, Fantoni J-C, Biserte J and Leroy X. Prognostic Value of Combined p53 and Survivin in pT1G3 Urothelial Carcinoma of the Bladder. American J Clinical Pathology 2008; 129: 232-237. [53] Kravchenko J, Ilyinskaya G, Komarov P,
Aga-pova L, Kochetkov D, Strom E, Frolova E, Kov-riga I, Gudkov A, Feinstein E and Chumakov P. Small-molecule RETRA suppresses mutant p53-bearing cancer cells through a p73-dependent salvage pathway. PNAS 2008; 105: 6302-6307.
[54] Chin L and Gray J. Translating insights from the cancer genome into clinical practice. Nature Reviews Cancer 2008; 452: 553-563.
[55] Sawyers C. The cancer biomarker problem. Nature Reviews Cancer 2008; 452: 548-552. [56] Bonifacino J and Weissman A. Ubiquitin And
The Control of Protein Fate In The Secretory And Endocytic Pathways. Ann. Rev. Cell Dev. Biol 1998; 14: 19-57.
[57] Geiger T, Cox J and Mann M. Proteomic Changes Resulting from Gene Copy Number Variations in Cancer Cells. PLoS Genetics 2010; 6: e1001090.
[58] Bustin S. Quantitation of mRNA using real-time reverse transcription PCR(RT-PCR): trends and problems. J molecular Endocrinology 2002; 29: 23-39.
[59] Mak P, Leav I, Pursell B, Bae D, Yang X, Taglienti C, Gouvin L, Sharma V and Mercurio A. ERβ Impedes prostate Cancer EMT by Destabi-lizing HIF-α and Inhibiting VEGF-Mediated Snail Nuclear Localization: Implications for Gleason Grading. Cancer Cell 2010; 17: 319-332. [60] Wang Y, Wade M, Wong E, Li Y-C, Rodewald L