ORIGINAL RESEARCH
Increasing Contrast Agent Concentration Improves
Enhancement in First-Pass CT Perfusion
H.M. Silvennoinen L.M. Hamberg L. Valanne G.J. Hunter
BACKGROUND AND PURPOSE: Our aim was to evaluate whether increasing iodine concentration, at a constant total iodine dose, resulted in better brain tissue opacification in patients with acute stroke symptoms during their evaluation by first-pass CT perfusion (CTP).
MATERIALS AND METHODS: One hundred two patients presenting to the emergency department within 3 hours of onset of acute stroke symptoms underwent CTP scanning. Three different concen-trations of iodinated nonionic contrast material were used (300, 350, or 400 mg/mL). Total iodine dose (15 g) and injection rate (7 mL/s) were kept constant. There were 25, 53, and 19 patients in the different concentration groups, respectively; 5 patients were excluded due to uncorrectable motion artifacts. CTP scanning was performed at the level of the putamen, and data were analyzed by determining peak opacification for normal gray and white matter, arterial input, and venous output. Mean and SD values were calculated, and 3 concentration groups, stratified by region-of-interest location, were compared by using a single-tailed unpairedttest.
RESULTS: Monotonic increasing peak opacification was observed in all region-of-interest locations. Statistically significant differences were observed between the 300 and 350 mg/mL, 300 and 400 mg/mL, as well as the 350 and 400 mg/mL groups (P⬍.01) in white matter, gray matter, and the arterial input. Statistical significance was seen in the venous output group between the 300 and 400 mg/mL (P⬍.005) and 350 and 400 mg/mL (P⬍.007) groups, but not between the 300 and 350 mg/mL (P⫽.2) groups.
CONCLUSION:Increasing contrast concentration improves peak opacification of tissue, suggesting that CTP evaluation of patients with acute stroke is better performed with the highest available concentration contrast agent.
F
irst-pass CT perfusion (CTP) has become an important imaging tool that is used routinely in the triage of patients with acute stroke.1-5This technique uses a cine acquisition of CT images during intravenous injection of contrast material as a short bolus. Functional maps of tissue perfusion are then constructed from the acquired temporal data to visualize blood flow, blood volume, and mean transit time.6,7This cal-culation is a noise-sensitive process,8and better signal-inten-sity enhancement will necessarily result in more robust analy-sis.9Because tissue enhancement at any given time during the passage of contrast through the cerebral vasculature depends on the actual amount of contrast agent in the intravascular space, one approach to improve signal-intensity visibility would be to increase the iodine concentration of the contrast material used. To this end, we aimed to evaluate whether in-creasing contrast agent iodine concentration alone, while keeping the total load of iodine injected constant, resulted in better peak opacification and, thus, enhancement of normal brain tissue in patients with acute stroke symptoms during their evaluation by using first-pass CTP.Materials and Methods
Patients
From November 2002 through September 2005, there were 102 pa-tients with acute stroke symptoms who presented to the emergency department within 3 hours of their ictus and who underwent first-pass CTP imaging. There were 52 men and 50 women, with average ages of 65 and 71 years, respectively. A retrospective analysis of these data was approved by the institutional review body.
First-Pass CTP Protocol
The first-pass CTP protocol was as follows: an 18-gauge cannula was inserted into an antecubital vein for contrast administration and the patient’s head was immobilized by using a head holder and Velcro straps. The patient’s head was then centered in an 8-section CT scan-ner (LightSpeed Ultra 8-detector-row multisection helical scanscan-ner; GE Healthcare, Milwaukee, Wis). First-pass CTP images were ac-quired by using cine mode from four 5-mm sections in the middle cerebral artery territory at the level of the putamen. The technical factors used were head (25 cm) FOV, 80-kVp tube voltage, 200-mA tube current, 1-second rotation time, and the standard reconstruc-tion algorithm. Data acquisireconstruc-tion was initiated 5 seconds after power injection of contrast (EnVision CT injector; Medrad, Indianola, Pa) at a rate of 7 mL/s. Total imaging time was 50 seconds, resulting in 200 1-second images, 50 for each of the 4 section locations.
Contrast Agents
The contrast agent that was actually used for any individual patient was determined by hospital policy in effect at the time of the patient’s CTP scan. From November 2002 through March 2003, 400-mg/mL iomeprol (Iomeron; Bracco, Milan, Italy) was in test use for CTP in all 20 patients with acute stroke. From April 2003 through June 2004, Received August 25, 2006; accepted after revision November 14.
From the Department of Radiology-Neuroradiology (H.M.S., L.V.), Helsinki University Central Hospital, Helsinki, Finland; and the Department of Radiology-Neuroradiology (L.M.H., G.J.H.), Division of Imaging, University of Texas M.D. Anderson Cancer Center, Houston, Tex.
Previously presented at: Annual Meeting of the American Society of Neuroradiology, May 1–5, 2006; San Diego, Calif.
Please address correspondence to Heli Silvennoinen, MD, Helsinki University Central Hospital, Department of Radiology, Haartmaninkatu 4, Helsinki 00290, Finland; e-mail heli.silvennoinen@hus.fi
DOI 10.3174/ajnr.A0574
BRAIN
ORIGINAL
300-mg/mL iohexol (Omnipaque; GE Healthcare, Little Chalfont, Buckinghamshire, UK) was used for CTP in all patients with acute stroke. There were 29 during this time. From July 2004 through Sep-tember 2005, 350-mg/mL iohexol was used for CTP in all patients with acute stroke. In this period, there were 53. Irrespective of the contrast agent used, the total amount of iodine was kept constant at 15 g. Thus, injected volumes were 50, 43, and 38 mL, corresponding to the 3 concentrations, respectively.
Region-of-Interest Analysis
Region-of-interest analysis was used to determine the contrast-con-centration time curve in various tissue structures and to compare the effects of different concentrations on peak opacification. First, the perfusion scans were evaluated with respect to patient motion, and
studies with substantial movement were excluded from the final anal-ysis (Advantage Windows 4.1; GE Healthcare, Milwaukee, Wis). Five patients were excluded in this fashion, leaving 25 patients in the 300-mg/mL group, 53 patients in the 350-300-mg/mL group, and 19 patients in the 400-mg/mL group for retrospective analysis.
[image:2.585.56.537.41.528.2]imaged were included in the gray matter and white matter analysis whenever possible; however, those individual sections with artifact or motion degradation were excluded from the analysis. In each patient, region-of-interest values were analyzed without averaging from dif-ferent sections. Both white matter and gray matter regions of interest were drawn freehand. We standardized the choice of region of interest to the hemisphere contralateral to the region of ischemia or infarc-tion. Our standardized white matter region was anterior to the frontal horn of the lateral ventricle. Our standardized gray matter region was either the putamen or the caudate head. Our first choice was the putamen, but in those sections that did not include the putamen, the caudate head was used instead. Blood vessels and CSF spaces were carefully removed from these analysis regions. The size of the white and gray matter regions of interest was standardized for all patients at approximately 100 and 50 mm2, respectively. The analysis yielded a total of 76, 192, and 51 gray matter samples and 89, 196, and 55 white matter samples in the 300-, 350-, and 400-mg/mL groups, respectively.
The arterial input curve was determined from an anterior cerebral artery (ACA), and the venous output, from the superior sagittal sinus. For the vessel analyses, the sections used were the ones through which the vessel traveled perpendicularly, as is the convention during clini-cal CTP analysis. This permitted us to achieve “pure” blood curves while avoiding partial volume effects from adjacent tissues.
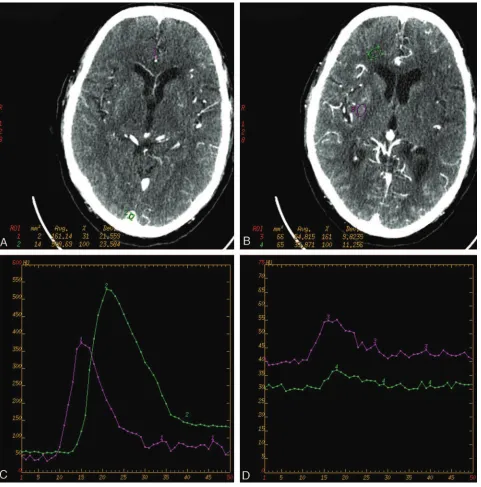
A time-enhancement curve (or delta-HU curve) was constructed for each region of interest (Fig 1C, -D) and fitted with a gamma variate function by using an automated Marquardt-Levenberg nonlinear fit-ting technique to remove the effects of noise and subjectivity from determination of peak opacification. Peak opacification was then cal-culated by using the fitted parameters.
The hypothesis tested was whether the peak opacification at each anatomic location was greater in the higher contrast concentration scans compared with lower concentration scans. Thus, a single-tailed unpairedttest was sufficient and appropriate to answer this question.
Results
We observed a linearly increasing trend in the peak opacifica-tion values in all anatomic locaopacifica-tions: white matter, gray mat-ter, artery, and vein (Table).
The average peak enhancement for gray matter was 9.79⫾ 0.33, 10.60⫾0.19, and 12.31⫾0.41 HU in concentration groups 300, 350, and 400 mg/mL, respectively. These values were statistically significantly different between groups 300 and 350 mg/mL (P ⬍ .01), between groups 300 and 400 mg/mL (P⬍.001), as well as between groups 350 and 400 mg/mL (P⬍.001).
For white matter, the average peak enhancement was 4.16⫾0.13, 4.53⫾0.09, and 5.05⫾0.20 HU in concentration groups 300, 350, and 400 mg/mL. These values were statisti-cally significantly different between groups 300 and 350
mg/mL (P⬍.01), between groups 300 and 400 mg/mL (P⬍ .001), as well as between groups 350 and 400 mg/mL (P⬍.01). Average peak enhancement for the arterial input measured from the ACA was 240⫾13, 273⫾8, and 313⫾13 HU in concentration groups 300, 350, and 400 mg/mL. These values were statistically different between groups 300 and 350 mg/mL (P⬍.01), between groups 300 and 400 mg/mL (P⬍.001), as well as between groups 350 and 400 mg/mL (P⬍.01).
Average peak enhancements for the venous output as mea-sured from the sagittal sinus were 375.3⫾9.4, 384.9⫾7.4, and 421.9⫾14.4 in concentration groups 300, 350, and 400 mg/mL. There was a statistically significant difference between groups 300 and 400 mg/mL (P⬍.01) and between groups 350 and 400 mg/mL (P⬍.01), but statistical significance was not reached between the 300 and 350 mg/mL groups, though a trend was evident.
The increasing signal-intensity enhancement as a function of contrast concentration is presented graphically for each an-atomic location in Fig 2. A linear increasing trend is clearly evident. The coefficients of correlation for each anatomic re-gion were 0.98, 0.99, 1.0, and 0.95 for gray matter, white mat-ter, artery, and vein, respectively.
Discussion
First-pass CTP with intravenous injection of iodine contrast agent is an important tool when diagnosing patients with acute stroke.1-5,10,11During its first passage, the contrast
ma-terial bolus remains in the intravascular space resulting in tis-sue enhancement proportional to the amount of iodine in the vessel. The signal intensity has to rise reliably above the base-line noise to perform a robust first-pass analysis of time-en-hancement data. In addition, the contrast bolus has to be suf-ficiently short so that complete enhancement curves, including a baseline signal-intensity increase and decrease back to baseline, can be recorded with a rather limited data-acquisition time, typically 45– 60 seconds.
Two major approaches can be considered toward achieving better signal-intensity enhancement during the first passage of contrast without increasing bolus duration. One approach is to increase the injection rate; the other is to increase contrast material iodine concentration. Raising the injection rate above 7 mL/s is impractical because to do so would require that a 16-gauge or larger cannula be used, as well as direct physician supervision during each scanning. The latter approach, namely increasing the concentration of agent injected, is pref-erable because all the other factors can remain unchanged.
In the current study, we compared the effect of contrast material iodine concentration on peak enhancement of vari-ous brain tissues. The highest concentration we used was the 400 mg/mL that recently has become available for clinical use. Comparing this new agent, iomeprol, with current concentra-tions of 300 and 350 mg/mL of iohexol, we found that peak enhancement in all tissues studied was significantly higher with 400 mg/mL than with 300 or 350 mg/mL. Increased en-hancement inevitably improves the signal-to-noise ratio of observed time-enhancement curves, thus making the calcula-tion of physiologic parameters more robust.12In addition, the increased peak height has an additional benefit of reducing the bolus duration when the total iodine dose is kept constant. In our study using a 400-mg/mL agent, the bolus duration was 1 The average peak enhancement for gray matter, white matter,
artery, and vein in different concentration groups
second shorter than that with the 350-mg/mL agent and 2 seconds shorter than that with 300-mg/mL agent. Because it is important to include complete time-enhancement curves in the analysis when physiologic maps are constructed, a shorter bolus is beneficial because it further improves the probability that complete curves are recorded in all patients.
Currently, to our knowledge, there is no literature compar-ing the effect of contrast material iodine concentration on ce-rebral enhancement. Investigations in other organ systems, namely liver, lung, and heart, however, have been performed. In a study of multidetector row CT (MDCT) angiography of pulmonary arteries, 2 groups of patients were studied.13 A
low-concentration group received 120 mL of 300-mg/mL io-hexol, and the high concentration group, 90 mL of 400-mg/mL iomeprol at a constant injection rate of 4 mL/s. An otherwise identical imaging protocol was used in both groups, and in both groups, the total iodine dose administered was the same. The investigators measured a mean enhancement along the z-axis and found that in the low-concentration group, the enhancement was 76 HU smaller than that in the high-con-centration group; this was a statistically significant difference. The clinical importance of their result was that visualization of subsegmental pulmonary arteries improved when contrast concentration was increased.
In a coronary angiography study, Cademartiri et al,14
in-vestigating 4 contrast concentrations, namely 300-mg/mL io-hexol, 320-mg/mL iodixanol, 350-mg/mL ioio-hexol, and 400-mg/mL iomeprol, found that mean attenuation values in the descending aorta and coronary arteries were significantly lower with the lower concentration agents as compared with 400-mg/mL iomeprol. In this study, the total volume of con-trast material (140 mL), injection rate (4 mL/s), and imaging protocol were identical in all patients studied.
Two liver studies have been performed investigating the effects of varying iodine concentrations on aortic, portal vein, and/or hepatic enhancements. In a study by Suzuki et al,15the
investigators used 2 iodine concentrations, 300 and 370 mg/ mL, and studied the differences in tissue enhancement in
aorta, portal vein, and liver parenchyma. Total iodine dose was normalized to the patient’s body weight (600 mg/kg), and bolus duration was kept constant. Thus, their result, namely that the concentra-tion of contrast material does not influ-ence the efficacy of contrast enhance-ment of the aorta, portal vein, and liver except for the portal vein at the late arte-rial phase, does not reflect the effect of contrast concentration alone but also of the other factors such as the total amount of iodine, injection rate, catheter size, and the injection site, because these rameters changed from patient to pa-tient. In another investigation of liver perfusion by Awai et al,16multiple parameters affecting the
tissue enhancement (injection rate, total iodine dose) were varied and thus masked the effects of contrast concentration alone. Their finding was that a rapid administration of mod-erate-concentration agent was more effective than high concentration.
If a comparison between our study and the studies refer-enced previously is attempted, our result supports the results of the MDCT angiography study of pulmonary arteries13and
the coronary angiography study.14In all 3 studies, the study
design was very similar, injection rate and total iodine dose were constant, and the iodine concentration was the only vari-able studied. When comparison with the 2 liver studies15,16is
attempted, the results are apparently contradictory. However, this difference may be explained by the fact that in both of the liver studies, the injection rate and the total iodine dose was varied from patient to patient. Because the injection rate is one of the major factors determining the peak enhancement achieved, especially during the early passage of the contrast bolus, the results of the 2 liver studies depend not only on the effects of contrast concentration but also on other factors such as injection rate and total iodine dose.
In conclusion, we observed that increasing contrast con-centration results in improvement in peak opacification of cerebral tissues when using a first-pass CTP paradigm. In the context of constant background noise, increased peak signal intensity implies a better signal-to-noise ratio. Because many techniques for the analysis of CTP data depend on identifica-tion of the signal intensity above background noise, we recom-mend use of a contrast agent with the highest available iodine concentration to generate the signal-intensity data for such analyses.
References
1. Mayer TE, Hamann GF, Baranczyk J, et al.Dynamic CT perfusion imaging of
acute stroke.AJNR Am J Neuroradiol2000;21:1441– 49
2. Latchaw RE, Yonas H, Hunter GJ, et al.Guidelines and recommendations for
perfusion imaging in cerebral ischemia: a scientific statement for health care
[image:4.585.51.365.42.291.2]professionals by the writing group on perfusion imaging from the Council on Cardiovascular Radiology of the American Heart Association. Stroke
2003;34:1084 –104
3. Esteban JM, Cervera V.Perfusion CT and angio CT in assessment of acute
stroke.Neuroradiology2004;46:705–15
4. Wintermark M, Fischbein NJ, Smith WS, et al.Accuracy of dynamic perfusion
CT with deconvolution in detecting acute hemispheric stroke.AJNR Am J Neuroradiol2005;26:104 –12
5. Eastwood JD, Lev MH, Provenzale JM.Perfusion CT with iodinated contrast
material.AJR Am J Roentgenol2003;180:3–12
6. Hamberg LM, Hunter GJ, Halpern EF, et al.Quantitative high-resolution
mea-surement of cerebrovascular physiology with slip-ring CT.AJNR Am J Neuro-radiol1996;17:639 –50
7. Nabavi DG, Genic A, Craen RA, et al.CT assessment of cerebral perfusion:
exper-imental validation and initial clinical experience.Radiology1999;213:141– 49
8. Sanelli PC, Lev MH, Eastwood JD, et al.The effect of varying user-selected
input parameters on quantitative values in CT perfusion maps.Acad Radiol
2004;11:1085–92
9. Kealey SM, Loving VA, Delong DM, et al.User-defined vascular input function
curves: influence on mean perfusion parameter values and signal-to-noise ratio.Radiology2004;231:587–93
10. Hoeffner EG, Case J, Jain R, et al.Cerebral perfusion CT: technique and clinical
applications.Radiology2004;231:632– 44
11. Shetty SK, Lev MH.CT perfusion in acute stroke.Neuroimaging Clin N Am
2005;15:481–501
12. Benner T, Heiland S, Erb G, et al.Accuracy of gamma-variate fits to
concen-tration-time curves from dynamic susceptibility-contrast enhanced MRI: in-fluence of time resolution, maximal signal drop and signal-to-noise.J Magn Reson Imaging1997;15:307–17
13. Schoellnast H, Deutschman HA, Fritz GA, et al.MDCT angiography of the
pulmonary arteries: influence of iodine flow concentration on vessel attenu-ation and visualizattenu-ation.AJR Am J Roentgenol2005;184:1935–39
14. Cademartiri F, Mollet NR, van der Lugt A, et al.Intravenous contrast material
administration at helical 16-detector row CT coronary angiography: effect of iodine concentration on vascular attenuation.Radiology2005;236:661– 65
15. Suzuki H, Oshima H, Shiraki N, et al.Comparison of two contrast materials
with different iodine concentrations in enhancing the density of the aorta, portal vein, and liver at multi-detector row CT: A randomized study.Eur
Ra-diol2004;14:2099 –104
16. Awai K, Inoue M, Yagyu Y, et al.Moderate versus high concentration of