Volume 1
The health of
minority ethnic groups
A survey carried out on behalf of The Information Centre
Edited by
Kerry Sproston and Jennifer Mindell
Joint Health Surveys Unit
National Centre for Social Research
Department of Epidemiology and Public Health at the
Royal Free and University College Medical School
Health Survey for England
National Centre for Social Research
The National Centre for Social Research is the largest independent social research institute in Britain, specialising in social survey and qualitative research for the development and evaluation of policy. NatCen specialises in research in public policy fields such as health, housing, employment, crime, education and political and social attitudes. Projects include ad hoc and continuous surveys, using face-to-face, telephone and postal methods; many use advanced applications of computer assisted interviewing. NatCen has approximately 300 staff, a national panel of over 1,000
interviewers and 200 nurses who work on health-related surveys.
Department of Epidemiology and Public Health at the Royal Free and University College Medical School
e. All rights r
e
served
Health Survey for England 2004
Volume 1
Volume 1
The health of
minority ethnic groups
Edited by
Kerry Sproston and Jennifer Mindell
Principal authors
Elizabeth Becker, Richard Boreham, Moushumi Chaudhury, Rachel Craig,
Claire Deverill, Melanie Doyle, Bob Erens, Emanuela Falaschetti, Elizabeth Fuller,
Amy Hills, Vasant Hirani, Dhriti Jotangia, Jennifer Mindell, Lucy Natarajan, Emmanuel
A survey carried out on behalf of The Information Centre
Health Survey for England
e. All rights r
eserved
Summary booklet available from:
Online www.ic.nhs.uk
Mail, Telephone & E-mail The Information Centre
1 Trevelyan Square, Boar Lane, Leeds LS1 6AE Telephone orders/General enquiries: 0845 300 6016 E-mail: enquiries@ic.nhs.uk
The full text of this publication has been made available to you on the Internet at www.ic.nhs.uk/pubs
Copyright © 2006, The Information Centre. All rights reserved.
This work remains the sole and exclusive property of The Information Centre and may only be reproduced where there is explicit reference to the ownership of The Information Centre.
This work may only be reproduced in a modified format with the express written permission of The Information Centre.
First published 2006
Foreword 9
Editors’ acknowledgements 10
Notes 11
1 Introduction 13
1.1 The Health Survey for England 13
1.2 The 2004 Health Survey for England 14
1.3 Ethical clearance 14
1.4 This report 15
1.5 2004 survey design 15
1.6 Data analysis 19
1.7 Content of this report 23
2 Self-reported health and psychosocial wellbeing Lucy Natarajan 25
2.1 Introduction 26
2.2 Self-reported general health 26
2.3 Self-reported longstanding illness and limiting longstanding illness 27
2.4 Self-reported acute sickness 29
2.5 Self-reported psychosocial health 30
2.6 Prescribed medications 33
Tables 34
3 Cardiovascular disease and diabetes Jennifer Mindell & Paola Zaninotto 63
3.1 Cardiovascular disease 65
3.2 Diabetes 71
Tables 77
Contents
5.1 Introduction 132
5.2 Measures 132
5.3 Usual drinking frequency 133
5.4 Frequency of drinking in the past week 134
5.5 Amount consumed on the heaviest drinking day in the past week 136
Tables 140
6 Anthropometric measures, overweight and obesity Vasant Hirani & Emmanuel Stamatakis 163
6.1 Introduction 165
6.2 Anthropometric measures by minority ethnic groups 167
6.3 Overweight, obesity, waist-hip ratio and waist circumference, by equivalised household income tertile 172
6.4 Comparisons between 1999 and 2004 174
Tables 177
7 Blood pressure Moushumi Chaudhury & Paola Zaninotto 205
7.1 Introduction 206
7.2 Methods and definitions 206
7.3 Response rates 207
7.4 Blood pressure measurements 208
7.5 Hypertension 210
7.6 Urinary sodium and potassium and their relationship with blood pressure 212
7.7 Blood pressure levels by equivalised household income 212
7.8 Comparison of systolic and diastolic blood pressure in 2004 and 1999 213
7.9 Comparison of prevalence of hypertension (140/90 mmHg) in 2004 and 1999 213
Tables 215
8 Physical Activity Emmanuel Stamatakis 237
8.1 Introduction 238
8.2 Methods 238
8.3 Participation in different types of physical activity, and summary activity levels 239
8.4 Physical activity comparisons between 1999 and 2004 245
Tables 248
9 Eating habits Rachel Craig, Melanie Doyle and Dhriti Jotangia 263
9.1 Introduction 265
9.2 Methodology 266
9.3 Fruit and vegetable consumption 267
9.4 Fat intake 271
9.5 Use of salt in cooking and at the table 272
Tables 276
e. All rights r
e
10 Blood analytes Emanuela Falaschetti & Moushumi Chaudhury 301
10.1 Introduction 303
10.2 Response to non-fasting and fasting blood samples and percentage of valid samples for each analyte 303
10.3 Total cholesterol and HDL-cholesterol 303
10.4 C-reactive protein 306
10.5 Fibrinogen 306
10.6 Haemoglobin 307
10.7 Ferritin 308
10.8 Glycated haemoglobin 309
10.9 Fasting blood samples 309
10.10 LDL-cholesterol 310
10.11 Triglycerides 311
10.12 Glucose 312
Tables 315
11 Complementary and alternative medicines and
therapies (CAM) Richard Boreham 345
11.1 Introduction and measures 346
11.2 Ever used CAM 346
11.3 Used CAM in last 12 months 347
11.4 Consulted a CAM practitioner in last 12 months 349
11.5 Relationship between ever using CAM, use of CAM in the last 12 months, and consulting a CAM practitioner in the last 12 months 351
Tables 353
12 Children’s health Elizabeth Fuller 377
12.1 Introduction 379
12.2 General health 380
12.3 Psychosocial health 382
12.4 Respiratory symptoms and lung function 383
12.5 Cigarette smoking 386
e. All rights r
e
served
This report presents the findings of the fourteenth annual survey of health in England. I am pleased to present this important research which has been undertaken on behalf of The Information Centre for health and social care.
The Health Survey for England is conducted annually and collects information about a representative sample of the general population. It is vital to our understanding of the health situation and behaviours of the public in England and helps to ensure that policies are informed by these data.
The survey combines information gathered through interviewing the sampled respondents, including a wealth of socio-demographic variables, with objective measures of health, such as blood pressure measurements, and analyses of blood samples. Thus we can study the inter-relationship of the characteristics and circumstances of adults and their children, with their health situation. It is an important source of information on health equity, and the survey from 2004 is especially valuable in this regard since there is a focus on the health of ethnic minorities (Black Caribbean, Black African, Pakistani, Indian, Bangladeshi, Chinese and Irish) gathered through a sample augmented in respect of people in these categories.
I am honoured to welcome this valuable report and to thank all my colleagues in the Information Centre and our counterparts in the Joint Health Surveys Unit for their work. Surveys of this complexity are a team effort. The dedication of the skilled interviewing force is especially noteworthy. May I also thank the anonymous respondents across England who gave up their time to take part in the survey and who were willing to submit to various health tests. Without their help we would lose a public tool of enormous potential to benefit and protect the health of every one of us.
Professor Denise Lievesley
Chief Executive
Editors’ acknowledgements
We wish to thank, first of all, all those who gave up their time to be interviewed and who welcomed interviewers and nurses into their homes. We would also like to acknowledge the debt the survey’s success owes to the commitment and professionalism of the interviewers and nurses who worked on the survey throughout the year.
We would like to thank all those colleagues who contributed to the survey and this report. In particular we would like to thank:
● The authors of all the chapters: Elizabeth Becker, Richard Boreham, Moushoumi Chaudhury, Rachel Craig, Claire Deverill, Melanie Doyle, Bob Erens, Emanuela Falaschetti, Elizabeth Fuller, Vasant Hirani, Amy Hills, Dhriti Jotangia, Lucy Natarajan, Emmanuel Stamatakis, Heather Wardle and Paola Zaninotto.
● Claire Deverill and Laura Ringham, whose hard work and support has been crucial in putting this report together.
● Other research colleagues: Shaun Scholes, Kevin Pickering, Paola Primatesta, James Nazroo, Martin Jarvis and Professor Sir Michael Marmot.
● Operations staff, especially Lesley Mullender, Sue Roche and the Area Managers at NatCen and Barbara Carter-Szatnyska at UCL.
● All the field interviewers and nurses who worked on the project.
● The principal programmers: Jo Periam and Sven Sjodin.
We would also like to express our thanks to the staff of the Department of Clinical Biochemistry at the Royal Victoria Infirmary in Newcastle upon Tyne for their helpfulness and efficiency.
Last, but certainly not least, we wish to express our appreciation of the work of the Health and Social Care Information Centre staff at all stages of the project, and in particular the contribution made by Patrick Tucker and Richard Bond.
e. All rights r
e
served
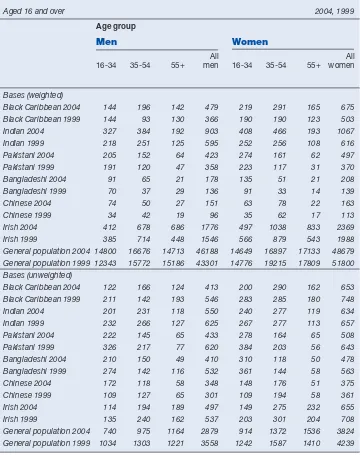
1. The data used in the report have been weighted. The weighting is described in Chapter 7, in Volume 2 of this report. Both unweighted and weighted sample sizes are shown at the foot of each table. The weighted numbers reflect the relative size of each group in the population, not numbers of interviews made, which are shown by the unweighted bases.
2. Three different non-response weights have been used: one for non-response at the interview stage, one for non-response to the nurse visit, and one for non-response to the blood sample.
3. The following conventions have been used in tables:
- No observations (zero value)
0 Non-zero values of less than 0.5% and thus rounded to zero
[ ] Used to warn of small sample bases, if the unweighted base is less than 50. If a group’s unweighted base is less than 30, data are normally not shown for that group.
4. Because of rounding, row or column percentages may not add exactly to 100%.
5. A percentage may be quoted in the text for a single category that aggregates two or more of the percentages shown in a table. The percentage for the single category may, because of rounding, differ by one percentage point from the sum of the percentages in the table.
6. Values for means, medians, percentiles and standard errors are shown to an
appropriate number of decimal places. Standard Error may sometimes be abbreviated to SE for space reasons.
7. ‘Missing values’ occur for several reasons, including refusal or inability to answer a particular question; refusal to co-operate in an entire section of the survey (such as the nurse visit or a self-completion questionnaire); and cases where the question is not applicable to the informant. In general, missing values have been omitted from all tables and analyses.
8. All minority ethnic date related to 2004 (except for comparisons with results from HSE 1999 which also focused on the health of minority ethnic groups). General population data normally related to 2004, but because the general population sample in 2004 did not have a nurse visit, comparative data about the general population have, in some cases, been taken from the previous year (2003). Where this has been the case, it is indicated.
9. Some tables and charts who data in the form of risk ratios, or ratios of means. In all chapters, except chapter 12, these ratios have been age-standardised. In the charts, ratios have been plotted using a logarithmic scale on the vertical (y) axis. The range is normally from 0.1 to 10.0 (the general population being set at 1.0). The lower and upper 95% confidence limits are also plotted, as a vertical line with markers at the lower and upper ends.
10. The group to whom each table refers is stated at the upper left corner of the table.
11. The term ‘significant’ refers to statistical significance (at the 95% level) and is not intended to imply substantive importance.
Introduction
1
1.1 The Health Survey for England
This is the fourteenth annual survey of health in England. Each survey has covered adults aged 16 and over living in private households in England. Since 1995, the surveys have included children aged two to 15, and since 2001, infants under two years old, who live in households selected for the survey. Results for adults and children from previous surveys are also available on the Department of Health’s website:
(http://www.dh.gov.uk/PublicationsAndStatistics/PublishedSurvey/fs/en ).
Like the 1999 survey,1this year focuses on the health of adults from various minority ethnic groups in England. Additional households were included in the survey to increase the number of Black Caribbean, Indian, Pakistani, Bangladeshi, Chinese and Irish
participants, as in 1999. For 2004, the representation of Black African informants was also increased. This report compares results for each of these groups with the general
population in England.
The Health Survey for England (HSE) is part of a programme of surveys commissioned by the Department of Health, and provides regular information that cannot be obtained from other sources on a range of aspects concerning the public’s health, and many of the factors that affect health. Since April 2005 this function has been taken over by the new Health and Social Care Information Centre. More details about the Information Centre are available from its website (www.ic.nhs.uk). Results for adults and children from the general population in 2004 are also available on the Information Centre’s website:
(www.ic.nhs.uk/pubs/hlthsvyeng2004upd ).
The series of Health Surveys for England was designed to:
1. Provide annual data for nationally representative samples to monitor trends in the nation’s health;
2. Estimate the proportion of people in England who have specified health conditions;
3. Estimate the prevalence of certain risk factors associated with these conditions;
4. Examine differences between subgroups of the population (by age, sex, income or ethnicity) in their likelihood of having specified conditions or risk factors;
Unit of the National Centre for Social Research (NatCen) and the Department of
Epidemiology and Public Health at the Royal Free and University College Medical School (UCL).
1.2 The 2004 Health Survey for England
Health varies significantly between different ethnic groups,1,2but while the variations are well established, less is known about why they occur and the extent to which ethnicity is related to health independently of other circumstances such as income and social class. There are also concerns about inequalities in risk factors and in access to health care between different groups. This is the second health survey in the series to consider the health of minority ethnic groups in this country. It was designed to build on the information obtained in the 1999 survey. A large-scale representative sample of adults and children from minority ethnic groups across England was interviewed; information obtained was complemented by objective physical measurements and analysis of blood, urine and saliva samples.
The general household sampling method does not yield sufficient numbers of households from minority ethnic groups to analyse their responses separately. Therefore, only half of the usual sample number of adults and children was selected in the usual way. This provided a representative sample of the whole population (including members of minority ethnic groups who happened to be included in this general sample), with whom the specific minority ethnic groups could be compared. 6,552 addresses were selected in 312 wards, issued over twelve months from January to December 2004. Up to ten adults and up to two children in each household were interviewed, and a nurse visit arranged for those
participants in minority ethnic groups who consented.
The other part of the sample for the 2004 survey was a ‘boost’ sample designed to include additional interviews with members of the seven largest minority ethnic groups in England: Black Caribbean, Black African, Indian, Pakistani, Bangladeshi, Chinese and Irish. 41,436 addresses were selected from another 483 wards, issued over the same 12 month period, January to December 2004. For these addresses, only those from the specified minority ethnic groups were eligible for inclusion: up to four adults and three children were included from each eligible household in the boost sample, with a random selection of participants if there was more than this number in an eligible household.
The content of the survey (household interview, individual interviews, and height and weight measurements) was similar for both the core and the boost samples. The ethnic boost sample was asked additional questions about fungus, damp, and pets in the household; cardiovascular disease; country of birth, religion, languages, and cultural identity (adults aged 16+); and asthma and wheezing (children). Only informants in the seven target minority ethnic groups (in either the core or boost sample) had a nurse visit, measuring infant length (aged at least six weeks and under two years), blood pressure (aged 5+), lung function (aged 7-15), and waist and hip circumference (aged 11+). Nurses also took a saliva sample for cotinine assay (aged 4-15), a non fasting blood sample (aged 11+), a fasting blood sample (16+), and a spot urine sample (16+) for analysis. Nurses obtained written consent before taking samples from adults, and parents gave written consent for their children’s samples, while children also signed consent for their blood samples. Consent was also obtained from adults to send results to their GPs, and from parents to send their children’s results to GPs.
1.3 Ethical
clearance
Ethical approval for the 2004 survey was obtained from the London Multi-centre Research Ethics Committee (MREC).
e. All rights r
1.4 This
report
The 2004 Health Survey for England was designed primarily to provide information about the seven largest minority ethnic groups in England. Comparisons are made between these groups and the results from the general population sample where these exist. Comparisons for information from the nurse visit are made with the results from the 2003 survey for adults, and the 2001/2002 survey for children, as there was no nurse visit for the general population sample in 2004.
When reading this report, it should be noted that the ‘general population’ refers to the whole population of England, regardless of minority ethnic group. It should not be interpreted as ‘the remainder of the population’, excluding those from the seven minority ethnic groups on whom this report focuses.
1.5 2004 survey design
1.5.1 Introduction
The survey was designed to yield a representative sample of the general population of any age living in private households, plus a similar sample of the seven most populous minority ethnic groups in England. More detailed information about survey design is presented in Volume 2 of this report.
Those living in institutions were excluded from the survey: this should be considered when interpreting the findings. Those living in institutions, whether prisons or care homes, generally have poorer health than average. This will affect ethnic groups in different ways. For example many minority ethnic groups have a younger age profile than the English average, and more families in minority ethnic groups may care for elders within private households. Thus excluding people living in institutions may affect assessment of the overall health of minority ethnic groups to a lesser extent than that of the general population.
1.5.2 The core general population sample
A random sample of 6,552 addresses was selected from the Postcode Address File (PAF), using a multi-stage sample design with appropriate stratification. This was to ensure that households were sampled proportionately across the nine Government Office regions of England. 312 wards were selected, and 21 addresses selected within each ward. Where an address was found to have multiple households, up to three households were included, and if there were more than three, a random selection was made.
Each individual within a selected household was eligible for inclusion. Where there were more than two children, two were randomly selected for inclusion, to limit the burden on any household. A maximum limit of ten adults per household was also imposed, although there were no cases where there were more than ten adults in a selected household.
one group only Irish informants were included (see table below).
A different procedure, focused enumeration, was followed in 40 of the selected wards with the lowest density of people from Black and Asian backgrounds (at least 2% but less than 10% of the total resident population). In each of these wards, 80 ‘seed’ addresses were selected, and as well as establishing eligibility at these addresses, interviewers asked about people from minority ethnic backgrounds at the two addresses on either side of the address (‘adjacent addresses’). This technique is only appropriate for identifying ‘visible’ minority ethnic groups, and therefore was not used to identify people of Irish origin. If the
householder at the seed address stated that there was no-one from one of the minority ethnic groups at any of the adjacent addresses, then they were screened out and the interviewer made no attempt to make contact. Otherwise, the interviewer attempted to make contact at the adjacent addresses to undertake screening for eligible households.
[image:15.595.65.380.269.483.2]The table below shows the 13 sampling groups, the number of addresses issued in each, and any restrictions imposed on minority ethnic groups to be sampled.
Table 1.1: Number of wards and addresses selected per sample group
Number of Number of Total Proportion of wards screened:
wards addresses number of
selected per ward addresses Black
Caribbean Indian Others
Stratum 1 70 45 3150 all half all
Stratum 2 62 60 3720 all half all
Stratum 3 60 40 2400 half all all
Stratum 4 31 115 3565 16/31 half all
Stratum 5 30 60 1800 half half all
Stratum 6 16 50 800 all half all
Stratum 7 18 60 1080 all half all
Stratum 8 13 50 650 7/13 all all
Stratum 9 2 80 160 half half all
Stratum 10 6 40 240 half half all
Stratum 11 34 90 3060 half half all
Stratum 12 40 80+3201 16000 all all all2
Stratum 13 26 35 910 none none Irish only
Total 408 37535
180 seed addresses and 320 adjacent focused enumeration addressees. 2
Irish informants included from seed address only.
Special Chinese boost sample
In addition, a special Chinese boost sample was used, which involved screening the Electoral Register for people with ‘Chinese sounding’ surnames. 75 wards, identified from the 2001 Census as containing 15 or more Chinese people, were selected. For each selected ward, all households on the restricted Electoral Register (i.e. where people had agreed to have their names included in the public listing of the register) with at least one resident with a Chinese sounding surname were identified for screening. This sampling approach followed methodology devised by the Office for National Statistics (ONS), based on a list of the 1,300 most common Chinese surnames appearing in the English version of the 1991 Hong Kong telephone directory. A total of 3,901 addresses were issued, and interviewers visited the selected addresses to establish whether any Chinese informants were resident.
It should be noted that the sampling methodology for the Chinese differed in 2004 and 1999. The 2004 survey identified Chinese informants from the core general population sample, the minority ethnic boost sample and the special Chinese boost sample, as described above. In 1999, apart from Chinese informants identified in the general population sample, the sample of Chinese informants was not selected independently. It was obtained by following up addresses with Chinese residents in a survey carried out by the National Centre on behalf of the Health Education Authority (HEA) in 1998. This study looked at the health and lifestyles of Chinese residents aged 16-74 in England; it was
e. All rights r
restricted to areas of the country identified in the 1991 Census as having the highest proportions of Chinese residents, and involved screening the Electoral Register for ‘Chinese sounding’ names.3The different methodologies adopted for the two surveys may affect comparability of results for the Chinese population, and should be taken into account when interpreting the findings.
Selecting individuals in the minority ethnic sample
Each individual in a selected household with one or more residents from the target minority ethnic groups was eligible to participate. As minority ethnic groups more commonly live in larger households than the general population, the rules for selecting individuals were different from those in the core general population sample. Up to four minority ethnic adults were included in the survey, to limit the survey burden for these households (rather than up to ten adults in the core sample). However, up to three children were included (rather than two in the core sample) to ensure that sufficient numbers of interviews with children from minority ethnic backgrounds were achieved. Where there were more than these numbers of eligible adults or children, participants were randomly selected.
1.5.4 Minority ethnic groups in the general population sample
In addition to those identified in the boost sample, a number of informants from the eligible minority ethnic groups were identified in the general population sample. To obtain the total minority ethnic group sample that is reported here, informants from eligible groups who were identified in the general population sample were included with those from the boost sample. Thus, minority ethnic informants identified in the general population sample are included in boththe general population sample and the minority ethnic sample in this report.
1.5.5 Establishing ethnicity
Ethnicity was established during the screening process by the interviewer reading a list of minority ethnic groups and asking, for each one, whether anyone in the household was of that origin. The descriptions for all the target minority ethnic groups, apart from the Irish, were as defined in the Census. People were included as being of Irish origin if they were born in Ireland, or their father or mother was born there. Informants of mixed origin
including one of the target minority ethnic groups were included as eligible. At the screening stage, an adult member of the household provided information, including ethnic origin, about all household members. Each individual selected for interview was later asked to confirm their ethnic origin, and his/ her own classification was definitive.
If informants were not able to speak English, language cards were used to indicate the languages for which translations were available (Urdu, Punjabi, Gujarati, Hindi, Bengali, Mandarin, Cantonese). Informants who were able to read one of the translated languages were given a card in that language with the appropriate screening questions to establish whether they and other household members belonged to an eligible group.
Volume 2; full documentation is provided in the Appendices to Volume 2. Interview topics included general health, fractures, physical activity (aged 2+), fruit and vegetable
consumption (aged 5+), smoking and alcohol use (aged 8+), and psychosocial health (aged 13+). Adults (aged 16+) were also asked about use of complementary and alternative medicine, social support, and use of hormone replacement therapy and the contraceptive pill. Adults aged 16 and 17 were given a self-completion questionnaire to provide
information about smoking and alcohol use, to respect their privacy and avoid potential embarrassment or unwillingness to answer if parents were present.
For children under 13, one of the child’s parents or guardians was interviewed about the child, with the child present during the interview. Additional questions about children included reported birth weight and use of cycle helmets. To protect privacy for some topics, self-completion questionnaires were given to children aged eight to 15 to enquire about smoking and alcohol consumption. Children aged 13-15 were interviewed in person, after permission was obtained from a parent or guardian. Parents of children aged four to 15 were also given a self-completion questionnaire to complete about strengths and difficulties their child experienced.
The ethnic boost sample was asked additional questions about fungus, damp and pets in the household; cardiovascular disease, country of birth, religion, languages, and cultural identity (adults aged 16+); and asthma and wheezing (children).
At the end of the interview, the interviewer measured the participants’ height (aged 2+) and weight.
Non-English speaking participants
All survey materials were translated into seven languages: Bengali, Gujarati, Hindi, Punjabi, Urdu, Mandarin and Cantonese. Wherever possible, participants who were unable to be interviewed in English were visited by an interviewer who could speak the relevant
language, and this interviewer accompanied the nurse for her visit if the nurse did not speak the relevant language.
Nurse visit
All participants from any of the seven minority ethnic groups, whether in the core or boost samples, were eligible for a nurse visit. The nurse obtained information on current medication and gave participants aged 16+ a self-completion booklet on their eating habits. Nurses then took various measurements, depending on the participant’s age: measuring infant length (aged at least six weeks and under two years), blood pressure (aged 5+), lung function (aged 7-15), waist and hip circumference (aged 11+). Non fasting blood samples were collected for the analysis of total and house dust mite specific IgE (aged 11-15); total and HDL cholesterol, glycated haemoglobin, haemoglobin, and ferritin (aged 11+); and fibrinogen and c-reactive protein (aged 16+). Where possible, fasting blood samples were obtained from adults (aged 16+) to be analysed for triglycerides, LDL
cholesterol and glucose. A urine sample was also requested from adults to assess dietary sodium and a saliva sample from children aged 4-15 for cotinine, to assess smoking and exposure to tobacco smoke.
1.5.7 Survey response
Interviews were held in 4,119 households with 6,704 adults aged 16 or over, and 1,650 children from the general population, including 876 adults and 393 children from minority ethnic groups. The minority ethnic boost sample resulted in an additional 5,940 adults and 2,905 children being interviewed. Among minority ethnic informants, 3,540 adults and 1,743 children agreed to a nurse visit, with 2,325 adults and 174 older children (11+) giving a blood sample.
Response to the survey can be calculated in two ways: at a household level and at an individual level. A summary of responses obtained to each component of the survey is given below for the general population as well as for each minority ethnic group.
e. All rights r
Interviews were carried out at 72% of households in the general population, at 69% of known eligible boost sample households (66% of estimated eligible households).
[image:18.595.148.575.154.526.2]Within the general population sample, interviews were obtained with 90% of adults and 94% of (sampled) children in interviewed households. The equivalent figures for the total minority ethnic sample were 88% of adults and 92% of children.
Table 1.2: Adult response rate in co-operating households
Black Black General
Caribbean African Indian Pakistani Bangladeshi Chinese Irish population
% % % % % % % %
Interviewed 88 89 87 84 89 84 92 90
Height measured 70 71 78 69 73 74 81 79
Weight measured 67 69 77 66 69 72 79 77
Saw nurse 45 40 51 42 33 44 59 n/a
Waist-hip
measured 43 37 49 38 31 43 57 n/a
Blood pressure
measured 44 38 50 39 31 43 58 n/a
Non fasting blood
sample obtained 28 24 37 25 19 26 45 n/a
Fasting blood
sample obtained 18 14 21 13 8 17 28 n/a
Saliva sample
obtained 38 34 45 33 28 37 54 n/a
Urine sample
obtained 36 33 43 30 25 35 51 n/a
Table 1.3: Child response rate in co-operating households
Black Black General
Caribbean African Indian Pakistani Bangladeshi Chinese Irish population
% % % % % % % %
Interviewed 92 92 93 92 91 95 94 94
Height measured 65 72 81 74 68 81 79 80
Weight measured 62 69 80 74 67 79 75 78
Saw nurse 45 43 57 53 35 54 60 n/a
Waist-hip measured (aged 11
and over) 41 40 55 43 20 35 55 n/a
Blood pressure measured (aged 5
and over) 43 38 55 45 30 47 58 n/a
Lung function measured (aged 7
and over) 34 35 48 34 26 41 51 n/a
Non fasting blood sample obtained
(aged 11 and over) 15 22 24 10 10 10 26 n/a
Saliva sample obtained (aged 4
[image:18.595.147.575.381.616.2]addition current smokers include many individuals who will not develop heart disease or who have not yet done so, and those smokers whose heart disease is most closely related to smoking may have died prematurely.
1.6.2 Weighting the samples
The general population sample
For the general population sample, weights were calculated at the household level and at the individual informant level. The household weights corrected for the probability of selection where additional households were identified at a selected address. Calibration weighting was also used for adults to reduce non-response bias resulting from differential non-response at the household level, based on the age and sex profile of the residents and the region in which the household was situated. Weights were also calculated at an individual level for adults to correct for non-response within participating households.
For children, selection weights were calculated so that children in larger households were not under-represented in the sample, since a maximum of two children were interviewed in a household. Adjustment weights were also calculated for children at the individual level by age within sex to reduce any non-response bias resulting from the age profile of the sample.
There was no nurse visit for adults in the general population core sample who were not from a minority ethnic background, and therefore no further weighting was required.
The minority ethnic boost sample
The minority ethnic sample was obtained from three sources: minority ethnic informants in the general population core sample; the boost samplefor minority ethnic groups; and the Chinese special boost sample for Chinese informants.
The household selection weights for the boost were calculated in the same way for the core sample, with the exception of sample points where focused enumeration was carried out. In these sample points the household selection weight was set to be 1 for all households in the sample. Selection weights were calculated for adults and children to adjust for the probability of being included, since a maximum of four adults and three children were selected. Selection weights for addresses were also calculated for each informant separately, because each informant from a minority ethnic group had a chance of being selected either from the general population or the boost sample, with the probability of being interviewed for the boost sample depending on their ethnic group. Therefore the probability of selection for an informant would be the same whether they were selected for the core sample or the boost sample.
The weighted distribution of the minority ethnic groups using the combination of these selection weights was treated as the best estimate of the population distribution, and this distribution was therefore used to ‘correct’ weights at each stage of the weighting process.
For the Chinese sample, the combined weights for Chinese people from the core and boost samples were re-scaled so that they summed to the number of Chinese informants from those samples. The weights for the informants from the Chinese special boost were all set to be equal to 1, so that they summed to the number of informants in the Chinese special sample. The Chinese special sample was then added to the minority ethnic sample and the weights for the Chinese informants in the combined minority ethnic sample re-scaled to be equal to the best estimate of the proportion of Chinese people in the population, derived from the survey data.
Non-response weighting for the nurse visit and blood sample
For the minority ethnic sample, as well as weights at the interview stage, two further weights were calculated to adjust for non-response to the nurse visit, and for obtaining a blood sample.
e. All rights r
1.6.3 Weighted and unweighted data and bases in the report
All 2004 data in this report are weighted. Both weighted and unweighted bases are given in each table. The unweighted bases show the number of participants involved. The weighted bases show the relative sizes of the various sample elements after weighting, reflecting their proportions in the English population, so that data from different columns can be combined in their correct proportions.
Where data from 2002 or 2003 have been used as a general population comparator, the weightings from those years were applied: selection weights only in 2002, and selection and non-response weighting in 2003.
1.6.4 Age as an analysis variable
Age is a continuous variable but results are presented by age groups. Age in Health Survey for England reports always refers to age at last birthday.
1.6.5 Age standardisation and risk ratios
Age distribution varies considerably between ethnic groups. Data were therefore age-standardised for comparisons between different ethnic groups for factors that vary by age, to examine whether differences observed reflect ethnic differences and not merely
differences in the age profiles of participants.
It should be noted that all analyses in the report are presented separately for men and women. All age standardisation has been undertaken separately within each sex,
expressing male data to the overall male population and female data to the overall female population. When comparing data for the two sexes, it should be remembered that no age standardisation has been introduced to remove the effects of the sexes’ different age distributions.
The direct standardisation method has been used. Instead of showing the
age-standardised figures themselves, the results are presented in the form of risk ratios that compare the prevalence or mean for a given minority ethnic group with the prevalence or mean in the general population, after adjusting for age in each group. For example, a risk ratio of 2.0 means that group is twice as likely as the general population to have that condition, allowing for age differences; a risk ratio of 0.5 means that group is half as likely as the general population to have that condition, allowing for age differences. Risk ratios were calculated separately for men and women. Standard errors of the ratios are also given in the tables.
The age distribution to which each minority ethnic group and the general population are standardised was the same distribution used in analysis of the 1999 survey. This is an artificial distribution that was designed to minimise the percentage increase in standard errors that the standardised weights introduced.
Table 1.4: Adult response in co-operating households
Black Black General
Household income was established by means of a card shown to informants (see Appendix A, Volume 2) on which banded incomes were presented. Information was obtained from the household reference person (HRP) or their partner. Initially they were asked to state their own (HRP and partner combined) aggregate gross income, and were then asked to estimate the total household income including that of any other persons in the household. Household income can be used as an analysis variable, but there has been increasing interest recently in using measures of equivalised income that adjust income to take account of the number of persons in the household. Thus equivalised annual income scores were calculated, and the equivalised annual household income was attributed to all
members of the household, including children. Data in the report are presented in equivalised income tertiles.
Equivalised income tertiles have been calculated separately for two groups of households, one group being Black, Asian and Chinese households, and one being households in the general population. This is because household income amongst minority ethnic groups is, on average, considerably lower than that for the general population. The general population tertiles have been used for analysis of the Irish group. Categorising minority ethnic groups to tertiles based on the general population income distribution would give only very small sample sizes in the highest income tertile for most minority ethnic groups. This would reduce the likelihood of observing associations between ethnicity, income and health. It should be noted that even when tertiles for Black, Asian and Chinese households were calculated, the number of Bangladeshi informants in the highest tertile was relatively small.
1.6.7 Comparison of results from 1999 and 2004
In most cases, data from the 1999 survey are presented for comparison when available. The results shown for 1999 may differ from those presented in the published report for 1999 due to weighting or use of different thresholds. When comparisons are made between data for 2004 and 1999, it should also be noted that the age profiles of minority ethnic groups may differ between the two years. This should be taken into account when interpreting differences in results over time. Comparisons over time will be more valid within specific age groups, therefore, and where base sizes allow, results are presented broken down by age.
1.6.8 Presentation of results
There are four main types of table in this report:
● Comparison of the variable for minority ethnic groups with the general population,
showing weighted observed values, with risk ratios for most variables;
● Age-specific rates for set age-groups within each minority ethnic group, without age
standardisation;
● Observed and age-standardised results by tertile of equivalised household income; and
● Comparisons with 1999, showing age within minority ethnic group.
Commentary in the report highlights differences that are statistically significant at the 95% level. It should be noted that statistical significance is not intended to imply substantive importance.
1.6.9 Availability of unpublished data
As with the previous surveys, an anonymised copy of the 2004 Health Survey for England data will be deposited at The Data Archive at the University of Essex. Copies of the data files can be obtained for specific research projects from the Archive:
www.data-archive.ac.uk
e. All rights r
1.7 Content of this report
Volume 1
Chapter 2 Self-reported health and psychosocial well-being
Chapter 3 Cardiovascular disease and diabetes
Chapter 4 Use of tobacco products
Chapter 5 Alcohol consumption
Chapter 6 Anthropometric measures, overweight, and obesity
Chapter 7 Blood pressure
Chapter 8 Physical activity
Chapter 9 Eating habits
Chapter 10 Blood analytes
Chapter 11 Complementary and alternative medicines and therapies (CAM)
Chapter 12 Children’s health
Volume 2
Chapters 1-9 Survey method and response: A detailed account of the survey design and response rates; sampling errors; analysis of non-response; description of weighting procedures; information on laboratory techniques and quality control of blood analytes and salivary cotinine.
Appendix A Questions asked by interviewers and nurses and copies of other key fieldwork documents
Appendix B Protocols for measurements
Appendix C Summary of the system for classifying prescribed medicines.
Appendix D Glossary
Appendix E Weighting outlines
References and notes
1 Erens B, Primatesta P, Prior G (eds). Health Survey for England. The Health of Minority Ethnic Groups ’99.
London: TSO, 2001.
2 Aspinall P, Jacobson B. Ethnic disparities in health and healthcare. London: London Health Observatory,
2004.
3 Sproston K, Pitson L, Whitfield G, Walker E. Health and Lifestyles of the Chinese Population in England.
e. All rights r
e
served
Self-reported health
and psychosocial
well-being
Lucy Natarajan
Self-reported general health
● In the general population 6% of men and 7% of women reported bad or very bad general health, and 77% of men and 74% of women reported good or very good health.
● Bangladeshi and Pakistani men and women, and Black Caribbean women, were more likely to report bad or very bad health than the general population. In relation to the general population (set at 1.0) the risk ratios for bad or very bad health were 3.77 for Bangladeshi men, 4.02 for Bangladeshi women, 2.33 for Pakistani men, 3.54 for Pakistani women, and 1.90 for Black Caribbean women.
● Among the general population, there was no change in the prevalence of bad or very bad self-reported general health between 1999 and 2004. The same was true for all minority ethnic groups, with the exception of Indian women, where the prevalence of bad or very bad health decreased to 8% in 2004 from 12% in 1999.
Longstanding illness and limiting longstanding illness
● In the general population 43% of men and 47% of women reported longstanding illness, and 23% of men and 27% of women reported limiting longstanding illness. These were around the same prevalences as found in previous years.
● Pakistani women (risk ratio of 1.60) and Bangladeshi men (risk ratio of 1.52) were more likely than those in the general population to report a limiting longstanding illness.
● The levels of longstanding illness and limiting longstanding illness were significantly higher for Pakistani women in 2004 than they were in 1999. For this group the prevalence of longstanding illness rose from 32% to 41%, and the prevalence of limiting longstanding illness rose from 23% to 30%.
Acute sickness
● Among the general population, 14% of men and 19% of women reported that they had had an acute sickness in the past two weeks. Pakistani men and women were more likely to report acute sickness than the general population, with risk ratios of 1.42 and 1.39 respectively.
GHQ12
● The prevalence of high GHQ12 scores among the general population was lower in 2004 (11% for men and 15% for women) than in 1999 (15% for men and 19% for women), this was also true for Irish and Bangladeshi men and women, and Black Caribbean and Indian women.
Social support
● A minority (16% of men and 11% of women) of the general population reported a severe lack of support. Prevalence of severe lack of social support was much higher among men and women in all minority ethnic groups, except Irish men and women. This was particularly marked among the Pakistani men (38%) and women (30%) and Bangladeshi men (35%) and women (33%).
2
2.1 Introduction
This chapter covers self-reported general health, acute sickness, longstanding illness, limiting longstanding illnesses, psychosocial measures (GHQ12 and perceived social support), and prescribed medicines.
These are subjective measures, and the survey included people with a variety of first languages. Therefore, it should be noted that issues of culture and interpretation may influence the survey results. The meanings and values that each minority ethnic group and the general population give to the question terms are not necessarily identical. Moreover, subjective health assessments do not necessarily correspond with medical diagnoses, or prescriptions.
2.2 Self-reported general health
2.2.1 Self-reported general health, by minority ethnic group
Informants were asked to rate their general health selecting one of five categories: very good, good, fair, bad, or very bad. Results are presented for the best two categories
combined (‘good or very good’) and the worst two categories combined (‘bad or very bad’).
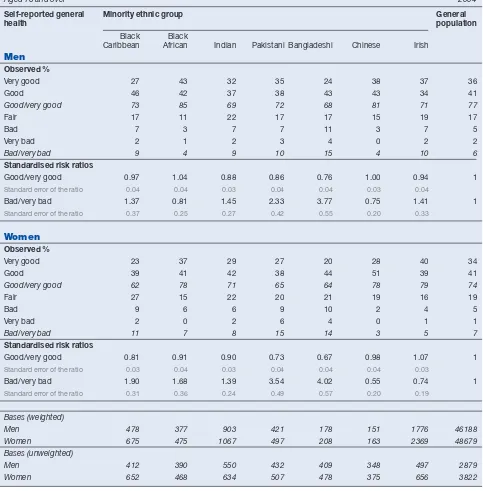
Among the general population, the levels of general health reported by men and women were the same as in the previous HSE year. Around three quarters of the general population (77% of men and 74% of women) reported good or very good health, and 6% of men and 7% of women reported bad or very bad health. Table 2.1
Overall the minority ethnic groups followed this pattern, with the majority of people reporting good or very good general health, and a much lower proportion reporting bad or very bad health.
Age-standardised risk ratios were analysed in order to control for differences in the age profiles of different ethnic groups (since age is related to health outcomes and behaviours). See Chapter 1 for more information. As in 1999, Bangladeshi and Pakistani men and women and Black Caribbean women were more likely to report bad or very bad health than the general population. In relation to the general population the risk ratios for bad or very bad health were 3.77 for Bangladeshi men, 4.02 for Bangladeshi women, 2.33 for Pakistani men, 3.54 for Pakistani women, and 1.90 for Black Caribbean women. Chinese women were the only group less likely to report bad or very bad health (with a risk ratio of 0.55) than
the general population. Figure 2A
Self-reported bad or very bad general health, by minority ethnic group
Men Women
Figure 2A
As with previous HSE reports, levels of bad or very bad self-reported health increased with age. In the general population, 2% of men and women aged 16-34 reported bad or very bad health, and this proportion rose to 6% for men and women aged 35-54, and 12% of
men and women aged 55 and older. Table 2.2
As with the general population, the prevalence of bad or very bad health increased with age among minority ethnic groups. As in 1999, the association of bad or very bad self-reported health with older age was strongest in the Bangladeshi and Pakistani groups. The
proportion reporting bad or very bad health in the oldest age group was 34% for Pakistani men, 45% for Pakistani women, 53% for Bangladeshi men and 44% for Bangladeshi women, although the base size for Bangladeshi men is small.
2.2.3 Comparison of self-reported general health in 1999 and 2004
Among the general population, there was no change in the prevalence of bad or very bad self-reported general health between 1999 and 2004. The same was true for all minority ethnic groups, with the exception of Indian women, where the prevalence of bad or very bad health decreased to 8% in 2004 compared with 12% in 1999. Table 2.3, Figure 2B
2.2.4 Self-reported general health, by household income
Equivalised household income is a measure of household income that takes account of the number of persons in a household. The same strong association found in previous years between income and self-reported health was seen in 2004. Those in the lowest income tertile were more likely to report bad or very bad health than those in the middle and highest tertile. In the general population the risk ratios for the highest, middle and lowest tertile, respectively, were 0.37, 1.20 and 2.44 for men, and 0.37, 1.20 and 2.44 for women. A similar relationship was seen in most of the minority ethnic groups for both men and women, but this is a tentative conclusion due to the small base sizes in some tertiles.
Table 2.4
2.3 Self-reported longstanding illness and limiting
longstanding illness
2.3.1 Prevalence of self-reported longstanding illness, by minority ethnic group
Since 1991 the prevalence of longstanding illness, and since 1996 limiting longstanding illnesses, have been measured. Longstanding illnesses are illnesses, disabilities and
e. All rights r
e
served
Black
Caribbean Indian PakistaniBangladeshiChineseIrish Caribbean Indian PakistaBlack
ni
BangladeshiChineseIrish
Comparison of self-reported bad or very bad general health in 1999 and 2004
Men Women Per cent Figure 2B 0 2 4 6 8 10 12 14 16 18 20 0 2 4 6 8 10 12 14 16 18 20 1999 2004 General
infirmities that have affected or are likely to affect a person over a period of time. People who said they had a longstanding illness were asked if their activities were limited in any way by the longstanding illness, and such illnesses are classified as ‘limiting longstanding illness’.
In the general population 43% of men and 47% of women reported a longstanding illness, and 23% of men and 27% of women reported a limiting longstanding illness. These were around the same prevalences as found in previous years.
Pakistani women were more likely than the general population to report a longstanding illness, with a risk ratio of 1.17. Black African and Chinese men and women and Indian women were less likely than the general population to report a longstanding illness. Their risk ratios as compared with the general population were 0.67 for Black African men, 0.66 for Black African women, 0.61 for Chinese men and women, and 0.73 Indian women. For the other minority ethnic groups, the levels reporting a longstanding illness were around the same as in the general population. Table 2.5, Figure 2C
2.3.2 Prevalence of self-reported limiting longstanding illness, by minority ethnic group
Pakistani women (risk ratio of 1.60) and Bangladeshi men (risk ratio of 1.52) were more likely than those in the general population to report a limiting longstanding illness. In contrast, Black African men and Chinese men and women were all less likely than the general population to report having a limiting longstanding illness. The risk ratios for having limiting longstanding illnesses were 0.63 for Black African men, 0.57 for Chinese men and 0.46 for
Chinese women. Table 2.5
Black CaribbeanBlack AfricanIndian PakistaniBangladeshiChineseIrish
Longstanding illness, by minority ethnic group
Men Women
Risk ratio, logarithmic scale
Figure 2C
2.0
0.5
General population = 1.0. Error bars indicate 95% confidence limits.
0.10 1.0 10.0
Black CaribbeanBlack AfricanIndian PakistaniBangladeshiChineseIrish 2.0
0.5
longstanding illness, in 1999 and 2004
The prevalence of longstanding illness and limiting longstanding illness among men and women in the general population was around the same as in 1999. For Indian women, the levels of longstanding illness and limiting longstanding illness reported were significantly lower in 2004 than they were in 1999. For that group, the prevalence of longstanding illness fell from 37% to 30%, and limiting longstanding illness fell from 25% to 19%. By contrast, for Pakistani women, the levels of longstanding illness and limiting longstanding illness were significantly higher in 2004 than they were in 1999. For that group, the prevalence of longstanding illness rose from 32% to 41%, and limiting longstanding illness rose from 23%
to 30%. Table 2.6
2.3.5 Type of self-reported longstanding illness, by minority ethnic group
Informants with longstanding illness also reported the details of their condition. This information was used to categorise the types of illnesses according to the ICD10 coding system, by rates per thousand reporting. As in the 1999 report the three most common types of condition for men and women in the general population were disorders of the musculoskeletal system (173 and 208 per thousand), the heart and circulatory system (123 and 118 per thousand), and the respiratory system (96 and 93 per thousand).
Disorders of the heart and circulatory system, and the respiratory system were also among the three most common types of condition for all the minority ethnic groups. The other most common type of condition was endocrine and metabolic disorders for Black Caribbean, Bangladeshi and Indian men and women, Black African men, and Chinese women, and disorders of the musculoskeletal system for the rest. Musculoskeletal disorders were the most common condition for all groups except Chinese men.
For most minority ethnic groups the levels of the four most common conditions were around the same as for men and women in the general population, with some exceptions. Bangladeshi men (risk ratio of 1.66) and women (risk ratio of 2.00) and Pakistani (1.69) and Black Caribbean women (1.48) were more likely to report disorders of the heart and
circulatory system than the general population. Pakistani men (risk ratio of 2.01) and women (risk ratio of 2.51) and Bangladeshi men (2.63) and women (1.79), as well as Indian men (1.53) and Black Caribbean women (1.59) were more likely to report disorders of the endocrine and metabolic system than the general population. Chinese men (risk ratio of 0.48) and women (risk ratio of 0.45) and Black African men (0.46) were less likely to report disorders of the musculoskeletal system than the general population. Black African men (0.36) and women (0.60), and Indian (0.57) and Chinese women (0.40) were less likely to report disorders of the respiratory system than the general population. Table 2.7
2.3.6 Self-reported longstanding illness, by household income
As in previous years there was an inverse association between longstanding illness and equivalised household income for both men and women in the general population. For men in the highest income tertile, the prevalence of longstanding illness was 38%, compared with around 50% in the other two categories. For women in the highest income tertile the prevalence of longstanding illness was 39%, compared with 56% in the middle and 54% in the lowest category. The same pattern could be seen for Black Caribbean, Indian and Irish
groups. Table 2.8
2.4 Self-reported acute sickness
2.4.1 Prevalence of self-reported acute sickness, by minority ethnic group
Acute sickness was defined as a person having to cut down on their usual domestic, work-related or other activities due to sickness in the two weeks prior to the interview. The number of days on which activities were affected was recorded as an indicator of the severity of the acute sickness.
e. All rights r
e
Among the general population, 14% of men and 19% of women reported that they had had any acute sickness in the past two weeks. Chinese men and women were significantly less likely than the general population (with risk ratios of 0.64 for men and 0.56 for women) to report acute sickness. The only other groups significantly different from the general population were Pakistani men and women, who were more likely to report acute sickness, with risk ratios of 1.42 and 1.39 respectively. Table 2.9, Figure 2D
Among the general population, the duration that acute sickness most commonly affected informants’ usual activities was a two week period, with 6% of men and 7% of women having their usual activities affected for the whole fourteen days. The average number of days on which the general population had been affected was eight (8.1 for men and 7.9 for women).
2.4.2 Self-reported acute sickness, by age
The prevalence of acute sickness increased with age. In the general population, 11% of men and 13% of women aged 16-34 reported acute sickness, and this proportion rose to 17% of men and 22% of women aged 55 and older. The same pattern was seen among all
minority ethnic groups. Table 2.10
2.4.3 Self-reported acute sickness, by household income
As in previous years, an inverse association was found between equivalised household income and acute sickness, with prevalence of sickness increasing as income decreased. In the general population, 13% of men and 15% of women in the highest income tertile reported acute sickness. These proportions rose to 17% of men and 26% of women in the lowest income tertile. The same pattern was also seen in the Black Caribbean, and Irish
Black CaribbeanBlack AfricanIndian PakistaniBangladeshiChineseIrish
Acute sickness, by minority ethnic group
Men Women
Risk ratio, logarithmic scale
Figure 2D
2.0
0.5
General population = 1.0. Error bars indicate 95% confidence limits.
0.10 1.0 10.0
Black CaribbeanBlack AfricanIndian PakistaniBangladeshiChineseIrish 2.0
0.5
indicating possible psychiatric disorder.
The GHQ12 was also used in 1999, and it should be noted that this instrument has been validated for a general population but not for specific minority ethnic groups. Subjectivity in individual interviews where informants’ interpretations of the questions are informed by cultural factors may affect comparability between minority ethnic groups. This should be noted particularly for the analysis of psychosocial health, since cultural norms surrounding the description of mental health problems are known to vary.
2.5.2 GHQ12 score by minority ethnic group
In the general population, women were more likely than men to have a high GHQ12 score (15% compared with 11%). In 1999, women also had higher levels of high GHQ12 scores than men in the general population and in the Black Caribbean, Indian, Pakistani and Chinese groups. By contrast, in 2004 there was little variation by gender among the minority ethnic groups, with the exception of Black Africans. 19% of Black African women scored 4 or more compared with 11% of Black African men. Table 2.12
In 1999, Bangladeshi and Pakistani men and women had a higher relative risk of a high GHQ12 score than the general population. Differences for these groups were replicated in the 2004 risk ratios, for Pakistani men (1.56) and women (1.73) and Bangladeshi men (1.83) but not for Bangladeshi women. In 1999, Chinese men and women were found to have lower rates of high GHQ12 scores than the general population, but this difference was not replicated in the 2004 data. Table 2.13, Figure 2E
2.5.3 Comparison of prevalence of high GHQ12 score in 1999 and 2004
The prevalence of high GHQ12 scores among the general population was lower in 2004 than in 1999. A similar decrease in rates of high GHQ12 score was also seen for some of the minority ethnic groups: Irish and Bangladeshi men and women, and Black Caribbean and Indian women. For Chinese men, in contrast, the prevalence was higher in 2004 than it
had been in 1999. Table 2.13
2.5.4 GHQ12 score, by household income
In the general population, a relationship was found between income and prevalence of high GHQ12 scores. Those in the highest income tertile were least likely to have a high GHQ12 score. Risk ratios for men in the general population were 0.75 in the highest tertile, this rose
e. All rights r
e
served
Black CaribbeanBlack AfricanIndian PakistaniBangladeshiChineseIrish
High GHQ12 scores, by minority ethnic group
Men Women
Risk ratio, logarithmic scale
Figure 2E
2.0
0.5
General population = 1.0. Error bars indicate 95% confidence limits.
0.10 1.0 10.0
Black CaribbeanBlack AfricanIndian PakistaniBangladeshiChineseIrish 2.0
0.5
to 1.17 in the middle tertile and 1.72 in the lowest tertile. For women in the highest tertile the risk ratio was 0.80, rising to 1.06 in the middle tertile and 1.51 in the lowest tertile.
This pattern was also seen amongst some of the minority ethnic groups. A lower prevalence of high GHQ12 scores was found in the highest income tertile amongst Irish (risk ratio of 0.62) and Indian (risk ratio of 0.58) men, and Black Caribbean (risk ratio of 0.83) women. The risk ratios rose significantly in the middle and lowest tertiles for those groups (with risk ratios in the lowest tertiles of 2.52 for Irish men, 2.22 for Indian men, and 1.55 for Black Caribbean women) but not for any of the other groups. Table 2.14
2.5.5 Perceived social support, by minority ethnic group
Perceptions of social support were measured via a battery of questions, which have been included in most HSE years. The questions ask informants to rate the physical and emotional aspects of support they receive from family and friends, by comparing them to positive scenarios. The ratings are given on a three point scale (not true for me, partly true for me, and certainly true for me). A social support score, from 0-21, is then calculated. Scores are classified as follows: 0-17 or ‘severe lack of support’, 18-20 ‘some lack of support’, and 21 ‘no lack of support’.
In 2004 most people in the general population (57% of men and 67% of women) reported no lack of support, and only a minority (16% of men and 11% of women) a severe lack of support. Prevalence of severe lack of social support was much higher among men and women in all minority ethnic groups, except Irish men and women. This was particularly marked among the Pakistani men (38%) and women (30%) and Bangladeshi men (35%) and women (33%).
In previous HSE reports, men have had higher prevalence of severe lack of social support than women. This pattern was also seen in 2004 among the general population, and Indian,
Pakistani and Irish groups. Table 2.15
The risk ratios of reporting severe lack of support, compared with men and women in the general population, were higher for men and women in all minority ethnic groups except
Irish. Figure 2F
Severe lack of social support, by minority ethnic group
Men Women
[image:30.595.66.407.460.696.2]Risk ratio, logarithmic scale
Figure 2F
2.0
0.5 1.0 10.0
2.0
e. All rights r
e
served
Caribbean women, and Irish and Pakistani men. Table 2.16
2.5.7 Perceived social support, by household income
A clear relationship was found between household income and severe lack of social support for men and women in the general population, and Black African, Indian and Irish minority ethnic groups. Those in the lowest tertile were more likely to report a severe lack of support. A similar association was also found in the 1999 HSE report for Black Caribbean, Pakistani, Chinese and Irish men and women. Table 2.17
2.6 Prescribed
medications
During the nurse visit, informants (who were not pregnant) were asked whether they were taking any medicines, pills, syrups, ointments, puffers or injections which a doctor or nurse had prescribed for them.
The prevalence of taking prescribed medication was unchanged for men and women in the general population since 2003. Just under half of women (48%) and two fifths of men (40%) were taking prescribed medication in 2004. The average number of prescribed medicines among men and women (3.0 for both in 2004) in the general population who were taking any prescribed medication was also unchanged from 2003. This was also true for the average number of prescribed medicines amongst all men (1.2) and women (1.5) in the general population.
Comparing the risk ratios of taking four or more prescribed medicines across minority ethnic groups, most groups were around the same level as men and women in the general population. The exceptions were Pakistani and Bangladeshi women and, to a lesser extent, Indian men. These groups were more likely to be taking four or more prescribed
medications than the general population: 2.35 for Pakistani women, 2.50 for Bangladeshi
women, and 1.78 for Indian men. Table 2.18
References and notes
2.16 Comparison of perceived social support in 2004 and 1999, by minority ethnic group and sex
2.17 Perceived social support, by equivalised household income within minority ethnic group and sex
2.18 Number of prescribed medicines, by minority ethnic group and sex
Tables
2.1 Self-reported general health, by minority ethnic group and sex
2.2 Self-reported general health, by age within minority ethnic group and sex
2.3 Comparison of bad or very bad self-reported general health in 2004 and 1999, by age within minority ethnic group and sex
2.4 Self-reported general health, by equivalised household income within minority ethnic group and sex
2.5 Self-reported longstanding illness and limiting longstanding illness, by minority ethnic group and sex
2.6 Comparison of self-reported longstanding illness and limiting longstanding illness in 2004 and 1999, by age within minority ethnic group and sex
2.7 Rate per thousand reporting longstanding illness conditions, by minority ethnic group and sex
2.8 Self-reported longstanding illness, by
equivalised household income within minority ethnic group and sex
2.9 Self-reported acute sickness in the last two weeks, by minority ethnic group and sex
2.10 Self-reported acute sickness in the last two weeks, by age within minority ethnic group and sex
e. All rights r
e
served
Self-reported general health, by minority ethnic group and sex
Aged 16 and over 2004
Self-reported general Minority ethnic group General
health population
Black Black
Caribbean African Indian Pakistani Bangladeshi Chinese Irish Men
Observed %
Very good 27 43 32 35 24 38 37 36
Good 46 42 37 38 43 43 34 41
Good/very good 73 85 69 72 68 81 71 77
Fair 17 11 22 17 17 15 19 17
Bad 7 3 7 7 11 3 7 5
Very bad 2 1 2 3 4 0 2 2
Bad/very bad 9 4 9 10 15 4 10 6
Standardised risk ratios
Good/very good 0.97 1.04 0.88 0.86 0.76 1.00 0.94 1
Standard error of the ratio 0.04 0.04 0.03 0.04 0.04 0.03 0.04
Bad/very bad 1.37 0.81 1.45 2.33 3.77 0.75 1.41 1
Standard error of the ratio 0.37 0.25 0.27 0.42 0.55 0.20 0.33
Women
Observed %
Very good 23 37 29 27 20 28 40 34
Good 39 41 42 38 44 51 39 41
Good/very good 62 78 71 65 64 78 79 74
Fair 27 15 22 20 21 19 16 19
Bad 9 6 6 9 10 2 4 5
Very bad 2 0 2 6 4 0 1 1
Bad/very bad 11 7 8 15 14 3 5 7
Standardised risk ratios
Good/very good 0.81 0.91 0.90 0.73 0.67 0.98 1.07 1
Standard error of the ratio 0.03 0.04 0.03 0.04 0.04 0.04 0.03
Bad/very bad 1.90 1.68 1.39 3.54 4.02 0.55 0.74 1
Standard error of the ratio 0.31 0.36 0.24 0.49 0.57 0.20 0.19
Bases (weighted)
Men 478 377 903 421 178 151 1776 46188
Women 675 475 1067 497 208 163 2369 48679
Bases (unweighted)
Men 412 390 550 432 409 348 497 2879
[image:33.595.59.542.91.582.2]Table 2.2
Self-reported general health, by age within minority ethnic group and sex
Aged 16 and over 2004
Self-reported Age group general health
Men Women
All All
16-34 35-54 55+ men 16-34 35-54 55+ women
% % % % % % % %
Black Caribbean
Very good 27 37 14 27 29 26 12 23
Good 58 46 34 46 50 40 23 39
Good/very good 85