Original Article
Long noncoding RNA GHET1 promotes the development
of bladder cancer
Lin-Jin Li1, Jian-Long Zhu1, Wen-Shuo Bao1, Da-Ke Chen1, Wei-Wen Huang1, Zhi-Liang Weng2
1Department of Urology, The Third Clinical Institute Affiliated to Wenzhou Medical University (Wenzhou People’s Hospital), Wenzhou, China; 2Department of Urology, The First Affiliated Hospital of Wenzhou Medical University, Wenzhou, China
Received August 24, 2014; Accepted September 8, 2014; Epub September 15, 2014; Published October 1, 2014
Abstract: In spite of the advances in the diagnosis and treatment of bladder cancer, the prognosis of bladder cancer remains relatively poor. As a result, it is vital to identify novel diagnostic and prognostic marker of bladder cancer. A growing volume of literature has implicated the vital role of long noncoding RNA in the development of cancer.
GHET1, a recently identified lncRNA, was initially characterized in gastric cancer. However, its role in bladder cancer
remains largely unknown. In this study, we demonstrated that GHET1 was upregulated in bladder cancer tissues
compared to adjacent normal tissues and its over-expression correlates with tumor size, advanced tumor and lymph
node status, and poor survival. GHET1 knockdown suppressed the proliferation and invasion of bladder cancer cells in vitro. In the meantime, inhibition of GHET1 reversed the epithelial-mesenchymal-transition in bladder cancer cell line. Taken together, our study suggests that the potential use of GHET1 as a prognostic marker and therapeutic target of bladder cancer.
Keywords: Long noncoding RNA, bladder cancer, GHET1, prognosis, proliferation, epithelial-mesenchymal-transi-tion
Introduction
Bladder cancer is the ninth most common can-cer worldwide [1]. The majority of malignant bladder tumors are urothelial cell carcinomas evolved from urothelium. About 40% of the patients with bladder cancer experience multi-ple recurrences, which has a significant impact on the quality of life [2]. Bladder cancer is a het-erogeneous disease which can be categorized into the low-grade papillary tumors and the high-grade invasive tumors. Invasive bladder tumor is more aggressive and patients with invasive disease have a much worse prognosis, with a 5-year survival rate around 50% [3]. Despite the recent advances in the early detec-tion and more frequent surgical treatment, the mortality has not changed markedly [4]. Therefore, it is vital to clarify the molecular mechanism of the development of bladder can-cer for the advances in novel diagnostic marker and therapeutic targets.
It is well known that protein-coding genes account for only about 2% of the human genome, whereas the vast majority of
tran-scripts are non-coding RNAs [5]. The ncRNAs include not only well-studied microRNAs and other noncoding transcripts less than 200 nucleotides (nt) but also a large class of long (> 200 nt) ncRNAs (lncRNAs), which have emerged as a new layer of cell biology [6, 7]. Although researches of miRNAs have dominated the field of RNA regulation in bladder cancer [8-10], accumulating evidence has indicated that long noncoding RNA may also play an important role in the development of cancer [11-13].
A recently identified long noncoding RNA, named gastric carcinoma high expressed tran-script 1 (GHET1, AK123072), was upregulated in gastric cancer and the high expression level of this lncRNA correlates with tumor size, tumor invasion and poor survival [14]. Yang et al. [14] demonstrated that GHET1 promotes the prolif-eration via increasing c-Myc mRNA stability and expression. However, the role of GHET1 in blad-der cancer is elusive.
Type Culture Collection (ATCC, Manassas, VA). All cell lines have been passaged for fewer than 6 months.
Human tissue specimens
The study were undertaken with the under-standing and written consent of each subject. The study methodologies conformed to the standards set by the declaration of Helsinki. This study was approved by the Human Ethics Committee of the Third Medical College of Wenzhou City affiliated to Wenzhou Medical University (Wenzhou, China). Eighty bladder cancer tissues and adjacent non-tumor bladder tissues were obtained from patients who underwent resection of the primary bladder cancer at the Third Medical College of Wenzhou City affiliated to Wenzhou Medical University Hospital between 2009 and 2011 and were diagnosed with bladder cancer based on histo-pathological evaluation. No anti-cancer treat-ments were given before biopsy collection. Complete clinicopathological data of the patients were available. No selection bias was introduced in bladder cancer samples collec-tion for this study. The overall survival (OS) was defined as the interval between surgery and death or the last follow-up examination.
Quantitative real-time PCR
Total RNA from tissues or cells was extracted using Trizol reagent (Invitrogen, CA). RNA was reverse transcribed to cDNA by a Reverse Transcription Kit (Takara, Dalian, China). The cDNA template was amplified by real-time RT-PCR using the SYBR® Premix Dimmer Eraser kit (TaKaRa, Dalian, China). Real-time PCR was performed using a standard SYBR Green PCR kit (Toyobo, Osaka, Japan) protocol on Applied Biosystems 7300 Real Time PCR system (Applied Biosystems, Foster City, CA) according to the instructions.
Glyceraldehyde-results were analyzed and expressed relative to CT (threshold cycle) values, and then converted to fold changes.
Small interfering RNA (siRNA)
siRNA specifically targeting GHET1 was synthe -sized by Invitrogen. The GHET1 specific siRNA sequences were as follows: GHET1 siRNA (siGHET-1): CGGCAGGCATTAGAGATGAACAGCA. Allstars Negative Control siRNA were purchased from Qiagen, Hilden, Germany. Cells were grown on six-well plates to 70% confluency and trans -fected using Lipofectamine 2000 (Invitrogen) according to the manufacturer’s instructions. Forty-eight hours after transfection, cells were harvested for qRT-PCR or western blot ana- lyses.
Cell proliferation assay
Cell proliferation assays were performed using the CCK-8 assay kits (Roche) following the man-ufacturer’s instructions. EdU immunofluores -cence staining was performed using an EdU kit (Roche).
Flow-cytometric analysis
Cells transiently transfected with NC or si-GHET1 were harvested 48 h after transfection. Cells were treated with PI (50 mg/L) for 30 min at 4°C in the dark. The cell-cycle profiles were assayed at 488 nm on an EPICS 752 flow cytometer (Coulter, Hialeah, FL) equipped with MPLUS software (Phoenix 140 Flow Systems, San Diego, CA). Data were expressed as per-centage distribution of cells in G0/G1, S and G2/M phases of the cell cycle.
Cell migration and invasion assay
migra-tion assay, 1 × 10⁵ cells were plated on the
non-coated membrane in the top chamber (24-well insert; 8-mm pore size, Corning Costar Corp). Cells were plated in medium without serum. Medium supplemented with 10% FBS was used as a chemo-attractant in the lower chamber. For invasion assay, the upper cham-ber was pre-coated with Matrigel (Sigma, USA). After 24 h of incubation, cells that did not migrate or invade through the pores were removed using a cotton swab, whereas the
body at 4°C overnight. The cells were then washed and incubated with Alexa Fluor 633-conjugated goat anti-rabbit IgG for 1 hour. The nuclei were stained with 4.6-diamidino-2-phenylindole (DAPI). Sections were visualized by fluorescence microscopy.
Western blot analysis
[image:3.612.94.518.73.206.2]Cells were lysed using RIPA buffer (Pierce) con-taining protease inhibitors cocktail (Roche). Figure 1. GHET1 expression in bladder cancer cell lines, cancer tissues and its clinical significance. A: qRT-PCR
analysis of GHET1 expression levels in bladder cancer cell lines (RT4, RT112, 253J and T24) compared with the nor-mal human uroepithelial cell line (CRL-9520). B: Difference in expression levels of GHET1 between bladder cancer
tissues and matched non-tumor bladder tissues. The expression of GHET1 was normalized to GADPH. The statistical differences between samples were analyzed with paired samples t-test (n = 80, P < 0.0001). C: Patients with high levels of GHET1 expression showed reduced overall survival times compared with patients with low levels of GHET1 expression (P = 0.0083, log-rank test). *P < 0.05; **P < 0.01.
Table 1. Correlation between GHET1 expression and clini-copathologic characteristics
Clinicopathologic
characterisitcs patients (%)Number of Relative expres-sion of GHET1a P valueb
Gender
Male 43 (53.75%) 5.33 0.66
Female 37 (46.25%) 5.56 Age
< 60 32 (40.00%) 5.01 0.17
≥ 60 48 (60.00%) 5.76 Number of tumors
single 66 (82.50%) 4.97 0.09
multiple 14 (17.50%) 5.98 Tumor status
Ta-T1 65 (81.25%) 4.17 0.005
≥ T2 15 (18.75%) 8.12 Grade
G1/2 31 (38.75%) 3.45 0.003
G3 49 (61.25%) 7.91
aMedian of relative expression; bP < 0.05 was considered significant (Mann-Whitney U test).
cells on the lower surface were fixed with methanol and stained with 0.05% crystal violet. Finally, cells were count-ed under a microscope and the rela-tive number was calculated. Experi- ments were independently repeated in triplicate.
Immunofluorescence analysis
[image:3.612.91.345.332.555.2]-at 4°C overnight, the blots were incub-ated with Horseradish peroxidase-conjugated goat anti-rabbit IgG antibody. Antibody-bound proteins were detected by BeyoECL Plus kit. β-actin was used as a loading control for Western blots.
Statistical analysis
All data were presented as mean ± standard error from three independent experiments. All statistical analyses were performed using SPSS 17.0 (SPSS, Chicago, USA). The gene expression level of GHET1 in tumors was com-pared with adjacent normal tissues utilizing the paired sample t-test, whereas the association between GHET1 expression and clinical charac-teristics was evaluated using the Mann-Whitney test. Survival curves were plotted with the Kaplan-Meier method, and the long-rank com-parison was carried out to assess differences between stratified survival groups using the median value as the cutoff. The expression dif-ferences between cell lines, the expression changes after transfection, cell cycle, cell migration and invasion assays were analyzed using independent samples t-test. All tests per-formed are two sided. Differences were consid-ered statistically significant at P < 0.05.
Results
Upregulation of GHET1 in bladder cancer cell
lines
To determine the expression profile of GHET1 in bladder cancer, we at the first place measured the expression level of GHET1 in bladder can-cer cell lines. When normalized to human uro -epithelial cell line (CRL-9520), the expression level of GHET1 was upregulated in bladder can-cer cell lines (RT4, RT112, 253J and T24) (Figure 1A).
expression level of GHET1 and the clinicopatho-logical characteristics of the 80 bladder cancer patients. Correlation regression analysis sh- owed that increased GHET1 expression corre-lated with advanced tumor status (P = 0.005) and grade (P = 0.003). However, the GHET1 expression level was not associated with other parameters such as age and gender (Table 1). We further determined whether the expression level of GHET1 correlated with the clinical out-come of bladder cancer patients. Kaplan-Meier survival analysis and log-rank tests using patient postoperative survival were conducted to further evaluate the correlation between GHET1 and prognosis of patients with bladder cancer. According to the median ratio of rela-tive GHET1 expression (5.44) in tumor tissues, the 80 bladder cancer patients were classified into two groups: High-GHET1 group (n = 39): GHET1 expression ratio ≥ median ratio; and Low-GHET1 group (n = 41): GHET1 expression ratio ≤ median ratio. Kaplan–Meier survival analysis showed that high GHET1 expression in bladder carcinoma tissues is significantly asso -ciated with worse overall survival (P = 0.0083, log-rank test) (Figure 1C). These results sug-gest that GHET1 may play an important role in the progression of bladder cancer.
Knockdown of GHET1 suppressed the prolif -eration of bladder cancer cells
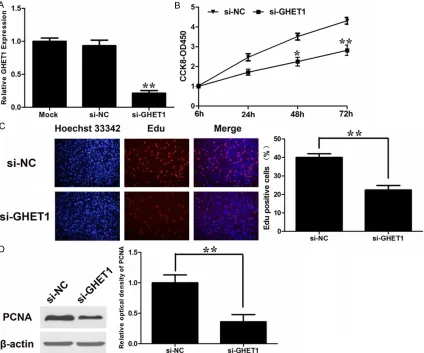
Yang et al. [14] demonstrated the GHET1 pro-moted the proliferation of gastric cancer cells. We would like to explore the effect of GHET1 on bladder cancer cells. The expression level of GHET1 was significantly downregulated in blad -der cancer cell line T24 by si-GHET1 (Figure 2A).
2B). Furthermore, the percentage of EdU-positive cells was reduced with GHET1 knock-down (Figure 2C). Proliferating cell nuclear anti-gen (PCNA) is deemed as one of the most important index to estimate cell proliferation. Consistent the attenuated proliferation, T24 cells had markedly decreased expression of PCNA with GHET1 knockdown (Figure 2D). These data suggest that GHET1 may take a part in the regulation of cell proliferation. To explore the underlying mechanism of prolifera-tion-promoting effect of GHET1 on bladder can-cer cell, we studied the effect of GHET1 knock-down on cell cycle. As demonstrated Figure 3A, knockdown of GHET1 resulted in a blockade of
T24 cells in G0/G1 phase compared to the con-trol cells. It hints that knockdown of GHET1 may inhibit the proliferation of bladder cancers via inducing G0/G1 arrest. To verify our hypothe-sis, we examined the protein levels of G0/G1 arrest markers, p16 and p21 after GHET1 knockdown. The western blot analysis showed that p16 and p21 proteins were increased with GHET1 knockdown (Figure 3B).
GHET1 promoted the invasion of bladder
can-cer cells
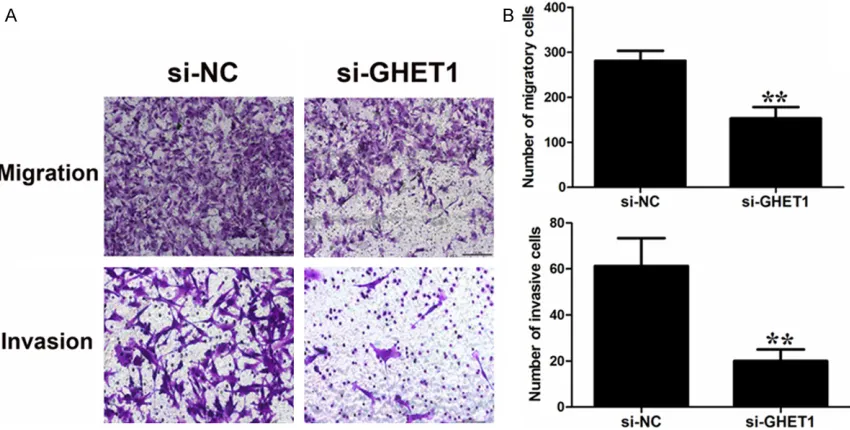
[image:5.612.95.519.73.426.2]As correlation regression analysis showed that increased GHET1 expression correlated with Figure 2. Effect of GHET1 on cell proliferation. (A) qRT-PCR analysis of GHET1 expression following treatment of
T24 cells with specific siRNA targeting GHET1. (B) GHET1 silencing inhibited DNA replication in bladder cancer cells compared to controls as determined by the EdU incorporation assay, Original magnifications: ×200. EdU-positive cell counts were analyzed by using software of the light microscope (C) T24 cells were transfected with si-GHET1
or si-NC. CCK8 assays were performed to determine the proliferation of T24 cells. Data represent the mean ± S.D. from three independent experiments. (D) Changes in the proliferation marker, PCNA, were shown by western blotting
Figure 3. Knockdown of GHET1 may inhibit the proliferation of bladder cancers via inducing G0/G1 arrest. A: Cell cycle analysis determined the relative cell numbers in each cell-cycle phase after propidium iodide staining of GHET1-downregulated T24 cells. Numbers inside bars represent percentages of cells in each phase. B: T24 cells, treated as described in Figure 2C, 2D were collected for western blotting analysis of the G0/G1 arrest markers, p16
and p21. Relative protein expression was identified (n = 3). Data represent the mean ± S.D. from three independent experiments. *P < 0.05; **P < 0.01.
Figure 4. Effect of GHET1 on cell migration and invasion. A, B: T24 cells were transfected with GHET1 siRNA or si-NC. Transwell assays were performed to investigate the migratory and invasive ability of bladder cancer cells. Data
represent the mean ± S.D. from three independent experiments. *P < 0.05; **P < 0.01.
and tumor status (P = 0.005), we would like to
[image:6.612.95.520.435.650.2]invasion was observed in T24 cells with GHET1 knockdown (Figure 4).
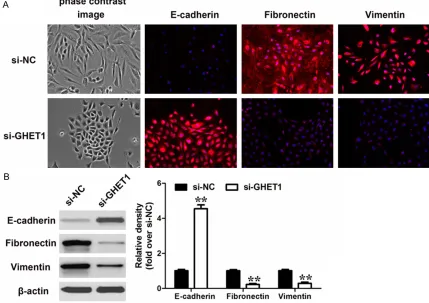
The epithelial-mesenchymal-transition (EMT) process has been known to take a part in the
[image:7.612.93.522.78.381.2]increase in E-cadherin protein level (epithelial marker) after GHET1 knockdown (Figure 5A). Moreover, western blot analysis confirmed the results from the immunofluorescence analysis (Figure 5B).
Figure 5. Effect of GHET1 on the EMT process. A: Phase-contrast images (up) and immunofluorescence images
(down) of T24 cells stained using antibodies against E-cadherin, Fibronectin or Vimentin after transfected with si-GHET1. B: Western-blot analysis of phenotypic markers after GHET1 knockdown in T24 cells. Relative protein
expression was identified (n = 3) and normalized to β-actin. Data represent the mean ± S.D.
Figure 6. Effect of GHET1 on the EMT-related TFs. Western-blot analysis of EMT-related TFs after GHET1 knockdown in T24 cells. Relative protein
ex-pression was identified (n = 3) and normalized to β-actin. Data represent
the mean ± S.D.
[image:7.612.92.368.455.588.2]nomas worldwide. With the advances in the high-throughput gene sequencing analysis, our understanding of bladder cancer pathogenesis has improved through the identification of acti -vating mutations in and amplifications of onco -genes, including MDM2 [16], PIK3CA [17], CDKN2A/B [17], KRAS [18], and inactivating mutations in tumor suppressive genes, such as CDKN1A [16] and p53 [16]. In the past decade, a growing volume of literature has identified a large number of miRNAs that contribute to the progression of bladder cancer [8-10]. However, the mechanism of bladder cancer progression, including the factors that promote cancer cell invasion, proliferation, apoptosis-resistance and chemo-therapy resistance remain largely unknown. Although accumulating evidence has indicated the role of lncRNAs in cancer, only a relatively small proportion of lncRNAs have been characterized. Our study demonstrates that, GHET1, an lncRNA, is clinically and func-tionally relevant to the development of bladder cancer.
GHET1 was initially characterized in gastric cancer and found to promote gastric cancer cell proliferation via increasing c-Myc mRNA stability and expression [14]. Inspired by the observation that GHET1 is associated with the development of gastric cancer, we would like to explore its role in bladder cancer progression. In the present study, we discovered that GHET1 was upregulated in bladder cancer tissues compared to adjacent normal tissues. What’s more, increased GHET1 expression correlated with tumor size and tumor status.
A great reduction in cancer cell proliferation and invasion with GHET1 knockdown was observed. To investigate the underlying mecha-nism through which GHET1 promoted the prolif-eration of gastric cancer cells, we performed
invasion and metastasis, a process in which cells loses an epithelial phenotype and other components of cell junctions and acquire a mesenchymal phenotype [19, 20]. Essential hallmarks of EMT include loss of the E-cadherin expression and increased expression of vimen-tin and fibronecvimen-tin [19]. Previous studies sug -gest that the EMT process is regulated by a set of transcription factors including Snail, Slug, ZEB1 and Twist [20]. Recent studies have indi-cated that long noncoding RNAs can also play a role in the regulation of EMT. For example, HOTAIR promoted EMT by increasing the expression levels of Slug, Snail and Twist [21]. MALAT-1 promoted EMT by activating Wnt sig-naling [22]. Similar regulations have been reported for of BRAF activated non-coding RNA [23] and lncRNA-activated by TGF-b (lncRNA-ATB) [24]. Thus, we examined the expression levels of hallmarks of EMT with GHET1 knock-down. Knockdown of GHET1 downregulated vimentin and fibronectin expression while induced an upregulation of E-cadherin expres-sion, restoring T24 cells to more of an epithelial phenotype. Furthermore, a reduction in the expression of a series of transcription factors that regulate the EMT was observed with GHET1 knockdown. Our results suggest that the inhibitory effect on cell invasion of GHET1 silencing were associated with EMT.
Acknowledgements
The authors thank the Department of patholo-gy of the People’s Hospital of Wenzhou City for the pathology assessments.
Disclosure of conflict of interest
None.
Address correspondence to: Dr. Zhi-Liang Weng, Department of Urology, The First Affiliated Hospital, Wenzhou Medical University, 2 Fuxue Xiang, Wenzhou 325000, People’s Republic of China. Fax:
+86-0577-55578033; E-mail: 2834589118@qq. com
References
[1] Chavan S, Bray F, Lortet-Tieulent J, Goodman M and Jemal A. International Variations in Bladder Cancer Incidence and Mortality. Eur Urol 2014; 66: 59-73.
[2] Egerod FL, Bartels A, Fristrup N, Borre M,
Ørntoft TF, Oleksiewicz MB, Brünner N and
Dyrskjøt L. High frequency of tumor cells with nuclear Egr-1 protein expression in human bladder cancer is associated with disease pro-gression. BMC Cancer 2009; 9: 385.
[3] Wang T, Yuan J, Feng N, Li Y, Lin Z, Jiang Z and Gui Y. Hsa-miR-1 downregulates long non-cod-ing RNA urothelial cancer associated 1 in blad-der cancer. Tumour Biol 2014; [Epub ahead of print].
[4] Rosser CJ, Urquidi V and Goodison S. Urinary biomarkers of bladder cancer: an update and future perspectives. Biomark Med 2013; 7: 779-790.
[5] Kugel JF and Goodrich JA. Non-coding RNAs: key regulators of mammalian transcription. Trends Biochem Sci 2012; 37: 144-151. [6] Dimitrova N, Zamudio JR, Jong RM, Soukup D,
Resnick R, Sarma K, Ward AJ, Raj A, Lee JT, Sharp PA and Jacks T. LincRNA-p21 activates p21 in cis to promote Polycomb target gene ex-pression and to enforce the G1/S checkpoint. Mol Cell 2014; 54: 777-790.
[7] Fachel AA, Tahira AC, Vilella-Arias SA, Maracaja-Coutinho V, Gimba ER, Vignal GM, Campos FS, Reis EM and Verjovski-Almeida S. Expression
analysis and in silico characterization of intron -ic long noncoding RNAs in renal cell carcino-ma: emerging functional associations. Mol Cancer 2013; 12: 140.
[8] Itesako T, Seki N, Yoshino H, Chiyomaru T,
Yamasaki T, Hidaka H, Yonezawa T, Nohata N,
Kinoshita T, Nakagawa M and Enokida H. The microRNA expression signature of bladder
cancer by deep sequencing: the functional
sig-nificance of the miR-195/497 cluster. PLoS
One 2014; 9: e84311.
[9] Xu Y, Zhou M, Wang J, Zhao Y, Li S, Zhou B, Su Z, Xu C, Xia Y, Qian H, Tu X, Xiao W, Chen X, Chen Q and Wang QK. Role of microRNA-27a in down-regulation of angiogenic factor AGGF1 under hypoxia associated with high-grade bladder urothelial carcinoma. Biochim Biophys Acta 2014; 1842: 712-725.
[10] Li S, Xu X, Xu X, Hu Z, Wu J, Zhu Y, Chen H, Mao Y, Lin Y, Luo J, Zheng X and Xie L. MicroRNA-490-5p inhibits proliferation of bladder cancer by targeting c-Fos. Biochem Biophys Res Commun 2013; 441: 976-981.
[11] Yang F, Huo XS, Yuan SX, Zhang L, Zhou WP, Wang F and Sun SH. Repression of the long noncoding RNA-LET by histone deacetylase 3 contributes to hypoxia-mediated metastasis. Mol Cell 2013; 49: 1083-1096.
[12] Huang JF, Guo YJ, Zhao CX, Yuan SX, Wang Y, Tang GN, Zhou WP and Sun SH. Hepatitis B vi-rus X protein (HBx)-related long noncoding RNA (lncRNA) down-regulated expression by HBx (Dreh) inhibits hepatocellular carcinoma
me-tastasis by targeting the intermediate filament
protein vimentin. Hepatology 2013; 57: 1882-1892.
[13] Prensner JR, Chen W, Iyer MK, Cao Q, Ma T, Han S, Sahu A, Malik R, Wilder-Romans K, Navone N, Logothetis CJ, Araujo JC, Pisters LL, Tewari AK, Canman CE, Knudsen KE, Kitabayashi N, Rubin MA, Demichelis F, Lawrence TS, Chinnaiyan AM and Feng FY. PCAT-1, a Long Noncoding RNA, Regulates BRCA2 and Controls Homologous Recom- bination in Cancer. Cancer Res 2014; 74: 1651-1660.
[14] Yang F, Xue X, Zheng L, Bi J, Zhou Y, Zhi K, Gu Y and Fang G. Long non-coding RNA GHET1 pro-motes gastric carcinoma cell proliferation by increasing c-Myc mRNA stability. FEBS J 2014; 281: 802-813.
[15] Rhim AD. Epithelial to mesenchymal transition and the generation of stem-like cells in pancre-atic cancer. Pancreatology 2013; 13: 114-117. [16] Cazier JB, Rao SR, McLean CM, Walker AL,
Wright BJ, Jaeger EE, Kartsonaki C, Marsden L, Yau C, Camps C, Kaisaki P; Oxford-Illumina WGS500 Consortium, Taylor J, Catto JW, Tomlinson IP, Kiltie AE and Hamdy FC. Whole-genome sequencing of bladder cancers re-veals somatic CDKN1A mutations and clinico-pathological associations with mutation bur-den. Nat Commun 2014; 5: 3756.
[17] Ross JS, Wang K, Al-Rohil RN, Nazeer T,
theme in embryonic and cancer cells. Science 2013; 342: 1234850.
[21] Xu ZY, Yu QM, Du YA, Yang LT, Dong RZ, Huang L, Yu PF and Cheng XD. Knockdown of long non-coding RNA HOTAIR suppresses tumor in-vasion and reverses epithelial-mesenchymal transition in gastric cancer. Int J Biol Sci 2013; 9: 587-597.
[24] Yuan JH, Yang F, Wang F, Ma JZ, Guo YJ, Tao QF, Liu F, Pan W, Wang TT, Zhou CC, Wang SB, Wang YZ, Yang Y, Yang N, Zhou WP, Yang GS and Sun SH. A long noncoding RNA activated
by TGF-β promotes the invasion-metastasis