Introduction
Swimming performance undoubtedly changes dramatically during the postnatal development of aquatic animals. These changes can be associated with growth, changes in body shape and physiological development of the immature animal. Although investigations have shown that hydrodynamic differences in swim performance of aquatic animals are associated with body length within fish (i.e. Wardle, 1975; Bainbridge, 1985; Domenici and Blake, 1993) and cetaceans (Fish, 1998), and across phylogenetic groups (i.e. Wu, 1977; Domenici, 2001), the effect of ontogeny has generally been ignored as the number of studies investigating performance traits throughout ontogeny remains small (Herrel and Gibb, 2005). Ontogenic changes in swimming kinematics have primarily been explored in larval fish (i.e. Hunter, 1972; Fuiman and Webb, 1988; Hale, 1999; Osse and van den Boogaart, 2000) and more recently in jellyfish (McHenry and Jed, 2003). Changes in swim performance within these groups are compounded by dramatic morphological changes in body shape throughout early development. The ontogeny of
swimming performance has yet to be investigated in a marine mammal, in which changes in body length and physiology are the primary characteristics that will affect development of swimming capabilities. Unlike pinniped pups that develop on land, cetacean calves are born into the ocean and must swim immediately after birth.
The morphology and swimming kinematics of dolphins are characteristic of the thunniform mode, which is typical of some of the fastest marine vertebrates, including scombrid fishes, laminid sharks and cetaceans (Lighthill, 1969). As with other thunniform swimmers, dolphins generate thrust exclusively with a high-aspect-ratio caudal hydrofoil [tailflukes (Fish and Hui, 1991)]. Thus, a qualitative assessment of swim effort may be obtained by considering both tail movement amplitude and beat frequency; higher amplitudes and frequencies are associated with greater energy expenditure (Kooyman and Ponganis, 1998). The ability to sustain performance for prolonged periods is dependent on the magnitude of the resistant forces and the characteristics of the muscles (Fish and Rohr, 1999). For adult dolphins, drag increases with the square Morphological and physiological development impacts
swimming performance throughout ontogeny. Our investigation of the ontogeny of swim performance (mean and maximum swim speed) and swim effort (stroke amplitude and tailbeat frequency) of independently swimming bottlenose dolphins (Tursiops truncatus) demonstrated that swimming capabilities are extremely limited in calves. Mean and maximum swim speeds of 0–1-month-old calves were only 37% and 52% of that for adults, respectively, and levels similar to those of adults were not achieved until one year post-partum. Limitations in swim speed were associated with an inability to achieve mature thrusting capabilities, as stroke amplitude and distance covered per stroke remained significantly lower than adult levels during the first-year post-partum.
Although calves were expected to require less thrusting power to propel their smaller bodies through water, size-specific stroke amplitudes of 0–3-month-olds (23–26% of body length) were smaller than those of dolphins >>>>10·months post-partum (29–30% of body length). As a result, swim speed standardized by body length was significantly slower for 0–3-month-old dolphins compared with dolphins >>>>10·months post-partum. These results suggest that other factors, such as underdeveloped physiology, act synergistically with small body size to limit independent swim performance in dolphins during ontogeny.
Key words: cetacean, odontocete, dolphin, calf, ontogeny, swimming, performance, mechanics, kinematics, Tursiops truncatus.
Summary
The Journal of Experimental Biology 209, 4724-4731 Published by The Company of Biologists 2006 doi:10.1242/jeb.02566
Ontogeny of swim performance and mechanics in bottlenose dolphins (
Tursiops
truncatus
)
Shawn R. Noren
1,2,*, George Biedenbach
3and Elizabeth F. Edwards
11Protected Resources Division, Southwest Fisheries Science Center, 8604 La Jolla Shores Drive, La Jolla, CA 92037, USA, 2Institute of Marine Science, Center for Ocean Health, University of California at Santa Cruz, 100 Shaffer Road, Santa Cruz, CA 95060, USA and 3Dolphin Quest Hawaii, c/o Hilton Waikoloa Village, 69-425 Waikoloa Beach
Drive, Waikoloa, HI 96738, USA
*Author for correspondence (e-mail: snoren@biology.ucsc.edu)
of velocity (Skrovan et al., 1999), and the power required to overcome drag increases with the cube of velocity (Fish, 1993). Therefore, as speed increases the period of sustainability decreases. Ultimately, overall swim performance is set by the aerobic and anaerobic capacities of the locomotor muscle. Steady-state locomotor performance is constrained by the availability of oxygen to the skeletal muscle (Vock et al., 1996) and sprint performance is constrained by the ability of the skeletal muscle to support anaerobic pathways (Hochachka and Storey, 1975).
For bottlenose dolphins, ontogenetic changes in physiology and morphology occur throughout the first two years post-partum. Calves are born with a proportionally small muscle mass (Dearolf et al., 2000) that has very limited aerobic (Noren et al., 2001) and anaerobic (Noren, 2004) capacities, which undoubtedly constrain swim performance. In addition, dolphin calves are born with limited oxygen stores in the blood (Noren et al., 2002) and an unrefined cardiorespiratory system (Noren et al., 2004) that will further compromise exercise performance. Underdeveloped physiology combined with diminutive body size will act synergistically to limit swim performance capabilities (Noren and Edwards, 2006).
We examined the kinematics of independently swimming dolphins to quantify the swimming capabilities of calves (0–2·years old), juveniles and adults. Examining marine mammal swimming requires novel experimental approaches (Williams, 2001) and studying free-ranging cetacean calves is especially difficult (Cockcroft and Ross, 1990). Dolphins in captivity provided a controlled experimental approach to study swimming kinematics, a method that has been successfully used in the past (i.e. Williams et al., 1992; Fish, 1993; Skrovan et al., 1999). Here, captive bottlenose dolphins (Tursiops
truncatus) serve as a model for this first quantitative study of
delphinid calf swimming.
Materials and methods Experimental animals
Three mother–calf pairs, two juveniles (a three-year-old female and five-year-old male) and an additional adult female bottlenose dolphin (Tursiops truncatus) were studied in a large, oblong natural lagoon at Dolphin Quest Hawaii (high-tide dimensions, 4335337·m deep; low-tide dimensions, 3734635·m deep). The calves (two males and one female) were born within three weeks of each other and were studied during seven intervals that approximated 0–1, 3, 6, 9, 12, 18 and 24·months post-partum. Studies occurred from October 2003 to November 2005 and water temperature ranged from 24.0°C to 26.7°C (mean, 25.3±0.4°C). The adults had been held at the facility for several years and the calves and juveniles had been born at the facility; all animals were acclimated to the local environmental temperatures. With the exception of nursing calves less than three months old, animals were fed a mixed fish diet of capelin, herring and squid supplemented with vitamins.
The swimming motions of the animals were recorded during
daylight hours. A submerged SCUBA diver, sitting stationary on a wide ledge on one side of the enclosure, used a digital video camcorder (Sony Hi-8; Sony, Oradell, NJ, USA) contained in an underwater housing (Amphibico Dive Buddy; Amphibico, Montréal, Québec, Canada) to film the dolphins as they passed by. The animals swam 0.5–1.0·m below the surface of the water and swam within 7–8·m in front of the SCUBA diver. Experimental swim sessions included both opportunistic (no reward) and directional between two trainers (reward based). Rewards (tactile stimulation, toys and food) were based on the intensity of the swimming provided. Standard operant conditioning was used to train the directional swimming. Until the calves mastered the directional swimming behavior at approximately 6·months post-partum, the calves were given a staggered start of their mothers and reliably chased their mothers. Similarly, staggered starts were occasionally used to provide further incentive for fast swimming across all age groups. In all cases, several seconds passed before the second dolphin was sent. Only video clips showing dolphins swimming alone (>1·m in all directions from any other dolphin) were included in the analyses.
Video analysis
Short 1–6·s video clips in which dolphins swam steadily, maintained a parallel path to the camera lens and had no qualitatively apparent acceleration were extracted from the videotapes using digital video software (Pinnacle Studio 8; Pinnacle Systems, Inc., Mountain View, CA, USA). Anatomical points of interest (rostrum tip, cranial insertion of the dorsal fin and fluke tip) were digitized (Fig.·1) at a rate of 60·fields·s–1 of video using a motion-analysis system (Peak Motus 6.1; Peak Performance Technologies, Inc., Englewood, CO, USA) following methods similar to Skrovan et al. (Skrovan et al., 1999). To correct for any slight deviations in the dolphins’ vertical angle of attack in the water column, all coordinates were transformed so that the starting position of the cranial insertion of the dorsal fin (digitized point closest to the center of mass) represented the zero position on the y-axis. The measured body length (L) of each study animal provided a scalar so that the system could calculate instantaneous transformed coordinates (Fig.·2), velocity and acceleration for each digitized point.
significantly with swim speed in adult odontocetes (Fish, 1993; Fish, 1998; Skrovan et al., 1999; Fish et al., 2003). Stroke amplitude was not normalized for swim speed because adult odontocetes do not modulate swim speed by changing stroke amplitude (Fish, 1993; Skrovan et al., 1999; Fish et al., 2003).
Statistics
Although we collected data from multiple individuals, we were not interested in examining individual variation. This is the first study of the ontogeny of dolphin calf swim performance, thus our primary interest was to quantify changes with age in swim speed and the associated swim effort (peak-to-peak fluke stroke amplitude and tailbeat frequency). Each data point was from a unique video clip, thus measurements were considered independent, as has been done previously in similar studies (Fish, 1993; Skrovan et al., 1999; Fish et al., 2003). Pearson product-moment correlations were used to determine the correlation of age with body length, swim speed, size-specific swim speed, maximum swim speed, size-specific maximum swim speed, stroke amplitude, size-specific stroke amplitude, tailbeat frequency, normalized tailbeat frequency and distance per stroke throughout the first two years post-partum. Two general linear models, one for mean swim speed and one for maximum swim speed, were developed to determine which variable(s) best predict(s) swim speed during the first two years post-partum; age, body length, stroke amplitude, tailbeat frequency and the interactions between these variables were considered. Differences between age-class categories in mean swim speed, size-specific mean swim speed, stroke amplitude, size-specific stroke amplitude, normalized tailbeat frequency and distance per stroke were determined using one-way analysis of variance (ANOVA) on ranks in combination with Dunn’s all-pairwise comparison tests because normality failed. Body length, maximum swim speed and size-specific maximum swim speed were normally
distributed, thus age-class differences in these variables were determined using one-way ANOVA in combination with Tukey all-pairwise comparison tests. Statistical analyses were performed using Sigma Stat 2.03 and Systat 10.2 software packages (Systat Software, Inc., Point Richmond, CA, USA). All means are given ± 1 s.e.m.
Results
Eight-hundred video clips were extracted from approximately 33·h of videotape. Our experimental approach adequately captured swimming behaviors representative of adult dolphins. This is evident by the similarity in mean adult experimental swim speeds (3.88±0.09·m·s–1; present study) to
observed sustainable [3.1·m·s–1(Lang, 1975)] swim speeds of
adult bottlenose dolphins. Our maximum swim speed for an adult (6.32·m·s–1) is well above sustainable speeds, although
not as fast as that previously reported for an adult captive bottlenose dolphin [8.15·m·s–1(Rohr et al., 2002)].
General developmental patterns
Throughout the first two years post-partum, swim speeds for dolphin calves swimming independently increased significantly with age (r=0.840, P<0.001, N=622; Fig.·3A). This increased performance was not simply because of increased body lengths with age (r=0.938, P<0.001, N=19) because size-specific swim speeds also increased significantly with age (r=0.604, P<0.001, Fig.·1. A digitized video clip of a two-year-old calf swimming
independently at 3.84·m·s–1. Movements of the rostrum are in pink,
cranial insertion of the dorsal fin is in yellow and the fluke tip is shown in blue. The brown dot is a reference point that was digitized, indicating that the camera was steady during the trial.
Fig.·2. The body movements from the digitized video clip of a two-year-old calf swimming independently at 3.84·m·s–1. Movements of
the rostrum are in pink, cranial insertion of the dorsal fin is in yellow and the fluke tip is shown in blue. In this case, the dolphin swam from right to left, thus the orientation of the body parts was flipped in the
y-plane during the coordinate transformation process (see Materials and methods). The magnitude of the distance between digitized points remains the same and is used in the calculations for swim effort. Peak-to-peak fluke stroke amplitude is the fluke displacement and is the difference in the y-coordinates of successive maximums and minimums (i.e. B–A and B–C) measured in m. Tailbeat frequency is the number of strokes s–1, where one stroke is adjacent maximums or
N=622; Fig.·3B). There was a concurrent increase in maximum swim speeds (r=0.852, P<0.001, N=20), but size-specific maximum swim speeds did not change (r=0.334, P=0.150, N=20). Fluke stroke amplitude also increased with age (r=0.840, P<0.001, N=622; Fig.·4A), but was not simply associated with an increase in body length because size-specific stroke amplitude also increased significantly during ontogeny (r=0.486, P<0.001, N=622; Fig.·4B). Meanwhile, tailbeat frequencies increased with age (r=0.180, P<0.001, N=622; Fig.·5A) whereas normalized tailbeat frequency decreased with age (r=–0.746, P<0.001, N=622; Fig.·5B). As a result, distances attained per stroke increased significantly with age (r=0.886, P<0.001, N=622; Fig.·6).
Factors that modulate swim speed during ontogeny A general linear model was used to discern which variable(s) (age, body length, stroke amplitude, tailbeat frequency and the interactions between these variables) predict(s) swim performance during the first two years post-partum in dolphins.
The results were different depending on whether mean swim performance or maximum swim performance was considered. Mean swim speed (U, m·s–1) throughout ontogeny was
predicted by age (year), tailbeat frequency (f; strokes·s–1) and
the interaction between age and tailbeat frequency. Stroke amplitude did not significantly contribute to the predictive ability of the equation. Thus, mean swim speed in dolphin calves 0–2·years post-partum is predicted according to (r=0.99, F=9533.767, P<0.001, N=622):
U= 0.76·age + 0.85·f+ 0.28 (age f) . (1)
Meanwhile, maximum swim speed (Umax; m·s–1) in dolphin
calves 0–2·years post-partum was only predicted by body length (L; m) according to (r=0.99, F=1278.72, P<0.001, N=20):
Umax= 2.37·L. (2)
Age category comparisons
Age-class categories were compared to determine the stage of development at which swim speed and swim effort approach 0 0.5 1.0 1.5 2.0 2.5 3.0 3.5 4.0 4.5. 5.0 5.5
0 0.5 1.0 1.5 2.0 2.5 3.0 3.5 4.0 4.5 5.0 5.5 6.0
Adult
Age (year) 0
0.5 1.0 1.5 2.0 2.5 3.0 3.5
Adult
A
B
Swim speed (m s
–1)
0 0.5 1.0 1.5 2.0 2.5 3.0 3.5 4.0 4.5. 5.0 5.5
Size-specif
ic swim speed (
L
s
–1
)
Fig.·3. Swim speed (A) and size-specific swim speed (B) in relation to age. Black, gray and white symbols denote calves, juveniles and adults, respectively. A different symbol is used for each mother–calf pair (the juveniles were related to two of the mothers and are represented by the same symbol). L, body length.
0 0.2 0.4 0.6 0.8 1.0 1.2
Adult
Age (year) 0
0.1 0.2 0.3 0.4 0.5
A
B
0 0.5 1.0 1.5 2.0 2.5 3.0 3.5 4.0 4.5 5.0 5.5
Adult 0 0.5 1.0 1.5 2.0 2.5 3.0 3.5 4.0 4.5 5.0 5.5
Size-specif
ic fluk
e strok
e amplitude (
L
)
Fluk
e strok
e amplitude (m)
mature levels. There were significant differences between age-class categories in body length (F8,18=249.800, P<0.001), mean
swim speed (H=486.364, d.f.=8, P<0.001), maximum swim speed (F8,17=10.480, P<0.001), size-specific mean swim speed
(H=275.950, d.f.=8, P<0.001), stroke amplitude (H=578.431, d.f.=8, P<0.001), size-specific stroke amplitude (H=215.623, d.f.=8, P<0.001), normalized tailbeat frequency (H=620.137, d.f.=8, P<0.001) and distance per stroke (H=620.951, d.f.=8, P<0.001). In contrast, size-specific maximum swim speed was similar across age categories (F8,17=0.578, P=0.782). See
Table·1 for all-pairwise comparison results.
Discussion
The results of this study demonstrated that there were strong ontogenetic trends in the swim performance (mean and maximum speed) of dolphins and the associated swim effort (stroke amplitude and tailbeat frequency) required to achieve these speeds. Increased swim performance during ontogeny
was not simply because of increased body lengths since size-specific mean swim speeds also increased significantly with age (Fig.·3B). The apparent increase in swim performance with age in dolphins appeared to be modulated by concurrent increases in stroke amplitudes (Fig.·4A) and tailbeat frequencies (Fig.·5A), although age and tailbeat frequency were the only factors that predicted mean swim performance during the first two years post-partum. Nonetheless, comparisons of normalized tailbeat frequency indicated that younger calves beat their tailflukes at a faster rate per given speed (Fig.·5B), suggesting that young calves must work harder than adults to achieve a given speed. As a result, limitations in swim performance were most dramatic in the youngest of age categories (Table·1). Mean swim speeds of 0–3-month-old calves were only 0.46–0.60 times the observed sustainable swim speed of adult bottlenose dolphins [3.1·m·s–1 (Lang,
1975)], and maximum swim speeds of a 0-, 70- and 98-day-old calf were only 1.75, 2.61 and 3.40·m·s–1, respectively,
compared with 6.32·m·s–1 for an adult in this study. The
inability to exploit the upper range of speeds remained evident for the first year post-partum as 0–10-month-old calves had significantly slower mean swim speeds than yearlings, 1.5·year olds, 2·year olds, juveniles and adults (Table·1).
The ability to achieve a given swim speed is undoubtedly dependent on the metabolic scope of the animal. The metabolic rates of animals must increase with increasing speed, but unlike the linear increase in metabolic rate with velocity found for terrestrial animals (Taylor et al., 1970; Taylor et al., 1982), the metabolic rates of aquatic animals increase as a power function (Ware, 1978) or exponential function (Beamish, 1978) of velocity. Therefore, above a certain size-specific velocity, the metabolic rates of aquatic animals rise sharply, limiting upper swim speeds and confining swimmers to a relatively narrow range of velocities. Because mass-specific cost of transport decreases with body size for swimmers (Schmidt-Nielsen, Age (year)
0 0.2 0.4 0.6 0.8 1.0 1.2 1.4 1.6 1.8 2.0 2.2 2.4 2.6 2.8 0 0.5 1.0 1.5 2.0 2.5 3.0 3.5 4.0 4.5
B
A
Adult 0 0.5 1.0 1.5 2.0 2.5 3.0 3.5 4.0 4.5 5.0 5.5
Adult 0 0.5 1.0 1.5 2.0 2.5 3.0 3.5 4.0 4.5 5.0 5.5
Normalized tailbeat frequenc
y
(strok
es m
–1)
T
ailbeat frequenc
y (strok
es s
–1)
Fig.·5. Tailbeat frequency (A) and normalized tailbeat frequency (B) in relation to age. Black, gray and white symbols denote calves, juveniles and adults, respectively. A different symbol is used for each mother–calf pair (the juveniles were related to two of the mothers and are represented by the same symbol).
Age (year) 0
0.5 1.0 1.5 2.0 2.5 3.0 3.5
Adult 0 0.5 1.0 1.5 2.0 2.5 3.0 3.5 4.0 4.5 5.0 5.5
Distance per strok
e (m strok
e
–1
)
1984), larger swimmers are able to exploit a much broader range of speeds than smaller swimmers, and as a result, maximum swim speed increases with body size (Bonner, 1965). This can be seen in the results here, in which the range of swim speeds increases dramatically with age (size; Fig.·3).
Mechanical constraints can also limit the swim performance of immature dolphins. As with other thunniform swimmers, dolphins generate thrust exclusively with a high-aspect-ratio caudal hydrofoil (tailflukes) (Fish and Hui, 1991), thus the amount of power produced is dependent, in part, on the fluke amplitude and tailbeat frequency. Stroke amplitude increases with body size in odontocetes (Fish et al., 2003), as demonstrated here by the result that the youngest dolphins had the smallest stroke amplitudes (Table·1; Fig.·4A); this implies that young calves generate the least amount of power. Yet power requirements are proportional to drag, which increases with the surface area of the swimmer (Webb, 1975), thus total power requirements for calf propulsion should be less than that required for larger dolphins. However, the relatively small increase in resistance in relation to muscle available for propulsion in larger animals (Hill, 1950) suggests that calves need to generate disproportionately greater power for locomotion. Dolphin calf surface area to volume ratio is twice that of adults (Dunkin et al., 2005), thus the diminutive size-specific stroke amplitudes of 0–6-month-old calves (Table·1; Fig.·4B) might not fulfill these power needs. Calves may compensate by attempting to maintain greater normalized (for swim speed) stroke frequency (Table·1; Fig.·5B).
Small body size is not the only factor that limits the swimming capabilities of dolphin calves. Comparisons of standardized (for body size) swim speed revealed that size-specific mean swim speeds were significantly slower for 0–3·month olds compared with older age classes (Table·1), suggesting that other factors play a role in limiting calf performance. One of these factors might be physiological development. Bottlenose dolphin neonates have only 10% of the myoglobin (Noren et al., 2001) and 65% of the acid buffering capacity (Noren, 2004) found in adult muscles, resulting in diminished aerobic and anaerobic capacities, respectively. In addition, only 17.7% of total body mass is appropriated to locomotor muscle in neonates compared with 25.7% for adults [calculated from Dearolf et al. (Dearolf et al., 2000)]. Combined, these factors undoubtedly limit sustainable muscular power production for fluke movements through the viscous, dense seawater. At the same time, extreme skeletal and muscular flexibility (Etnier et al., 2003) and floppy dorsal fins and flukes (McBride and Kritzler, 1951; Tavolga and Essapian, 1957; Cockcroft and Ross, 1990) can further compromise swimming efficiency during early development.
Interestingly, size-specific maximum swim speeds of calves were not different from those of adults. This suggests that there might be different ontogenetic factors that control mean and maximum swim performance in developing dolphins. Similar size-specific maximum swim speeds across ontogeny may be explained in part by the relatively more mature state of the muscle’s anaerobic capacity, which supports sprint
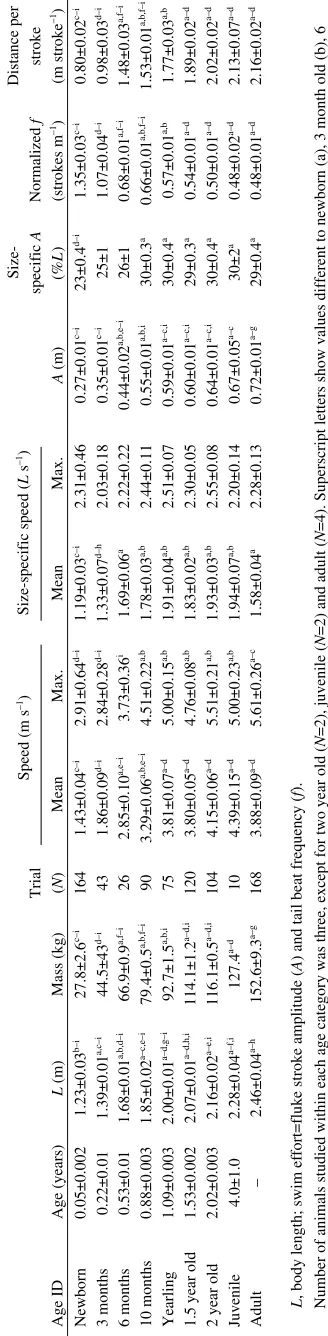
Table 1. A g e cl a ss co m p a riso n
s of bod
y le ng t h an d ma ss, s w i m perfor man ce an d s w i m effort A g e ID A g e (years) L (m) Mass (k g )
Trial (N
)
Mean
Speed (m s
–1) Max.
Mean
Size-specific speed (
L s –1) Max. A (m) Size-specific A (% L ) Normalized f (strokes m –1) Distance per stroke (m stroke –1) Newborn 0.05±0.002 1.23±0.03 b–i 27.8±2.6 c–i 164 1.43±0.04 c–i 2.91±0.64 d–i 1.19±0.03 c–i 2.31±0.46 0.27±0.01 c–i 23±0.4 d–i 1.35±0.03 c–i 0.80±0.02 c–i 3 months 0.22±0.01 1.39±0.01 a,c–i 44.5±43 d–i 43 1.86±0.09 d–i 2.84±0.28 d–i 1.33±0.07 d–h 2.03±0.18 0.35±0.01 c–i 25±1 1.07±0.04 d–i 0.98±0.03 d–i 6 months 0.53±0.01 1.68±0.01 a,b,d–i 66.9±0.9 a,f–i 26 2.85±0.10 a,e–i 3.73±0.36 i 1.69±0.06 a 2.22±0.22 0.44±0.02 a,b,e–i 26±1 0.68±0.01 a,f–i 1.48±0.03 a,f–i 10 months 0.88±0.003 1.85±0.02 a–c,e–i 79.4±0.5 a,b,f–i 90 3.29±0.06 a,b,e–i 4.51±0.22 a,b 1.78±0.03 a,b 2.44±0.11 0.55±0.01 a,b,i 30±0.3 a 0.66±0.01 a,b,f–i 1.53±0.01 a,b,f–i Yearlin g 1.09±0.003 2.00±0.01 a–d, g –i 92.7±1.5 a,b,i 75 3.81±0.07 a–d 5.00±0.15 a,b 1.91±0.04 a,b 2.51±0.07 0.59±0.01 a–c,i 30±0.4 a 0.57±0.01 a,b 1.77±0.03 a,b
1.5 year old
1.53±0.002 2.07±0.01 a–d,h,i 114.1±1.2 a–d,i 120 3.80±0.05 a–d 4.76±0.08 a,b 1.83±0.02 a,b 2.30±0.05 0.60±0.01 a–c,i 29±0.3 a 0.54±0.01 a–d 1.89±0.02 a–d
2 year old
2.02±0.003 2.16±0.02 a–e,i 116.1±0.5 a–d,i 104 4.15±0.06 a–d 5.51±0.21 a,b 1.93±0.03 a,b 2.55±0.08 0.64±0.01 a–c,i 30±0.4 a 0.50±0.01 a–d 2.02±0.02 a–d J u venile 4.0±1.0 2.28±0.04 a–f,i 127.4 a–d 10 4.39±0.15 a–d 5.00±0.23 a,b 1.94±0.07 a,b 2.20±0.14 0.67±0.05 a–c 30±2 a 0.48±0.02 a–d 2.13±0.07 a–d Ad u lt – 2.46±0.04 a–h 152.6±9.3 a– g 168 3.88±0.09 a–d 5.61±0.26 a–c 1.58±0.04 a 2.28±0.13 0.72±0.01 a– g 29±0.4 a 0.48±0.01 a–d 2.16±0.02 a–d N u
mber of animals st
u
died within each a
g
e cate
g
ory was three, except for two year old
( N =2), j u venile ( N
=2) and ad
u
lt (
N
=4). S
u
perscript letters show val
u
es different to newborn (a), 3 month old (b),
6
month old (c), 10 month old (d), yearlin
g
(e), 1.5 year old (f), 2 year old (
g
), j
u
venile (h) and ad
u
lt (i) accordin
g
to all pa
irwise comparisons across a
g e g ro u ps at P <0.05. L
, body len
g
th; swim ef
fort=fl u k e strok e amplit u de ( A
) and tail beat freq
u
enc
y (
f
[image:6.612.358.522.74.742.2]performance (Noren, 2004). Nonetheless, the effect of physiological maturation on improving exercise performance is apparent by six months post-partum, when attainment of adult muscular anaerobic capacity (Noren, 2004) and improvements in blood oxygen reserves (Noren et al., 2002) correspond to the attainment of size-specific mean swim speeds similar to adult levels (Table·1). Ultimately, mean swim speed and distance covered per stroke approach adult levels by one year post-partum, when calves have attained more than half of adult aerobic muscular capacity (Noren et al., 2001) and achieved 81% of adult female body length (Table·1).
Observed swimming behaviors of young dolphins during the first year post-partum correspond to the developmental patterns shown here for swim performance. The predominance of echelon (calf positioned by mother’s mid-lateral flank) and infant (calf positioned underneath mother’s peduncle) position during the first year post-partum has been suggested to have an adaptive significance that contributes to infant survival (Gubbins et al., 1999). Echelon position theoretically reduces the cost of transport for neonates as they are carried by the pressure wave created by their mother’s larger body (Weihs, 2004), hypothetically permitting neonates to maintain group speed with reduced tailbeat frequency (Norris and Prescott, 1961). For dolphin calves, observations of echelon position decreased from 67% to 23% during the first year of life (Gubbins et al., 1999), suggesting that echelon mitigates performance limitations of calves at birth and decreases in frequency as swim performance improves. As calves grow and begin to approximate their mother’s body size, they become too large to fully benefit from an echelon swimming position (Weihs, 2004). Although older calves remain close to their mothers they are rarely in echelon (Mann, 1997), and it is at this stage that infant position becomes more prevalent, as the occurrence of calves in this position has been observed to increase from 7% to 38% over the first year of life (Gubbins et al., 1999).
In summary, the investigation of locomotor performance throughout ontogeny is generally underrepresented in the literature (Carrier, 1996), and this is particularly true for marine mammals. We present the first empirical examination of cetacean calf swim performance. The results indicate that small body size and underdeveloped physiology act synergistically to limit dolphin calf swim performance throughout the first year of life. Limited swim performance provides a plausible explanation for the predominance of specialized swimming behaviors observed for calves during early development. Similar to dolphin calves, the young of other species are also handicapped by small body size, rapidly growing tissues and naïveté, and must still maneuver within their environment to forage and avoid predators (Carrier, 1996). Thus, the ontogeny of locomotor performance should prove to be an interesting area of exploration in the future.
This project was supported by the Protected Resources Division at the Southwest Fisheries Science Center (SWFSC), National Marine Fisheries Service, National Oceanographic
and Atmospheric Administration. S.R.N. was supported by a National Research Council Resident Research Associateship while at SWFSC. Data collection procedures were non-invasive and were approved by the host location, Dolphin Quest. We are indebted to Dolphin Quest for providing animals and additional funding for the study. We thank the staff at Dolphin Quest Hawaii (particularly S. Burton and C. Buczyna), the Hilton at Waikoloa Village and S. Reilly at SWFSC for supporting this project. We thank J. Redfern at SWFSC for providing assistance with data management and T. Williams at the University of California Santa Cruz for the use of her Peak Performance system. We thank two anonymous reviewers for their comments that improved this manuscript.
References
Bainbridge, R.(1958). The speed of swimming of fish as related to size and
to the frequency and amplitude of the tail beat. J. Exp. Biol. 35, 109-133.
Beamish, F. W. H.(1978). Swimming capacity. In Fish Physiology. Vol. VIII (ed. W. S. Hoar and D. J. Randall), pp. 101-187. New York: Academic Press. Bonner, J. T.(1965). Size and Cycle: An Essay on the Structure of Biology.
Princeton: Princeton University Press.
Carrier, D. R.(1996). Ontogenetic limits on locomotor performance. Physiol.
Zool. 69, 467-488.
Cockcroft, V. G. and Ross, G. J. B.(1990). Observations on the early
development of a captive bottlenose dolphin calf. In The Bottlenose Dolphin
(ed. S. Leatherwood and R. R. Reeves), pp. 401-478. San Diego: Academic Press.
Dearolf, J. L., McLellan, W. A., Dillaman, R. M., Frierson, D., Jr and Pabst, D. A.(2000). Precocial development of axial locomotor muscle in
bottlenose dolphins (Tursiops truncatus). J. Morphol. 244, 203-215.
Domenici, P.(2001). The scaling of locomotor performance in predator-prey
encounters: from fish to killer whales. Comp. Biochem. Physiol.131A,
169-182.
Domenici, P. and Blake, R. W.(1993). The effect of size on the kinematics
and performance of angelfish (Pterophyllum eimekei) escape responses. J.
Can. Zool. 71, 2319-2326.
Dunkin, R. C., McLellan, W. A., Blum, J. E. and Pabst, D. A.(2005). The ontogenetic changes in the thermal properties of blubber from Atlantic
bottlenose dolphins Tursiops truncatus. J. Exp. Biol. 203, 1469-1480.
Etnier, S. A., Dearolf, J. L., McLellan, W. A. and Pabst, D. A.(2003). Postural role of lateral axial muscles in developing bottlenose dolphins (Tursiops truncatus). Proc. R. Soc. Lond. B 271, 909-918.
Fish, F. E.(1993). Power output and propulsive efficiency of swimming
bottlenose dolphins (Tursiops truncatus). J. Exp. Biol. 185, 179-193.
Fish, F. E.(1998). Comparative kinematics and hydrodynamics of odontocete cetaceans: morphological and ecological correlates with swimming
performance. J. Exp. Biol. 201, 2867-2877.
Fish, F. E. and Hui, C. A.(1991). Dolphin swimming – a review. Mamm. Rev. 21, 181-195.
Fish, F. E. and Rohr, J. J.(1999). Review of dolphin hydrodynamics and
swimming performance. (Space and Naval Warfare Systems Command
Technical Report 1801). San Diego. http://www.spawar.navy.mil/sti/ publications/pubs/tr/1801/tr1801.pdf.
Fish, F. E., Peacock, J. E. and Rohr, J. J.(2003). Stabilization mechanism
in swimming odontocete cetaceans by phased movements. Mar. Mamm. Sci.
19, 515-528.
Fuiman, L. A. and Webb, P. W.(1988). Ontogeny of routine swimming
activity and performance in zebra danios (Teleostei: Cyprinidae). Anim.
Behav. 36, 50-261.
Gubbins, C., McCowan, B., Lynn, S. K., Hooper, S. and Reiss, D.(1999).
Mother-infant spatial relations in captive bottlenose dolphins, Tursiops
truncatus. Mar. Mamm. Sci. 15, 751-765.
Hale, M.(1999). Locomotor mechanics during early life history: effects of size
and ontogeny on fast-start performance of salmonid fishes. J. Exp. Biol. 202,
1465-1479.
Herrel, A. and Gibb, A. C.(2005). Ontogeny of performance in vertebrates.
Hill, A. V.(1950). The dimensions of animals and their muscular dynamics.
Sci. Prog. 38, 209-230.
Hochachka, P. W. and Storey, K. B.(1975). Metabolic consequences of
diving in animals and man. Science187, 613-621.
Hunter, J. R. (1972). Swimming and feeding behavior of larval anchovy
Engraulis mordax. Fish. Bull. 70, 821-838.
Kooyman, G. L. and Ponganis, P. J.(1998). The physiological basis for
diving at depth: birds and mammals. Annu. Rev. Physiol. 60, 19-32.
Lang, T. G.(1975). Speed, power, and drag measurements of dolphins and
porpoises. In Swimming and Flying in Nature. Vol. 2 (ed. T. Y. Wu, C. J.
Brokaw and C. Brennen), pp. 553-571. New York: Plenum Press. Lighthill, M. J.(1969). Hydrodynamics of aquatic animal propulsion. Annu.
Rev. Fluid Mech. 1, 413-446.
Mann, J.(1997). Individual differences in bottlenose dolphin infants. Fam. Syst.4, 35-49.
McBride, A. F. and Kritzler, H. (1951). Observations on pregnancy,
parturition, and post-natal behavior in the bottlenose dolphin. J. Mamm. 32,
251-266.
McHenry, M. J. and Jed, J.(2003). The ontogenic scaling of hydrodynamics
and swimming performance in jellyfish (Aurelia aurita). J. Exp. Biol. 206,
4125-4137.
Noren, S. R.(2004). Muscle acid buffering capacities in cetaceans: influences of diving performance, swimming performance, body size, and postpartum
development. Mar. Mamm. Sci. 20, 808-822.
Noren, S. R. and Edwards, E. F. (2006). Physiological and behavioral development in dolphin calves: implications for calf separation and mortality
due to tuna purse-seine sets. Mar. Mamm. Sci.
doi:10.1111/j.1748-7692.2006.00083.x.
Noren, S. R., Williams, T. M., Pabst, D. A., McLellan, B. and Dearolf, J. (2001). The development of diving in marine endotherms: preparing the skeletal muscles of dolphins, penguins, and seals for activity during
submergence. J. Comp. Physiol. B171, 127-134.
Noren, S. R., Lacave, G., Wells, R. S. and Williams, T. M.(2002). The
development of blood oxygen stores in bottlenose dolphins (Tursiops
truncatus): implications for diving capacity. J. Zool. Lond. 258, 105-113. Noren, S. R., Cuccurullo, V. and Williams, T. M.(2004). The development
of diving bradycardia in bottlenose dolphins (Tursiops truncatus). J. Comp.
Physiol. B174, 139-147.
Norris, K. S. and Prescott, J. H. (1961). Observations on Pacific
cetaceans of Californian and Mexican waters. Univ. Calif. Publ. Zool. 63,
291-402.
Osse, J. W. M. and van den Boogaart, J. G. M.(2000). Body size and
swimming types in carp larvae: effects of being small. Neth. J. Zool. 50,
233-244.
Rohr, J. R. and Fish, F. E.(2004). Strouhal numbers and optimization of
swimming by odontocete cetaceans. J. Exp. Biol. 207, 1633-1642.
Rohr, J. J., Fish, F. E. and Gilpatrick, J. W., Jr(2002). Maximum swim speeds of captive and free-ranging delphinids: critical analysis of
extraordinary performance. Mar. Mamm. Sci. 18, 1-19.
Schmidt-Nielsen, K. (1984). Scaling: Why is Animal Size so Important?
Cambridge: Cambridge University Press.
Skrovan, R. C., Williams, T. M., Berry, P. S. and Moore, P. W.(1999). The
diving physiology of bottlenose dolphins (Tursiops truncatus). II.
Biomechanics and changes in buoyancy at depth. J. Exp. Biol. 202,
2749-2761.
Tavolga, M. C. and Essapian, F. S.(1957). The behavior of the bottle-nosed
dolphin (Tursiops truncatus): mating, pregnancy, parturition and
mother-infant behavior. Zoologica42, 11-31.
Taylor, C. R., Schmidt-Nielsen, K. and Raab, J. L. (1970). Scaling of
energetic cost of running to body size in mammals. Am. J. Physiol. 219,
1104-1107.
Taylor, C. R., Heglund, N. C. and Maloiy, G. M. O.(1982). Energetics and mechanics of terrestrial locomotion. I. Metabolic energy consumption as a
function of speed and body size in birds and mammals. J. Exp. Biol. 97,
1-21.
Vock, R., Weibel, E. R., Hoppeler, H., Ordway, G., Weber, J. M. and Taylor, C. R. (1996). Design of the oxygen and substrate pathways. V.
Structural basis of vascular substrate supply to muscle cells. J. Exp. Biol.
199, 1675-1688.
Wardle, C. S.(1975). Limits of fish swimming speed. Nature255, 725-727. Ware, D. M.(1978). Bioenergetics of pelagic fish: theoretical change in
swimming speed and ration with weight. J. Fish. Res. Board Can. 35,
220-228.
Webb, P.(1975). Hydrodynamics and energetics of fish propulsion. Bull. Fish. Res. Board Can. 190, 1-158.
Weihs, D.(2004). The hydrodynamics of dolphin drafting. J. Biol. 3, 1-23. Williams, T. M.(2001). Intermittent swimming by mammals: a strategy for
increasing energetic efficiency during diving. Am. Zool. 41, 166-176.
Williams, T. M., Friedl, W. A., Fong, M. L., Yamada, R. M., Sedivy, P. and Haun, J. E.(1992). Travel at low energetic cost by swimming and
wave-riding bottlenose dolphins. Nature335, 821-823.