Policing Minister’s Assessment of Minority Ethnic Recruitment, Retention and Progression in the Police Service A Paper for the Home Secretary
Full text
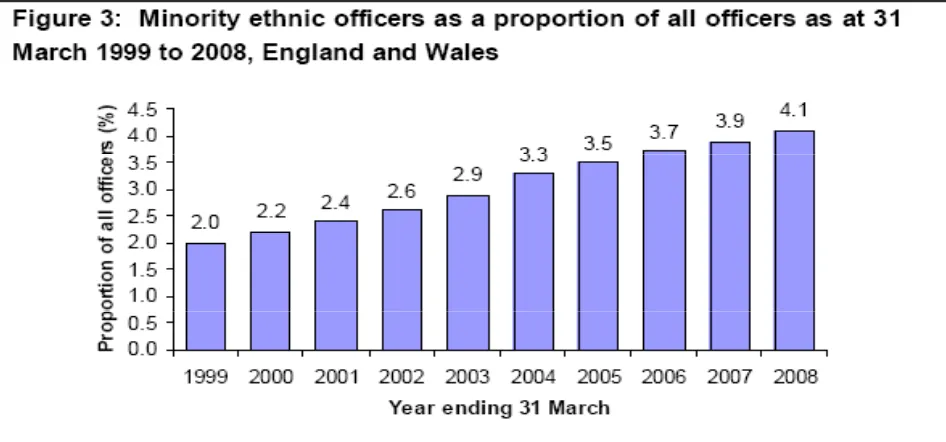
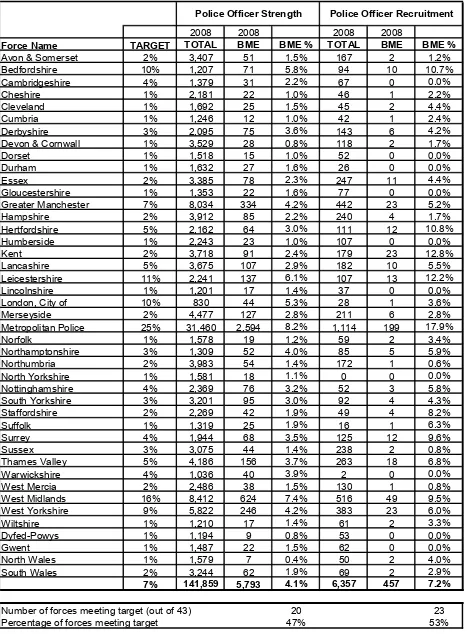
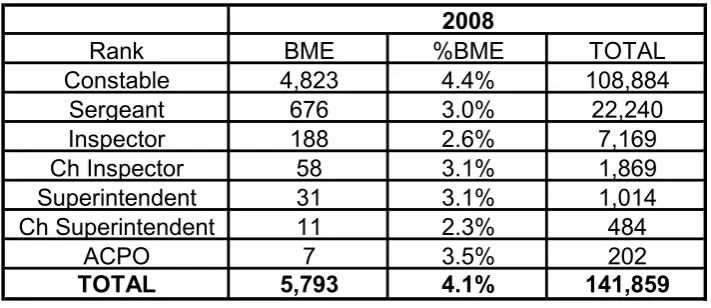
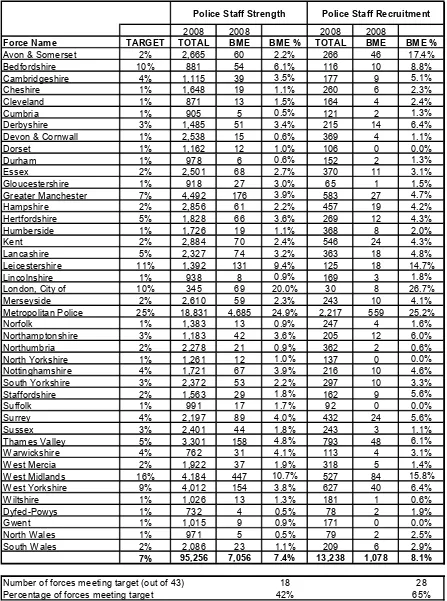
Figure


Related documents
“Comparison of impervious surface area and normalized difference vegetation index as indicators of surface urban heat island effects in Landsat imagery.” Remote Sensing
This chapter tries to establish policy options for supporting clusters of Internet companies based on above-mentioned Internet companies’ clustering process (Figure 1) and
In this work we investigate the impact of the traffic load location (within the IEEE 802.11g network) and the impact of the wireless access network technology type on
The ValueFronteira Analytics / Econometrics Laboratory is dedicated to instructing hands-on executive courses in analytics, and econometrics; engage in business and
The overall purpose of this study was to examine teacher perceptions of their professional training to teach students with autism spectrum disorder and the relationships
The Service also manages national fish hatcheries, and provides federal leadership in habitat protection, technical assistance, and the conservation and protection of
Another study performed by Gulia (2014) to find out the impact of WCM on the profitability of the pharmaceutical sector by choosing sample of 60 firms from this sector, the
Figure 7, which shows the impulse functions of response of the price growth, demonstrates that the investments stabilize at the same level after 2 periods, output
