Abstract—The increase of carbon dioxide (CO2) emissions and deforestation, especially in the rain forest area, have strong effect to the climate change of the world. Besides the climate issue, we also expect that the increase in CO2 emissions along with other environmental factors can affect survival rate of people in the new economic countries such as China and Thailand. We have thus used the World Bank’s world development indicators data to empirically study the models characterizing relationships between CO2 emissions and other environmental factors to the survival to age 65 of male and female population in these two countries. The studied data are environmental and health indicators during the years 1966 to 2013. We compare the results obtained from the traditional linear regression models to those obtained from the regression tree models using the M5’ algorithm. The linear regression models show that CO2 intensity and the forest depletion have negative effect to the longevity of Thai people, whereas the CO2 emissions from gaseous fuel consumption has negative effect to the long lasting of Chinese’s life. The M5’ algorithm generates a better correlated regression models than the linear regression. The tree models show that the amount of CO2 emissions is the most discriminative factor to predict survival rate of both Thai and Chinese population.
Index Terms—Regression tree model, M5’ algorithm, CO2 emissions, survival rate.
I. INTRODUCTION
HE increase in carbon dioxide (CO2) emissions to the atmosphere is considered the major factors of global warming effect. Such effect leads to the climate change in an unwanted manner such as severe drought and environmental damage. Carbon footprint and carbon credit are the attempt to reduce global CO2 emissions by means of economic force. There have been numerous studies [2], [3] revealing that deforestation for agricultural purpose is the primary sector to increase CO2 emissions. Energy supply, industries, and transportation are also among the top sectors producing CO2 emissions [1], [10]. Population growth is another hypothesis of CO2 emissions increasing [5], [7].
Manuscript received December 30, 2015; revised January 20, 2016. This work was supported in part by the research funds from the National Research Council of Thailand and Suranaree University of Technology through the Data Engineering and Knowledge Engineering Research Units.
Nittaya Kerdprasop is an associate professor at the School of Computer Engineering, Suranaree University of Technology, Nakhon Ratchasima 30000, Thailand (e-mail: [email protected]).
Kittisak Kerdprasop is an associate professor at the School of Computer Engineering, Suranaree University of Technology, Nakhon Ratchasima 30000, Thailand (e-mail: [email protected]).
In this work, we are interested in a different aspect of global warming and greenhouse phenomenon. We study the relationship of CO2 emissions and other environmental factors that have strong effect to the survival to age 65 of population. The recent works of Qureshi et al. [9] and Zaman et al. [13] are close to our work presented in this paper. But their works concentrate on the relationships of CO2 emissions and environmental factors to the government health expenditure in some South Asian and Sub-Saharan countries. Besides the different study of dependent variable, the contribution of our work is that we propose to improve of correlation of regression analysis through the application of M5’ algorithm, which is the variant of decision tree learning on continuous values [6], [8], [11].
II. DATA AND METHODOLOGY
A. Data Characteristics
To study the relationships of CO2 emissions and other factors to the survival rate of population, we use the World Bank data [12]. We select to study 20 attributes; names and explanation are given in Table 1.
TABLEI
DATA ATTRIBUTES AND THEIR MEANING
Attribute Name Meaning
EnergyDe Energy depletion (% of GNI) MineralDe Mineral depletion (% of GNI) NatResDe Natural resource depletion (% of GNI)
ForestDe Net forest depletion (% of GNI) ForArea Forest area (% of land area)
AgriCH4 Agricultural methane emissions (thousand metric
tons of CO2 equivalent)
AgriN2O Agricultural nitrous oxide emissions (thousand
metric tons of CO2 equivalent)
IndN2O Industrial nitrous oxide emissions (thousand
metric tons of CO2 equivalent)
N2O Nitrous oxide emissions (thousand metric tons of
CO2 equivalent)
GreenH Other greenhouse gas emissions, HFC, PFC and SF6 (thousand metric tons of CO2 equivalent)
CO2 CO2 emissions (kiloton, kt)
CO2Gas CO2 emissions from gaseous fuel consumption
(kt)
CO2Liq CO2 emissions from liquid fuel consumption (kt)
CO2Solid CO2 emissions from solid fuel consumption (kt)
CO2Intens CO2 intensity (kg per kg of oil equivalent energy
use)
PM2.5 PM2.5 air pollution, mean annual exposure (micrograms per cubic meter)
TB Incidence of tuberculosis (per 100,000 people) HealthExp Total health expenditure (% of GDP)
SurviF Survival to age 65 of female (% of cohort) SurviM Survival to age 65 of male (% of cohort)
Regression Tree Analysis of CO
2
Emissions and
Environmental Factors to the Survival Rate of
Population in Thailand and China
Nittaya Kerdprasop and Kittisak Kerdprasop
The panel data are ranging from the years 1966 to 2013. We choose to perform a comparative study of Thailand against China because both countries tend to produce more CO2 emissions as the economic growth is increasing. Moreover, a high percentage of population in Thailand is Chinese-Thai, therefore uneven longevity from genetic difference should be a less accounting factor. The summaries of each attribute’s statistics in Thailand and China are given in Tables 2 and 3, respectively.
Survival to age 65 of female and male are the target of our analyses. To compare the trends of survival rate in Thailand versus China, we present the graphs in Fig. 1. In can be seen that in the long run survival rate of population in China is higher than those in the same generation who were born and lived in Thailand. Therefore, environmental factors might be the case. We thus present the graphical information of forest area, forest depletion, and energy depletion in Fig. 2.
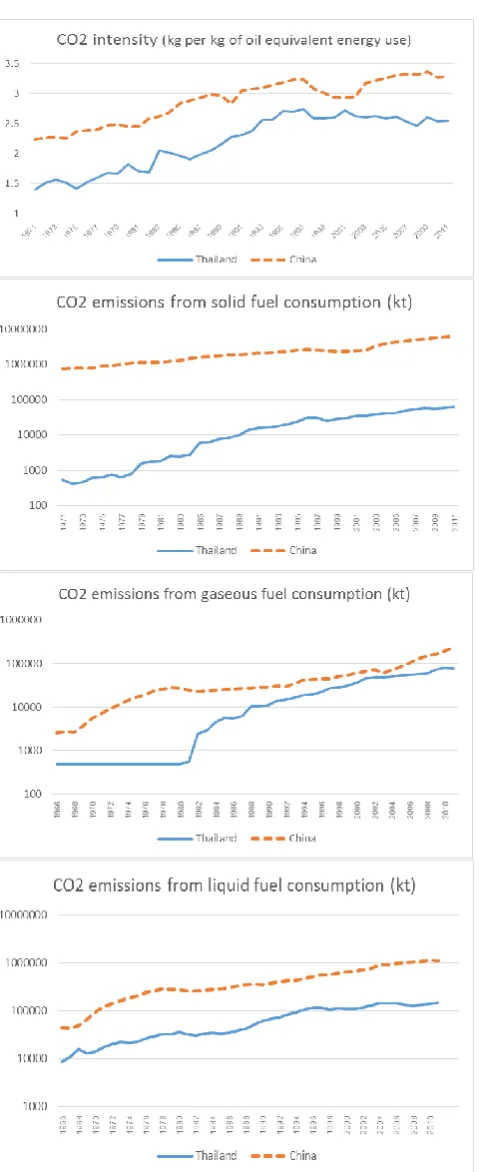
The intensity of CO2 and the amount of CO2 emissions from solid, liquid, and gaseous fuel consumptions are given in Fig. 3. The amount of CO2 emissions in China are much higher than the emissions in Thailand. Therefore, we have to plot the CO2 emissions graphs in a logarithmic scale.
TABLEII
STATISTICS OF THAILAND (1966-2013)
Attribute Minimum Maximum Mean SD
EnergyDe 0.00 5.58 1.24 1.48
MineralDe 0.00 0.38 0.08 0.10
NatResDe 0.86 6.60 2.30 1.38
ForestDe 0.33 2.87 0.98 0.55
ForArea 27.41 33.30 31.22 1.55
AgriCH4 54,525.00 64,239.20 59,429.46 4,007.06
AgriN2O 13,476.10 19,999.20 15,450.20 2,594.97
IndN2O 0.00 554.60 389.88 226.27
N2O 19,479.10 30,244.00 22,901.58 4,311.29
GreenH 453.10 1,429.50 1,129.80 398.75
CO2 9,479.20 303,370.91 116,031.06 97,304.76
CO2Gas 0.00 81,048.03 20,399.20 24,494.82
CO2Liq 8,544.11 145,642.24 68,569.71 47,823.43
CO2Solid 194.35 62,265.66 18,255.04 19,895.62
CO2Intens 1.41 2.74 2.19 0.45
PM2.5 16.88 22.36 19.11 2.19
TB 119.00 171.00 143.08 17.37
HealthExp 3.32 4.57 3.78 0.35
SurviF 57.50 83.92 73.67 8.36
SurviM 48.59 71.56 62.05 6.97
TABLEIII
STATISTICS OF CHINA (1966-2013)
Attribute Minimum Maximum Mean SD
EnergyDe 0.12 13.58 3.67 3.32
MineralDe 0.01 2.13 0.40 0.54
NatResDe 0.78 15.31 4.65 3.70
ForestDe 0.04 1.70 0.58 0.50
ForArea 16.74 21.86 19.39 1.68
AgriCH4 485,702.90 589,862.10 538,723.54 43,789.13
AgriN2O 253,401.90 415,149.00 338,927.86 62,798.59
IndN2O 10,056.10 17,906.40 14,195.62 2,942.71
N2O 318,401.60 550,296.80 445,905.10 91,986.68
GreenH 12,353.20 249,362.00 143,215.30 102,862.97 CO2 433,234.05 9,019,518.22 2,915,785.24 2,210,014.15
CO2Gas 2,570.57 239,722.79 48,604.01 51,847.76
CO2Liq 42,533.53 1,145,178.43 449,511.30 317,493.23
CO2Solid 383,912.90 6,613,797.53 2,195,858.03 1,586,184.64
CO2Intens 2.24 3.37 2.87 0.36
PM2.5 39.30 54.36 48.43 6.46
TB 70.00 152.00 106.29 25.22
HealthExp 3.55 5.57 4.65 0.51
SurviF 49.13 86.65 75.07 9.52
SurviM 41.19 82.18 69.14 10.47
Fig. 1. Graphical comparison of survival to age 65 of population in Thailand versus China both male and female from the year 1966 to 2013.
[image:2.595.40.293.330.545.2] [image:2.595.309.544.379.758.2] [image:2.595.40.291.580.786.2]Fig. 3. The trends of CO2 intensity and CO2 emissions from different kinds
of fuel consumptions in Thailand comparing to China.
B. Methodology for Data Analysis
To study the effect of CO2 emissions and other related environmental factors such as deforestation, energy depletion, and PM2.5, to the survival to age 65 of population in the same generation, we employ the two analysis techniques: linear regression and regression tree using M5’ algorithm. We perform both techniques on the WEKA software [4].
First, we analyze the panel data with the linear regression algorithm. We set the software to report only important factors to the estimation of survival rate. Importance has been set through the ridge parameter (=0.1) and primary attributes contributing to the best predictive model are selected via a greedy method.
We then improve the model’s correctness by using a more sophisticate algorithm, namely M5’ (or M5P in WEKA). The higher correlation and less error have to be traded off with the more complicate models. To induce a shallow tree, we set the minimum number of instances at leaf to be 10.
III. ANALYSIS RESULTS
A. Linear Regression Model Comparison
The models induced by the linear regression with greedy attribute selection method are given in Fig.4. The R2 and RMSE metrics are in Fig.5. It can be seen that total health expenditure (% GDP) allocated from the government is the major positive factor appearing in every model. Intensity of CO2 and net forest depletion (% GNI) are the two negative factors lessen survival rate of population in Thailand.
In China the amount of CO2 emissions from gaseous fuel consumption is the negative factor to the survival rate of both male and female. The models also show that energy and natural resource depletion (% GNI) has positive effect on survival rate of Chinese population. At this stage, we cannot justify this relationship; it needs more elaborate study.
Survival to age 65 of Female in Thailand = 61.3353 +
7.5324 * HealthExp + 0.0002 * CO2Liq +
9.4969 * CO2Int +
7.6702 * ForestDe
Survival to age 65 of Male in Thailand = 50.3872 +
7.4893 * HealthExp + 0.0001 * CO2Liq +
9.177 * CO2Int +
6.8511 * ForestDe
Survival to age 65 of Femalein China = 40.3572 +
4.188 * HealthExp + 0.4385 * EnergyDe +
0.0002 * CO2Gas
Survival to age 65 of Malein China = 28.7958 +
5.0041 * HealthExp + 0.4324 * NatResDe +
[image:3.595.316.533.449.757.2]0.0002 * CO2Gas
Fig. 5. R-square and root mean squared error (RMSE) measurements of the linear regression models (tested with 10-fold cross validation).
B. Regression Tree Model Comparison
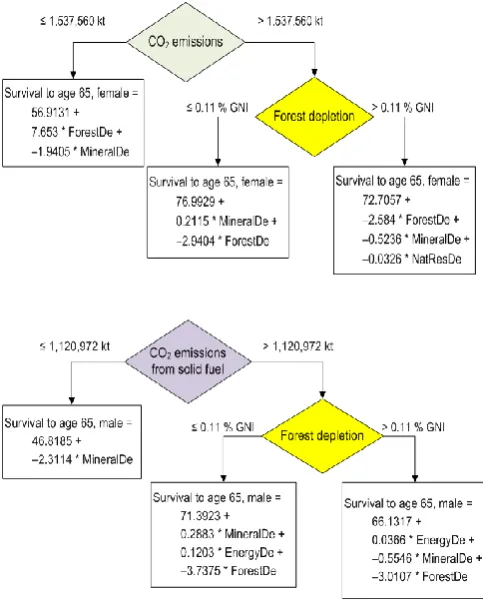
The results of regression tree models for female and male survival rate of population in Thailand and China are given in Figs. 6 and 7, respectively. Each model contains 3 regression relationships. To select the appropriate model, we have to consider some attribute values first. For example, to estimate survival rate of Thai female, the consideration is as follows.
(1) Consider the amount of CO2 emissions.
(1.1) If the amount is less than or equal to 47,322 kt, then the regression is:
Survival to age 65 = 63.6344 +
0.0027 * CO2 emissions from solid fuel +
-1.6417 * energy depletion (1.2) If the amount is higher than 47,322 kt, then consider percentage of energy depletion (1.2.1) If energy depletion is less than or equal to
2.795 % of GNI, then the regression is:
Survival to age 65 = 72.8005 +
0.0001*CO2 emissions from solid fuel +
0.2815*energy depletion
(1.2.2) If energy depletion is higher than 2.795 % of GNI,
then the regression is: Survival to age 65 = 74.8373 +
0.0001*CO2 emissions from solid fuel +
0.4105*energy depletion
Other tree models can be interpreted in the same manner. In Thailand, both male and female survival rate models have CO2 emission and energy depletion (percentage of gross national income) as decision criteria for selecting the appropriate regression. In all regression relationships at the leaf nodes, forest depletion shows negative effect to the survival to age 65.
[image:4.595.302.550.67.360.2]Fig. 6. Regression tree models of survival to age 65 of female (above) and male (below) population in Thailand.
[image:4.595.304.546.454.755.2]In China, the tree models have forest depletion as the second level of decision, whereas the first criteria in female is CO2 emission. But in male, it is CO2 emission from solid fuel consumption (i.e., coal and wood). Forest depletion also shows negative effect to estimation of the survival to age 65 of both male and female population.
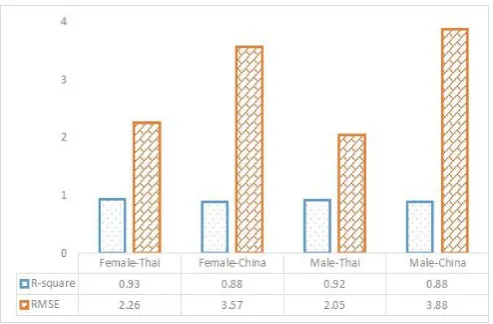
[image:5.595.47.294.202.364.2]The correlation (R2) and error (RMSE) metrics are shown in Fig.8. In regression tree models, R2 is much higher than those in the linear regression model. RMSE is also lower than the linear regression model. The only drawback of regression tree model is its complexity.
Fig. 8. R-square and root mean squared error (RMSE) measurements of the regression tree models (tested with 10-fold cross validation).
IV. CONCLUSION
In this paper, we present the analysis results of survival rate estimation of population in Thailand, comparing to the survival rate to age 65 of people in China. The predictive attributes used in our study are environment factors, health expenditure, natural resource depletion, energy and mineral depletion, carbon dioxide (CO2) emissions from gas, liquid, and solid fuel sources, and CO2 intensity. Our hypothesis is that the CO2 emissions and its intensity, as well as other environmental and health factors, should directly affect good health and longevity of population.
We perform data analyses with two techniques: (1) linear regression using ridge parameter 0.1 and greedy method to select predictive attributes, and (2) regression tree using M5’ algorithm setting number of instances in leaf node to be at least 10. Such parameter setting is for model simplicity and the avoidance of over-fitting.
The results have shown that deforestation is the major factor lessen survival to age 65 of people, both male and female, in Thailand and China. The amount of CO2 emissions (measured in kiloton) is the first decision attribute appearing at the root node of regression trees. This identifies the importance of CO2 emissions in predicting the survival rate of population. The second decision attribute appeared in the regression tree to predict survival to age 65 of population in Thailand is energy depletion measured as percentage of gross national income. In China, the decision attribute at the second level of regression tree is net forest depletion (also measured as percentage of gross national income).
Linear regression method generates a simpler and easier-to-interpret models. Its correlation coefficients are 0.86 and 0.89 for Thai male and female survival estimation, respectively. For Chinese estimation, this figure is around 0.74. The correlation coefficients for survival rate estimation have been improved to 0.94 and 0.97 for Chinese and Thai population, respectively. It can be clearly seen from the empirical results that regression tree technique yields a better predictive model, but the result is not a single model. It instead gives a group of models for user to select according to some decision attributes. This complication is a trade-off for its good performance.
REFERENCES
[1] V. Bellassen, R. Crassous, L. Dietzsch, and S. Schwartzman, “Reducing emissions from deforestation and degradation: what contribution from corbon markets?” Climate Report, no. 14, September 2008.
[2] V. Bosetti, R. Lubowski, A. Golub, and A. Markandya, “Linking reduced deforestation and a global carbon market: implications for clean energy technology and policy flexibility,” Environment and
Development Economics, vol. 16, no. 4, August 2011, pp. 479–505.
[3] V. De Sy, M. Herold, F. Achard, R. Beuchle, J. Clevers, E. Lindquist, and L. Verchot, “Land use patterns and related carbon losses following deforestation in South America,” Environmental Research
Letters, vol. 10, 2015, 124004.
[4] M. Hall, E. Frank, G. Holmes, B. Pfahringer, P. Reutemann, and I. Witten, “The WEKA data mining software: an update,” SIGKDD
Explorations, vol. 11, no. 1, 2009, pp. 10–18.
[5] K. Hassan and R. Salim, “Population aging, income growth and CO2
emission: empirical evidence from high income OECD countries,”
Journal of Economic Studies, vol. 42, no. 1, 2015, pp. 54–67.
[6] G. Holmes, M. Hall, and E. Frank, “Generating rule sets from model trees,” in The 12th Australian Joint Conference on Artificial
Intelligence, 1999, pp. 1–12.
[7] S. Lugauer, R. Jensen, and C. Sadler, “An estimate of the age distribution’s effect on carbon dioxide emissions,” Economic Inquiry, vol. 52, no. 2, April 2014, pp. 914–929.
[8] R. Quinlan, “Learning with continuous classes,” in The5th Australian
Joint Conference on Artificial Intelligence, 1992, pp. 343–348.
[9] M. Qureshi, N. Khan, A. Rasli, and K. Zaman, “The battle of health with environmental evils of Asian countries: promises to keep,”
Environmental Science and Pollution Research, vol. 22, no. 15,
August 2015, pp. 11708–11715.
[10] V. Rattanavaraha and S. Jomnonkwao, “Trends in Thailand CO2 emissions in the transportation sector and policy mitigation,”
Transport Policy, vol. 41, 2015, pp. 136–146.
[11] Y. Wang and I. Witten, “Induction of model trees for predicting continuous classes,” in Poster Papers of The 9th European
Conference on Machine Learning, 1997.
[12] World Bank, World Development Indicators, 2015. Available: http://databank.worldbank.org/data/home.aspx