Abstract— Nigeria being the most populous nation in Africa with over 55% of its population as children and youths of school age has not witnessed corresponding development in infrastructure, educational facilities and resources to cater for the growing population of students. In quest for better standards, especially since the mid-1980s, there has been high mobility of students, academic staff and professionals. Also, new methods of delivery educational services and cross-border providers have emerged over the years, coupled with globalization issues in education, Quality Assurance (QA) in education has drawn concerns from governments, industry and other stakeholders in international education. A number of QA procedures have been presented by regulatory bodies of various nationalities. As a result of the observed disparity between the high population of school age youth in Nigeria and the inadequate educational resources, coupled with the low level integration of Information Technology (IT) tools in administration of education in the country, QA in education has not been fully achieved. It is of the view that except conscious and serious effort is made to develop environment specific technologies to deploy IT tools in educational administration, manual procedures for pursuing QA programmes may not yield desirable results. In this study, a model for building a system that can be used to evaluate the performance of academic programmes to determine level of compliance to Minimum Academic Standards (MAS) set by the appropriate regulatory bodies is provided with the architectural framework for building the performance evaluation system.
Index Terms— Higher Education, Quality Assurance, Performance Evaluation, Academic Information Management System, Minimum Academic Standard.
I. INTRODUCTION
n the recent past, Information Technology (IT) and computer technologies have advanced tremendously giving rise to networks and internet technologies. With developments in Graphical User Interface (GUI), hand held devices and internet appliances technologies, computer applications have become extensively integrated into virtually all facets of business and human endeavours. Thus, computers now have great impact on the way we buy at supermarkets, the way postal services and health care services are rendered, travels, banking operations, telecommunications, educational administration activities etc. all depend on appropriate use of IT tools.
Manuscript received July 18, 2014; revised August 10, 2014. Dr. Philipa Omame Idogho is currently the Rector, Auchi Polytechnic, Nigeria. Email: [email protected], [email protected]. Dr. Emadomi Moses Igbape is currently Director, Management Information System, Auchi Polytechnic, Nigeria. Email: [email protected], emigbape @auchipoly.edu.ng.
Nigeria has an estimated population of 167 million persons and is regarded as the sixth most populous nation in the wprld after China, India, USA, Indonesia and Brazil [1]. According to the United States Census Bureau, the population of Nigeria will reach 402 million by 2050. Nigeria will then be the 4th most populous country in the world. The age structure by year 2011 estimates is as follows; 0-14 years:40.9% (male 32,476,681/female 31,064,539), 15-64 years: 55.9% (male 44,296,228/female 42,534,542) 65 years and over: 3.1% (male 2,341,228/female 2,502,355) (2011 est.) An estimated figure of over 50% of this population is made up of children and youth of school age [2].
Planning and developing adequate educational facilities and resources to cater for this ever increasing population pose serious challenges to education providers. The consequence of this population explosion on quality education is not farfetched. The facilities and other resources are grossly inadequate. This greatly impacts on Quality Assurance (QA) in education at all levels.
In quest for better standards, especially since the 1980s, there has been high mobility of students, academic staff and professionals. In parallel, new delivery modes and cross-border providers have appeared, such as campuses abroad, electronic delivery of higher education and for-profit providers. These new forms of cross-border higher education offer increased opportunities for improving the skills and competencies of individual students and the quality of national higher education systems [3]. Coupled with globalization issues in education, QA in education has drawn concerns from governments, industry and other stakeholders in international education. Every institution strives to have a fair share of the global market and gain competitive advantage. This calls for serious consideration for QA issues in education.
Regulatory bodies of various nationalities have outlined procedures for QA. However, QA has not been fully achieved in the Nigerian education system; (i) there is low level integration of IT tools in educational administration and service delivery; (ii) the resources available for delivering educational services are inadequate due to the explosive population of school age persons in Nigeria [4]. It is of the view that except conscious effort is made to develop environment specific technologies to deploy IT tools in school administration, manual procedures for pursuing quality assurance programmes in Nigeria may not yield desirable results.
Consequently, the goal of this work is to present a model and architectural framework for building an Academic Information Management System that can be used to evaluate performance of academic programmes in order to
Performance Evaluation Model for Quality
Assurance in Nigeria Higher Education
Emadomi M. Igbape, and Philipa O. Idogho,
Member, IAENG
determine compliance with Minimum Academic Standards (MAS) set by the appropriate regulatory agency.
To achieve the above objectives, a review of available literature on QA procedures was carried out. Thereafter, the accreditation guidelines provided by National Board for Technical Education (NBTE) and the Nigerian Universities Commission (NUC) have been examined. The model and architectural framework for developing a performance evaluation system provided here sre based on the procedures specified by NBTE and NUC for evaluating the performance of academic programmes in Nigeria tertiary institutions.
It is hoped that developers will find this framework suitable for developing enterprise solution for QA in Nigeria schools.
II. BACKGROUNDTOTHESTUDY A. Higher Education (HE)
In a society full of diversity, ideologies and opinions, HE means different things to different people [5]. There is more to Higher Education than the higher level of educational structure in a country. In terms of the level, HE includes college and university teaching-learning towards which students’ progress is assessed to attain higher educational qualification. HE imparts indebt knowledge and understanding so as to advance the students to new frontiers of knowledge in different walks of life (subject domain). It is about knowing more and more about less and less. It develops the students’ ability to question and seek truth and makes him/her competent to critique on contemporary issues. It broadens the intellectual powers of the individual within a narrow specialization but also gives him or her, wider perspective of the world around [5].
B. Role of Higher Education in Society
Higher Education is generally understood to cover teaching, research and extension. It is the source of feeder system in all walks of life and therefore supplies the much needed human resources in management, planning, design, teaching and research. Scientific and technological advancement and economic growth of a country are as dependent on the HE system as they are on the working class. Development of indigenous technology and capabilities in agriculture, food security and other industrial areas are possible when there is quality HE system and infrastructure. Higher education also provides opportunity for life-long learning, allowing people to upgrade their knowledge and skills from time to time based on the societal needs.
Reference [5] lists the roles of higher education institutions in modern society.
The Delors Commission on Education for the 21st Century [3] highlighted four pillars of education as learning to know, learning to do, learning to live together and learning to be. HE in addition to inculcating these core values in the individual and the society should strive to achieve the following functions;
(i) To prepare students for research and teaching;
(ii) To provide highly specialized training courses adapted to the needs of economic and social life;
(iii) To be open to all, so as to cater to the many aspects of lifelong education in the widest sense; and
(iv) To promote international cooperation through internationalization of research, technology networking, and free movement of persons and scientific ideas.
C. Quality Assurance In Higher Eduacation
Quality Assurance is the systematic review of educational programmes to ensure that acceptable standards of education, scholarship and infrastructure are being maintained [3].
Quality means different things to different people. Quality is defined as the totality of features and characteristics of a product or service that bears on its ability to satisfy stated or implied needs [5]. Quality can be viewed from five different approaches [6], which are;
(i) In terms of exceptional (exceeding high standards and passing a required standard); (ii) In terms of consistency (exhibited through “zero defects” and “getting right the first time”, making quality a culture; (iii) As fitness for purpose (meaning the product or service meets the stated purpose, customer specifications and satisfaction); (iv) As value for money (through efficiency and effectiveness); and (v) As transformative (in terms of qualitative change).
A lot of people consider quality as a relative term that has many dimensions that form a fuzzy entity referred to as quality through social consensus rather than defining it. The various available definitions have therefore been classified into five main groups [5]; (i) Transcendent definitions. These definitions are subjective and personal. They go beyond measurement and logical description. They are related to concepts such as beauty and love; (ii) Product-based definitions. Quality is seen as a measurable variable. The basis for measurement is objective attributes of the product; (iii) User-based definitions. Quality is a means for customer satisfaction. This makes these definitions individual and partly subjective; (iv) Manufacturing-based definitions. Quality is seen as conformance to requirements and specifications; and (v) Value-based definitions. These definitions define quality in relation to cost. Quality is seen as providing good value for costs.
It is adduced that the meaning of quality is contextual, ranging from “standard” to “excellence”. These two concepts are deeply rooted in their respective values and operationalized in individuals, institutions as well as national practice. Standards can be defined in terms of “minimum threshold” by which performance is judged. In Nigeria for instance, Minimum Academic Standards (MAS) is being referred to, which is set by the supervisory agency for the various categories of higher institutions.
considered as minimum standards. In higher education, the objective is to achieve the standards and move towards excellence.
D. Need for Quality Assurance in Higher Eduacation
The UNESCO guidelines for quality provision in Cross-border Higher Education states the purposes of the guidelines for quality provision in HE as protection of students and other stakeholders from low quality provision and disreputable providers as well as to encourage the development of quality cross-border higher education that meets human, social, economic and cultural needs [3].
In recent times, especially since the 1980s, there has been high mobility of students, academic staff and professionals. In parallel, new delivery modes and cross-border providers have appeared, such as campuses abroad, electronic delivery of higher education and for-profit providers. These new forms of cross-border higher education offer increased opportunities for improving the skills and competencies of individual students and the quality of national higher education systems [3].
To have a share of the global market and gain competitive advantage is a desire of every institution. Therefore, all stakeholders should be conscious of quality of teaching programmes in institutions. Reference [5] sets out some reasons for QA in higher education;
(i) Competitions: There is a new regime, where competition among educational institutions for students and funds will be highly significant. With globalization and the GATS (Global Agreement on Trade in Services), the educational environment will be seized by increased competition. In order to survive in such a situation, educational institutions need to worry about quality;
(ii) Customer satisfaction: Students, parents or sponsoring agencies as customers of the educational institutions are now highly conscious of their rights or getting value for their money and the time spent. They are now demanding good quality teaching and receiving employable skill sets, and thus one should constantly worry about the relevance of courses and programmes to the needs of the labour market;
(iii) Maintaining standards: As educational institutions, one is always concerned about setting own standards and maintaining it continuously year after year. In order to maintain the standards, one should consciously make efforts to improve quality of the educational transactions as well as the educational provisions and facilities.
(iv) Accountability: Every institution is accountable to the stakeholders in terms of the funds (public or private) used on it. Concern for quality will ensure accountability of the funds utilized and inform the stakeholders about taking appropriate decisions. Thus quality can be considered as a monitoring mechanism;
(v) Improve employee morale and motivation: Concern for quality as an institution will improve the morale and motivation of the staff in performing their duties and responsibilities. If a quality system is in place, the internal processes would be systematic, making every department complementing each other’s service domain and helping in
developing internal customer satisfaction leading to high morale and motivation;
(vi) Credibility, prestige and status: If one is concerned about quality, continuously and not once in a while, it brings in credibility to individuals and the institution because of consistency leading to practice, status and brand value; and
(vii) Image and visibility: Quality institutions have the capacity to attract better stakeholder support, like getting merited students from far and near, increased donations/grants from philanthropic/funding agencies and higher employer interest for easy placement of graduates.
Reference [3] notes that in some countries, the national frameworks for quality assurance, accreditation and recognition of qualifications take into account cross-border HE, in many countries they are still not geared to addressing the challenges of cross-border provisions. Furthermore, the lack of comprehensive frameworks for coordinating various initiatives at international level, together with diversities and unevenness of the quality assurance and accreditation systems at the national level, create gaps in the QA of cross-border HE leaving some cross-cross-border HE and provision outside any framework of QA and accreditation.
The quality of a country’s HE sector and its assessment and monitoring is not only key to the social and economic well-being; it is also a determining factor affecting the status of that HE system at the international level. The establishment of quality assurance system has become necessary, not only for monitoring quality in HE delivered within the country, but also for engaging in delivery of HE internationally.
E. Quality Assurance Methodologies in Higher Eduacation.
Quality Assurance is the responsibility of everyone in the educational institution, though the top management sets the policies and priorities. QA should be a continuous and on-going process. It should not be considered as one time activity for accreditation alone. However, External Quality Monitoring (EQM) can be found in all types of higher education system [9].
It is highly recommended that every high institution develops internal QA mechanism. This unit within the institution will prepare the institution for External Quality Monitoring (EQM) which is accreditation exercise. Therefore, understanding the criteria for QA and adhering to best practices will significantly facilitate success in this direction. Across the world, QA is carried out in the following ways [5]; (i) Self-evaluation; (ii) Peer review by panel of experts, usually including at least some external panel members and one or more site visits; (iii) Analysis of statistical information and/or use of performance indicators or the best practices benchmarking; (iv) Surveys of students, graduates, employers, professional bodies; and (v) Testing the knowledge, skills and competencies of students.
(iv) Final decision by the executive committee of NAAC. Real quality that is sustainable is one that is assessed by self [5]. This is how to know what our strengths and limitations are. Self-evaluation is like looking ourselves in a mirror. It is therefore advisable that institutions submitting a self-study report need be self-critical and reflective. Otherwise the external input into quality control will not yield any positive result.
Many of the well-known approaches besides self-evaluation and self- study include;
(1) Best Practices Benchmarking
Benchmarking entails the process of recognizing ‘best practices’ in the industry and implement them. It is defined as “a continuous systematic process for evaluating the products, services and work processes of organizations that are recognized as representing the best practices for the purpose of organizational improvement” [5]. As a process, this has four main activities; (i) Comparing one thing with the other; (ii) Creating and using criteria to evaluate differences between two things and recognizing which is better; (i) Use the experience to identify the direction for change; and (ii) Implement the required change to improve.
Although benchmarking is a relatively new concept in education, its use is expected to bring about huge benefits in terms of continuous improvement of quality. As the best is compared and follow the best institutions, it becomes a tool for motivation to change.
(2) External Quality Monitoring
EQM has become mandatory in many countries. It reassures external stakeholders such as employers, professional bodies and the general public about the legitimate quality of higher education institutions. It also offers an impartial and objective mechanism for assessing the educational institution by a peer team not directly related to the institution. Visit by a peer team is a common activity in EQM, which critically analyses the self-study report and the quality provisions based on established criteria.
Other approaches include the Unit of Assessment and Market-driven approaches. The issue of quality is so important these days that ranking of educational institutions has become a dominant factor in business. In order to capitalize on the internal quality and to add value to the quality assessment, EQM is highly recommended and is preferred above other approaches. Thus many countries use EQM as a strategy to assess the quality of educational institutions.
F. Quality Assurance Models
Detailed survey, analysis and critic of the existing QA models are outside the scope of this work. For the purpose of proper linkage to the model adopted by NUC in Nigeria, the available and commonly used model is mentioned. Across the world, institutions follow different models of QA; particularly country specific and institution specific models. Some of the commonly used approaches include; (a) Baldrige Criteria, (b) ISO 900:2000, (c) Capability Maturity Model, (d) Six Sigma, (d) Total Quality Management, (e) Towards Total Quality Care [5].
A most commonly used model however is Accreditation Board for Engineering and Technology (ABET) Model.
Established in 1932 as Engineer’s Council for Professional Development (ECPD) follows the accreditation tradition in the USA which requires a voluntary participation by institutions. An internal self-study evaluation forms the basis of the beginning of the accreditation process. Based on the self-study report, the appropriate ABET Commission forms an evaluation team for the site visit. Based on the visit, the peer-team provides the institution with a written report to allow for correction of errors or misrepresentation of facts. The peer team examines the following in comprehensive manner and recommends accreditation and relevant action;
(a) Organization and management of the institution; (b) Education programmes offered;
(c) Maturity and stability of the institution;
(d) Admission process and number students enrolled; (e) Teaching staff and teaching load;
(f) Physical facilities, finances etc.; (g) Curricula contents;
(h) Sample student work;
(i) Record of employment of graduates; (j) Support services to the students; and (k) Clearly stated academic policies.
Accreditation is usually granted for a period ranging from 2-6 years. Depending on the strength or weakness of the programme, the peer team recommends specific action to be taken by the Commission such as; Next General Review 6years; Interim Report and Interim Visit both 2 years; Report Extended and Visit Extended 2 or 4 years; Show Cause 2yrs; Show Cause Extended 2 or 4 years and Not Accredited.
Other known models are NBA Model, NAAC Model, ICAR Model and the DEC Model [5].
III. MODELING APPROACH
The use of manual procedures for pursuing quality assurance programmes in Nigeria higher institutions have not yielded desirable results. Consequently, the goal of this work is to present a model and architectural framework for building a decision an Academic Information Management System that can be used to evaluate performance of academic programmes using IT tools, which will yield desirable QA results
.
A. Methodology
Following design science approach [10], [11] and systems engineering hierarchy approach [12], we relied on the knowledge of the existing practice in Nigeria education sector, derived from work experience, interest and observations, to formulate innovative concepts and research idea that showed potential to improve actual human and organizational capabilities in evaluating performance of academic programmes in Nigerian higher schools.
In an academic institution like the university, the information required for accreditation come from six main performance indicators;
(iv) Funding (v) Library
(vi) Graduate rating by employers
[image:5.595.56.290.61.276.2]Fig 1. Data Integration Concept for QA Information System
Fig 2. Model of Integrated Academic Information Management System (IAIMS) [4].
The desired information come from operational source systems like
(i) Establishment (ii) Bursary
(iii) Academic departments (iv) Library
(v) Estate and Works department.
Each of the operational source systems is a system in its own right, having the full components of a system. A data integration concept considered suitable for the QA information system is illustrated in Fig 1. It is of the view that an integrated academic information management system concept shown in Fig 2, with two basic components is desirable.
(i) The Integration Component Layer
This layer is introduced to hold copies of data extracted from operational source systems. These may be text files or data from relational tables. Here the data from the diverse sources are scrubbed, conformed and standardized into dimension tables. There are no user queries at this layer.
(ii) The Decision Support Component Layer
Two processes take place here; computation and aggregation of assessment scores for classification of performance and optionally, the determination of membership degrees of the attributes in the resulting dimensional tables using trapezoidal function and classification of the attributes using fuzzy classification algorithm.
An illustration using the NUC programmes accreditation scenario is provided. The content of the evaluation forms used by NUC were examined from which the data analyzed in this research are generated. Thereafter, a simulation using queries formulated to provide answers to key management issues raised is carried out.
The NUC accreditation document is explained as follws: (1) Nigerian Universities Commission Programme Evaluation Form (NUC/PEF) document is an evaluation form to be completed by each Accreditation Panel Member.
This document indicates;
(i) The University offering programme/Sub-Discipline/Discipline for which Accreditation is sought;
(ii) Title of Programme; and (iii) Date of Visit (From … To …).
The document contains notes on how the NUC/PEF is to be completed;
(i) The form is completed by scoring relevant sections followed by comments. For programmes having more than one option, the sections of the form dealing with the curriculum, physical facilities, books, journals, staff etc are to be completed for each option of the programme;
(ii) Written comments are precise and to the point; (iii) This form is used to prepare a Statement of Fact Report (SFR);
(iv) The SFR (Accreditation Panel Report Form
(NUC/APRF)) is discussed and signed by the Vice-Chancellor and his team and the Panel Members at the end-of-visit interview; and
(v) The NUC/APRF with comments and recommendations of the panel on the programme/sub-discipline/disciplines to be accredited and each of the individual panel member’s completed NUC/PEF are handed over to NUC at the end of the accreditation visit.
The NUC/PEF has eight components as follows; a. Academic Matters;
(i) The Programme philosophy and objectives; (ii) The curriculum;
(iii) Admission Requirements; (iv) Academic regulations;
(v) Course Evaluation (Examinations and Continuous Assessment);
(vi) Student course evaluation; and (vii) External examination system. b. Staffing;
(i) Teaching staff; (ii) Non-teaching staff;
(iii) Head of department/discipline/sub-discipline; and (iv) Staff development.
c. Physical facilities;
[image:5.595.52.293.351.483.2]Table I. Assessment scores for Computer Science.
(ii) Classroom facilities and equipment; and (iii) Safety and environmental sanitation. d. Financing of the programme by the University; e. Books, journals and other resource materials for the programme;
f. Employers rating of graduates, if any;
g. Panel members and Vice-Chancellor to sign statement APRF; and
h. Panel’s recommendation of the accreditation action to be taken by NUC and comments in support of action recommended.
(2) The NUC/APRF. This document is the statement of fact document. It is to be completed by the Accreditation Panel Members after the end of the visit. It details;
(i) The name of the University;
(ii) Department/Faculty/School/College of the programme/Sub-discipline/ Discipline seeking accreditation;
(iii) Dates of the Accreditation Visit: From ….. To …. ; (iv) Summary of Panel’s findings;
i. Philosophy and objective of the programme; ii. The Curriculum;
iii. Staffing (Teaching, Non-Teaching, Head of department and Staff Development);
iv. Physical facilities (Laboratories etc and Classrooms etc. Equipment and Safety and Environment Sanitation);
v. Financing (Income and Recurrent and Capital Expenditure);
vi. Library Books, Journals and other Resource materials;
vii. University Comment on findings of the Panel (By Vice- Chancellor or representative);
viii. Panel Members’ name, Signature and Date; and ix. Vice-Chancellor’s and HOD’s Names, Signature and
Date. Assessment
Evaluation is carried out by assessing six main performance indicators specified by the NUC Accreditation regulations.
Grading
At the end of the accreditation visit, the executive committee at NUC reviews the reports submitted by the accreditation panel to take a decision on the accreditation status of the programme under consideration. An evaluated
programme may earn any of 3 (three) possible accreditation status;
(i) FULL ACCREDITATION: a minimum of 70% aggregate score and 70% in each of the four core areas of academic matters, staffing, physical facilities and library. This accreditation is valid for 6 (six) years with mid-term review;
(ii) INTERIM ACCREDITATION: aggregate score of not less than 60% or programme with a total score above 70% but which scores less than 70% in any of the indicated 4 (four) core areas. This accreditation is valid for 2 (two) years; and
(iii) DENIED ACCREDITATION: failed to satisfy MAS with less than 60% aggregate score. Admission of new entrants into this this programme ceases until deficiencies are remedied.
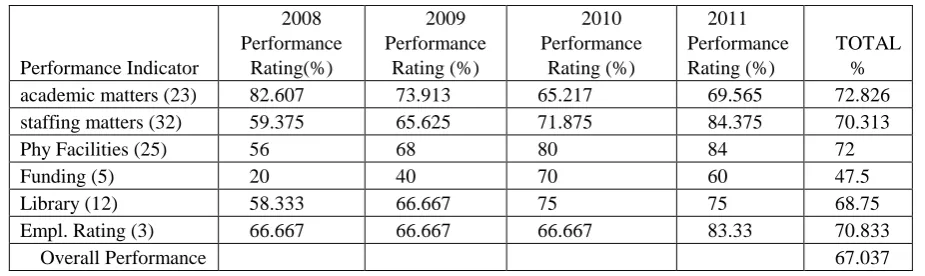
For the purpose of this study, four (4) programmes are used as follows; Computer Science, Law, Accountancy, Biotechnology. For each of the six (6) performance indicators, sample assessment was carried out following the evaluation indices contained in the NUC evaluation form. The result for Computer Science over the four year period is shown in Table I.
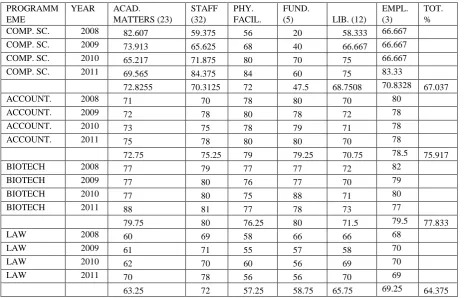
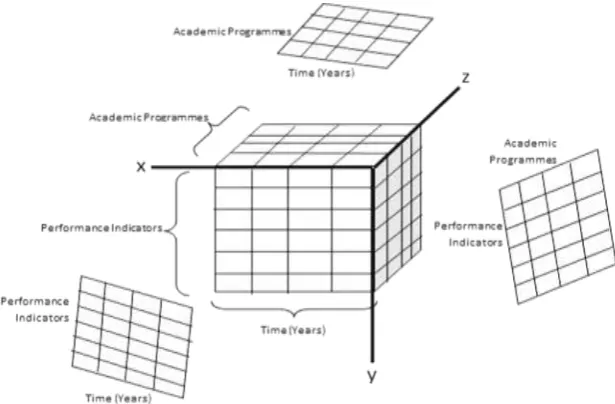
By introducing time and programme dimensions, a data cube can be realized as shown in Table II.
The computed percentage (%) column from table II can be used for analysis and reporting.
B. Data Analysis and Visualization.
Data analysis applications look for trends and unusual patterns in
data. They categorize data values and trends, extract statistical information and then contrast one category
with another [13]. This is achieved through four steps; (i) Formulating queries that extract relevant data from large
database;
(ii) Extracting the aggregated data from the database into a file or table;
(iii) Visualizing the results in graphical way; and (iv) Analyzing the results and formulating new queries. Visualization and data analysis tools do ‘dimensionality reduction’ often by summarizing data along the dimensions of interest. For example, the performance of an academic programme (that is, to check the extent of compliance of a programme to set standards in MAS) is analyzed. It focuses Performance Indicator
2008 Performance
Rating(%)
2009 Performance
Rating (%)
2010 Performance
Rating (%)
2011 Performance Rating (%)
TOTAL %
academic matters (23) 82.607 73.913 65.217 69.565 72.826
staffing matters (32) 59.375 65.625 71.875 84.375 70.313
Phy Facilities (25) 56 68 80 84 72
Funding (5) 20 40 70 60 47.5
Library (12) 58.333 66.667 75 75 68.75
Empl. Rating (3) 66.667 66.667 66.667 83.33 70.833
Table II. Computed assessment scores for 4 departments.
on the role of programme of study, performance indicators and year. The overall performance of a programme across the performance indicators by year may be analyzed.
Queries are formulated to provide answers to enquiries such as;
(i) What is the overall rating of Computer Science programme across all performance indicators for 2008. This can be visualized
for subsequent years;
(ii) What is the overall performance of Computer Science programme in Academic Matters over the years (2008 – 2011)? This can be visualized for other performance indicators;
(iii) What is the overall performance of Computer Science across all performance indicators over the 4 (four) years under review; and
(iv) Assuming all programmes belong to a particular faculty or college, what is the overall performance of all the programmes over the 4-years under review?
C. Application of Cube Operator to Academic Programmes Performance Evaluation.
The concept of aggregation up to 3-dimensions is illustrated using the traditional GROUP-BY which generates N-Dimensional data cube core [13]. The Cube operator is the N-dimensional generalization of the simple aggregate functions.
Creating a data cube requires generating the power set (set of all subsets) of the aggregation columns. The cube as an aggregation operator is a relational operator with group-by and roll-up as degenerate forms of the operator.
A sample cube statement is shown Fig 3.
Fig 3. Sample cube statement
The full discussion of the Cube Operator is adequately covered in [13]. The operator is used in this work to extend the visualization spaces to N-dimension.
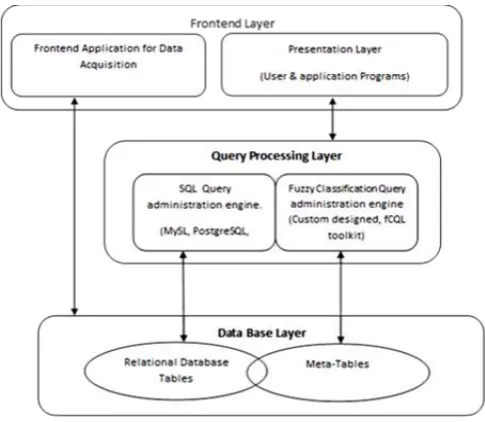
D. Architectural Framework for Implementation.
In this section, an architectural framework for the design of a decision support system for an integrated academic information management, which is considered suitable for QA is presented in Fig 6. The prototype used to simulate examples in this work was achieved through interfaces created to enable access to the database system.
This requires knowledge of the structures of the database tables and meta-tables.
This architecture will work well for PostgreSQL 8 for Windows or MySQL database engine as well as Microsoft SQL Server database engine. It is to be noted that the database engine adopted will determine the specific syntax PROGRAMM
EME
YEAR ACAD. MATTERS (23)
STAFF (32)
PHY. FACIL.
FUND.
(5) LIB. (12)
EMPL. (3)
TOT. %
COMP. SC. 2008 82.607 59.375 56 20 58.333 66.667
COMP. SC. 2009 73.913 65.625 68 40 66.667 66.667
COMP. SC. 2010 65.217 71.875 80 70 75 66.667
COMP. SC. 2011 69.565 84.375 84 60 75 83.33
72.8255 70.3125 72 47.5 68.7508 70.8328 67.037
ACCOUNT. 2008 71 70 78 80 70 80
ACCOUNT. 2009 72 78 80 78 72 78
ACCOUNT. 2010 73 75 78 79 71 78
ACCOUNT. 2011 75 78 80 80 70 78
72.75 75.25 79 79.25 70.75 78.5 75.917
BIOTECH 2008 77 79 77 77 72 82
BIOTECH 2009 77 80 76 77 70 79
BIOTECH 2010 77 80 75 88 71 80
BIOTECH 2011 88 81 77 78 73 77
79.75 80 76.25 80 71.5 79.5 77.833
LAW 2008 60 69 58 66 66 68
LAW 2009 61 71 55 57 58 70
LAW 2010 62 70 60 56 69 70
LAW 2011 70 78 56 56 70 69
Fig 4. XYZ planes visualization of QA data
of the SQL commands. The three-tier architecture framework built with MySQL / PostgreSQL on three schema is adopted [14].
The system is achieved by extending the relational database schema through the addition of meta-tables to the system catalogue. The meta-tables contain definitions of linguistic variables and terms as well as description of classes and information regarding membership functions and determination of membership degrees. The business data and the meta-tables are independent of one another so updates to meta-tables do not affect the integrity of the business data.
Developers can create frontend applications for the query processing layer using technologies provided by the .NET development environment. These include the visual studio.NET suite and the .NET framework Software Development Kit (SDK). PostgreSQL also provides development library for .NET programmers [15]. MySQL database engine and PHP scripts were also used to implement the prototype system.
E. Implementation of Model.
The discussion of the features of standard SQL and some vendor-specific SQL-extensions is adequately covered in [13]. To achieve data analysis requirement of formulation, extraction, visualization and analysis, the concept of N-dimensional generalization of standard SQL aggregate functions and operators is adopted. In this case study, Academic Programmes are classified into segments such as Full Accreditation, Interim Accreditation and Denied Accreditation based on their performance in evaluation using indicators such as academic matters, staffing matters, physical facilities, funding, library and employer rating of graduates.
One of the major goals in decision support systems as stated earlier is to have data stored on a timely basis. A time dimension is therefore necessary in order to have data in
different states at different points in time [14].
The Quality Assurance in higher Education with programmes accreditation case study example used in this work presents data with historical perspective, which creates a multi-dimensional or star schema data structure. The case study is therefore a valid example to demonstrate the viability of this decision support model of an Academic Information Management System.
Example 1
The University administrators may want to know the overall rating of Computer Science programme across all performance indicators for 2008. This is a dice operation over a sub cube visualizing the overall assessment score grouped by programme but executed on the dimension of time (year = 2008). This visualization is a 1-dimension data cube. Formally, the proposed operation is achieved by the SQL in Fig 5. The result of the operation is shown in table III.
[image:8.595.95.403.49.251.2]Fig 5. Sample SQL for example 1.
Table III. Result set for example1 query. Programme Year Perf.
Indicator
Performance Rating (%) Computer
Science
Fig 6. Architectural Framework for the System.
This query can be extended for all programmes under assessment to get the result set in Table IV. This is a 2-dimension data cube visualization as shown by the Y-Z plane of Fig 4.
The interest may be on the overall performance of Computer Science across all performance indicators over the 4 (four) years under review. This is a symmetric aggregation called cross-
Table IV. Result set for example 1 extended over all programmes
Example 2
Programme Year Perf. Indicator
Performance Rating (%)
Computer Science 2008 ALL 62.02
Law 2008 ALL 56.015
Accountancy 2008 ALL 60.02
Biotechnology 2008 ALL 64.02
tabulation (cross-tab). It is a two-dimensional aggregation which is equivalent to the relational aggregation using the ALL values. Both generalize to N-dimensional cross-tab. This is a 2-dimension data cube visualization as shown by the X-Y plane of Fig 4. The result set is shown in Table V.
F. Grading
An evaluated programme may earn any of the three (3) possible accreditation status;
From the data analysis presented above, the department of Computer Science failed to achieve Full Accreditation status. Though it scored 70% in overall rating, it failed to score up to 70% in Library performance which is one of the four core areas. The accreditation status is therefore INTERIM ACCREDITATION which valid for 2 years.
In this research, we have established that:
i. the model of Integrated Academic Information System provided can resolve the information system impasse in most higher institutions in Nigeria to create positive impact on
QA in higher education.
ii. it is feasible to develop the system that can be used to analyze the multi-dimensional data structure arising from transactions in academic institutions.
iii. the system can be used to predict impact of any performance indicator on future assessment.
Table V. Computer Science Rating Programme Year Perf.
Indicator
Performance Rating (%) Computer
Science
ALL ALL 67.037
G. Conclusion
The graphical model provides a framework for data integration which is considered adequate to resolve the problem of ad-hoc incompatible information systems identified in higher institutions in Nigeria. Standards and best practices have been established in this respect [16].
To provide concrete instantiation through a real life example, University programmes accreditation scenario was used as a case study. The results of the analysis of data realised from the four (4) academic programmes and four (4) years used in this study show that this decision support system will be of tremendous value in administering scarce financial and other resources as well as effective budgeting. A system built with this model can also be used to predict the performance behaviour of a programme in the future by varying the performance indices to provide answers to what if questions. For example, information about staff retirement can be fed into the system so as to determine proactively, the behaviour of staffing matters and to visualize its impact on overall rating of the programme. The system will assist management to visualize performance of programmes at the end of each session to see where the weak indices lie so as to strengthen them and where the strong indices lie so as to sustain them. Management can also consider the effect of age of equipment or failure, budget cuts or low internally generated revenue on performance of programmes so as to plan proactively before the negative effects manifest.
It is therefore recommended that government and other agencies who are stakeholders in education should sponsor a development project that can use this model and the architectural framework provided to build the Integrated Academic Information Management System (IAIMS) that can be deployed for use in higher institutions for performance evaluation as a quality assurance means in Nigeria higher education.
H. Further Studies.
Further work is being done on the implementation of this model as well as the introduction of fuzzy concepts to improve the decision support capability of the model.
ACKNOWLEDGMENT
cited in this work. We thank Prof. E. A. Onibere of the department of Computer Science, University of Benin, Nigeria for his guidance in the process of this work.
REFERENCES
[1] NPC “Nigeria Over 167 million population: Implications and Challenges” Vailable: www.population.gov.ng May 14th 2014.
[2] Otedo News, “Demographics of Nigeria” Available: www.ihuanedo.ning.com/profile/blogs/demorgraphics-of-nigeria May 14th, 2014.
[3] UNESCO, “Guidelines for Quality Provision in Cross-border Higher Education” Avalaible: www.unesco.org/education/hed/guidelines. December 2011.
[4] E. M. Igbape, “Fuzzy Logic Modeling of An Integrated Academic Information Management System” Ph.D. dissertation, Dept. Computer Science, University of Benin, Benin City, 2014.
[5] S. Mishra, “Quality Assurance in Higher Education: An Introduction”, National Assessment and Accreditation Council (NAAC), Bangalor, India, 2006.
[6] L. Harvey and D. Green, “Defining Quality,” Assessment and Evaluation in Higher Education: An International Journal, 18(1). [7] EAQAHA, “Quality Assurance of Higher Education in Portugal: An
Assessment of Existing System and Recommendations for Future System” European Association for Quality Assurance in Higher Education, Helsinki, Finland, 2006. www.enqa.eu/pubs.lasso. [8] R. Y. Suleiman, “Quality Assurance and Accreditation: The
Experience of the National Universities Commission of Nigeria.” Dept. of Distance Education, NUC, Abuja, 2008.
[9] L. Harvey, “An Assessment of Past and Current Approaches to Quality in Higher Education,” Australian Journal of Education, 42(3) pp. 237 - 255, 1998.
[10] A. R. Hevner, S. T. March, J. Park, and S. Ram, “Design Science in Information Systems Research,” MIS Quarterly, 28(1), 2004. [11] S. T. March and G. F. Smith, “Design and Natural science Research
on Information Technology,” Decision Support Systems, Issue 15, pp 251 – 266, 1995.
[12] R. S. Pressman, Software Engineering (A Practitioner’s
Approach),5th Ed., McGraw Hill Book Company, Boston, 2005.
[13] J. Gray, S. Chaudhuri, A. Bosworth, A. Layman, D. Reichrt, and M. Venkatrao, “Data Cube: A Relational Operator Generalizing Group by, Cross Tab, Sub-Totals,” Data Mining and Knowledge Discovery,
1 pp 29 -53, Kluwer Academic Publishers, 1997.
[14] D. Fasel and K. Shahzad, “A Data Warehouse Model for Integrating Fuzzy Concepts in Meta-Table Structures,” In 17th IEEE International
Conference and Workshops on the Engineering of Computer Based Systems. Pp. 100 – 109, 2010.
[15] R. Blum, PostgreSQL 8 for Windows, McGraw Hill Book Company, New York, 2007.
![Fig 2. Model of Integrated Academic Information Management System (IAIMS) [4].](https://thumb-us.123doks.com/thumbv2/123dok_us/453630.543355/5.595.56.290.61.276/fig-model-integrated-academic-information-management-iaims.webp)