Comparing Programming Paradigms:
an Evaluation of Functional and
Object-Oriented Programs
R Harrison, L G Samaraweera, M R Dobie, P H Lewis
Dept. of Electronics and Computer Science,
University of Southampton, SO17 1BJ, UK
April 24, 2012
This paper presents the results of the EFOOL project. EFOOL (Evaluation of Functional and Object-Oriented Languages) is a quan-titative evaluation of the functional and object-oriented paradigms. The aim of the project is to investigate whether or not the quality of code produced using a functional language is significantly different from that produced using an object-oriented language.
During the EFOOL project, 12 sets of algorithms were developed, together with a number of utility functions, in both SML and C++. The algorithms were all taken from the image analysis domain. Strict constraints were imposed during the development cycle in order to improve the reliability of the results.
The statistical tests did not reveal any significant differences for the development metrics used which are associated with quality, such as the number of known errors, the number of modification requests, a subjective complexity assessment and so on. Significant differences were found for various code metrics, including the number of dis-tinct functions called, the number of disdis-tinct library functions called, and the ratio of these, which is a measure of code reuse. Finally, a significant difference was also found for the time taken to test the programs, due to different compilation techniques and a difference in the number of test cases executed.
1
Introduction
project is to investigate whether or not the quality of code produced using a functional language is significantly different from that produced using an object-oriented language.
Prior to undertaking this analysis we performed a preliminary investigation to establish a baseline of quality indicators to determine whether the suggested indicators could be used as metrics for the remainder of the project. The results of these preparatory studies are reported in detail in [?, ?], and are discussed briefly in the following section.
The aim of the research presented here was to investigate the following: Does the quality of code produced using a functional language differ from that produced using an object-oriented language ?
This paper reports on the results of performing a quantitative analysis of certain internal attributes which reflect various quality-type properties for a set of object-oriented and functional programs.
2
Method
During the EFOOL project, 12 sets of algorithms were developed, together with a number of utility functions, in both SML and C++. The algorithms were all taken from the image analysis domain. Strict constraints were imposed during the development cycle in order to reduce the confounding effects of the experi-mental variables, as described later in this section. The project team adhered to industrial practices as much as possible, adopting quality assurance methods from industry for the production of requirements, design, and testing documen-tation, as well as following standard techniques from industry for walkthroughs and code reviews.
Defining and measuring software quality is extremely difficult. The classifi-cation, validation and application of metrics has aroused much debate. Fenton [?] proposes a classification system for software measurement which has three main headings for entities whose attributes may be measured: product,process
andresource. In addition, attributes of entities (such as size, modularity, reuse, etc.) may be either internal(meaning that they can be measured in terms of the product, process or resource itself) orexternal(in which case they can only be measured by considering their relationship with the environment).
assumed to be indicative of the external quality-type attributes of the code [?, ?].
• the number of known errors found during code reviews, testing and main-tenance (KE)
• the time to fix known errors (TKE)
• the number of modifications requested during code reviews, testing and maintenance (MR)
• the time to implement modifications (TMR)
• a subjective assessment of complexity, provided by the system developers (SC).
The second set consisted of measures of certain internal attributes of the code, such as length, the number of functions called, the number of functions declared etc., which can be easily measured by examining the delivered code. These measures of internal attributes, which we will refer to as suggested in-dicators or code metrics were collated and tested for correlation against the development metrics listed above.
Using Fenton’s classification system, the development metrics would be clas-sified as internal process measures whereas the code metrics would be clasclas-sified as internal product measures.
Thus EFOOL has addressed 2 questions within one project :
1. is there any correlation between this set of development metrics (known errors, modification requests, subjective complexity, etc.) and the set of chosen suggested indicators (non-comment source lines, number of distinct domain-specific functions called, number of function declarations etc.) ? 2. is there any significant difference between the quality of the code for the
2 different languages ?
If a significant correlation is found between the development metrics and the suggested indicators in (1), then:
a) in future projects we can use static analysis of delivered code to determine its quality as far as modules which are prone to faults, changes, or subjective complexity are concerned. Noting known errors etc. during development then becomes unnecessary.
b) existing code could be assessed for such features very simply.
Significant correlations were detected for many of the suggested indicators; full details are given in [?,?]. In particular, the number of non-comment source lines and the number of function definitions were found to be closely correlated to the development metrics for both paradigms. Also, the number of distinct functions called and the number of domain-specific functions called were found to be correlated to the number of known errors for both paradigms. Further discussion of this research is given in section 6 (Analysis and results).
An answer to question (2) will enable us to offer guidelines to software devel-opers who face a choice of languages when implementing particular applications. If no significant difference is found then other considerations, such as a subjec-tive preference, may become an important factor in the decision.
The result of the investigation may be confounded by a number of variables:
• the experience of the developers with the application
• the experience of the developers with the programming languages
• the application domain
• the development environment
In order to try to reduce the impact of these variables, only one developer was employed for the entire project. Both the application domain, image anal-ysis, and the development environment were kept constant throughout, except for a C++ compiler upgrade which occurred halfway through the project. This necessitated one minor modification which was included in the recorded statis-tics. The developer implemented a number of utility functions and nine image analysis algorithms in SML during the first three months of the project; during the second three months the same algorithms were implemented in C++. For the second half of the project, two more substantial image analysis algorithms were implemented in C++ and then in SML. It was hoped that switching the order of development in this way would help to reduce the confounding effects which may occur due to the developer’s increased knowledge of the application domain and of the programming languages. The programs developed during the second half of the project were fairly complicated, and relied on some of the software developed earlier. Consequently it was necessary to maintain the programs developed early on in the project life cycle for the duration of the project.
the project (design, implementation, testing and maintenance). All documenta-tion and code was reviewed on a fortnightly basis. Language specific test scripts were developed for all of the programs during the design stages.
The method used for this experiment was influenced by [?] and by the guide-lines provided by the DESMET project [?].
3
The application domain
The EFOOL project has developed twelve algorithms taken from the image anal-ysis domain. Restricting the domain in this way reduces the number of variables in the experiment and should help to produce more reliable results. A range of algorithms were specified, designed and implemented, varying from low level al-gorithms which operate on an image array and produce image arrays as output (for example, convolution algorithms) to intermediate level algorithms which operate on image arrays and produce symbolic output (for example, curvilinear feature extraction algorithms).
4
Data collection
The following development metrics (DMs) were collected for every program.
• the number of known errors found during code reviews, testing and main-tenance (KEs).
• the time to fix the known errors (TKEs), measured in minutes.
• the number of modifications requested (MRs) during code reviews, testing and maintenance. This represents the number of changes which were requested excluding changes for fault clearance.
• the time to implement modifications (TMRs), measured in minutes.
• a subjective assessment of complexity (SC), provided by the system de-veloper. This is based on an ordinal integer scale from 1 to 5, where 5 represents the most complex code.
These attributes were measured quantitatively: timings were measured in minutes, and a note was kept of each known error and modification request which occurred. The subjective complexity was given by the developer using an integer from 1 to 5. The programming languages were used during the design, implementation and testing of the programs. The development metrics were collected during implementation, testing and maintenance of the code, and were used in correlation analyses to determine the utility of the code metrics listed later in this section.
• the time taken to develop the programs, measured in minutes (DT)
• the time taken to test the programs, measured in minutes (TT)
These times refer to connect time, that is, actual elapsed time. The code metrics collected are listed below:
• ncsl: the number of non-comment, non-blank source lines (referred to as
non-comment source lines). This was collected automatically after deliv-ery of the source code.
• the number of distinct functions, N* which are called by the program. Each function is only counted once, no matter how many times it is called.
• the number of distinct library functions, L which are called by the pro-gram. In this context, a library function is a general purpose function whose application is not restricted to the image analysis domain
• the number of distinct domain-specific functions, D, where D = N* - L, called by the program.
• the depth of the function hierarchy chart.
• the number of function declarations, dec, which are specified within a program. This represents the size of a program’s public interface.
• the number of function definitions, def, which are coded within a program. This represents the number of functions which have been implemented specifically for one program.
The code metrics were collated after testing, acceptance and maintenance of the programs. The code was tested rigorously through the use of test scripts with assertions. Only when all known errors were fixed was the code accepted as finished. The suggested indicators were produced by static analysis of the source code following final acceptance testing and a period of maintenance.
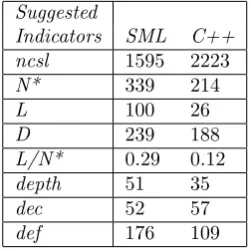
Twelve sets of image analysis algorithms were developed, together with a set of general purpose library functions. During the SML development, 176 functions were defined, consisting of a total of 3,525 non-comment source lines; this required 72 hours of connect time (staff hours) for the implementation and 39 hours for testing. The C++ development produced 109 functions, consisting of 3001 non-comment source lines. Implementation took just over 60 hours of connect time and testing required a further 19 hours. Full details of the results are given in Tables 1 and 2.
5
Analysis and results
Earlier investigations [?, ?] used box plots to consider the distributions of the data sets and found them to be skewed. This was to be expected, as data collected from software development is rarely distributed normally [?,?].
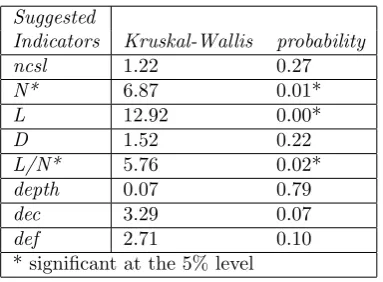
The Kruskal-Wallis one-way analysis of variance by ranks can be used to analyse data which is not normally distributed. [?, ?]. The values from the data sets are ranked and the averages for each data set are calculated. The test assesses whether the difference between the averages of the ranks is significant. The results of the Kruskal-Wallis analysis of the corresponding SML and C++ programs are shown in Tables 3 and 4.
The significant differences (at the 5% level) are listed below, together with the percentage increase which the SML programs demonstrated over the C++ ones:
• the time taken to test the programs, 105% more
• the number of known errors per 1,000 non-comment source lines, 118% more
• the number of functions called, N*, 58% more
• the number of library functions called, L, 281% more
• L/N*, a measure of reuse, 142% more
Testing time showed a significant difference: the SML code took 39 hours to test compared with 19 hours for the C++ code. This can partly be explained by the fact that the C++ compiler produces executable object code which can be run from the command line, whereas the complete SML system must be reloaded in order to run the tests written in SML; although executable object code can be produced by the SML compiler used for this project, the procedure for doing so is not straightforward, and so this facility was not utilised. Another reason for the longer SML testing time is the number of tests which were run: 253 test cases were run for the SML code, compared with just 158 for the C++ programs. This may be due to the larger number of functions called by the SML programs.
The number of known errors per 1,000 non-comment source lines was higher for the SML code than for the C++ code (107 compared with 49), a difference which is significant at the 5% level. Values of 20 to 40 errors per one thousand lines of code [?] are typical of software development projects which use struc-tured programming techniques and formal inspections, and 50 to 60 errors per thousand lines are cited for software developed with unstructured designs and informal testing. The high values reported here were due at least in part to the decision to record all errors, including syntactical ones. An analysis of the errors reported is currently underway.
Turning to the code metrics, there were no significant differences in 5 of the 7 suggested indicators (ncsl, D, depth, dec and def). Of these, ncsl and def had been found previously to be closely correlated to the development metrics for both paradigms, confirming the lack of difference in the quality-type attributes measured by the development metrics.
Both N* and D had previously been found to be correlated to the number of known errors for both paradigms. The difference in the number of distinct functions called, N*, was found to be significant, whereas the number of distinct domain-specific functions called, D, was not. From this we conclude that the difference in N* does not necessarily imply a difference in the number of known errors: this is confirmed by the statistics for the number of known errors.
There is a significant difference in the number of library functions called; this showed no sign of being correlated with the quality-type development metrics in our previous work.
The metric L/N*, the ratio of the number of distinct library functions called to the total number of distinct functions called, shows a significant difference due to the difference in the number of library functions called. The metric, which should lie between 0 and 1, will be equal to 0 only if no reuse has taken place, but will tend towards 1 as the amount of reuse increases. In this study the SML code exhibited greater potential for reuse than the C++ code. However, it should be noted that these figures are affected by the large number of list processing functions (such as map, fold, hd, tl, take, drop, length and so on) which are routinely used by SML programmers. Such functions are commonly used in the composition of functional programs. This should be contrasted with the C++ libraries which are usually used to provide more specialised functionality, such as theiostream,stringandmathslibraries.
In conclusion we may state that in this investigation only a few differences in the quality-type attributes of code written in functional and object-oriented languages have been detected. Further research is planned to determine whether these results would be repeated in a large scale experiment.
6
Conclusions
In this investigation we have compared both development metrics and code met-rics for sets of programs developed using languages from 2 different paradigms. Using algorithms taken from the image analysis domain we performed the entire life cycle for a suite of 12 programs, using both a functional and an object-oriented language.
found in the number of non-comment source lines nor was there any significant difference in the number of function definitions, and both of these had previously been found to be correlated with quality-type attributes for both paradigms. However, 60% more functions were called in the SML code than in the C++, and nearly four times as many library functions. These statistics are reflected in a metric for reuse, which showed that the SML code exhibited one and a half times as much reuse as the C++ code. These results suggest that the use of functional programming languages may encourage a greater degree of reuse than does the use of object-oriented languages. It must be stressed that this is due (at least in part) to the large number of list processing functions which were utilised in the SML programs.
More significant, however, are the differences which werenotfound; no sig-nificant differences were found in the following process metrics: the numbers of known errors, modification requests, the times to attend to these, a subjective measure of complexity, and the total development time.
7
Acknowledgments
The authors wish to acknowledge the support of the University of Southampton Research Committee for a grant to undertake this work.
References
[1] HARRISON, R., SAMARAWEERA, L.G., DOBIE, M.R., LEWIS, P.H.: ‘Measuring the Quality of Functional Programs: an Empirical Investiga-tion’, submitted for publication, July 1994
[2] HARRISON, R., SAMARAWEERA, L.G., DOBIE, M.R., LEWIS, P.H.: ‘An Evaluation of Code Metrics for Object-Oriented Programs’, submitted for publication, July 1994
[3] FENTON, N.E., MELTON, A.: ‘Deriving Structurally Based Software Measures’, J System Software, 1990, 12, pp 177-187
[4] FENTON, N.E.: ‘Software Metrics, A Rigorous Approach’, (Chapman & Hall, 1991)
[5] KITCHENHAM, B.A.: ‘An evaluation of some design metrics’, Software Engineering Journal, 1990, 5 (1), pp 50-58
[6] LAW, D.: ‘DESMET methodology: overall specification’, DESMET Project Deliverable 2.1, National Computing Centre, November 1992 [7] HOAGLIN, D.C., Mosteller, F., Tukey, J.W.: ‘Understanding Exploratory
[8] SIEGEL S.: ‘Nonparametric statistics for the behavioural sciences’, (Mc-Graw Hill, 1956)
[9] SIEGEL, S., CASTELLAN, N.J.: ‘Nonparametric statistics for the be-havioural sciences’, 2nd ed, (McGraw-Hill, 1988)
Development
Metrics SML C++
KE 170 109
(KE/ncsl)*1000 107 49
MR 164 122
SC 34 35
TKE 971 1167
TMR 687 473
DT 4324 minutes 3629 minutes
[image:11.595.194.419.146.271.2]TT 2349 minutes 1148 minutes
Table 1: SML and C++ results: development metrics
Suggested
Indicators SML C++ ncsl 1595 2223
N* 339 214
L 100 26
D 239 188
L/N* 0.29 0.12
depth 51 35
dec 52 57
[image:11.595.244.370.320.446.2]def 176 109
Table 2: SML and C++ results: code metrics
Development
Metrics Kruskal-Wallis probability
KE 2.37 0.12
(KE/ncsl)*1000 11.98 0.00*
MR 0.48 0.49
SC 0.06 0.81
TKE 0.24 0.63
TMR 0.29 0.59
DT 1.11 0.29
TT 4.32 0.04* * significant at the 5% level
[image:11.595.198.416.491.630.2]Suggested
Indicators Kruskal-Wallis probability
ncsl 1.22 0.27
N* 6.87 0.01*
L 12.92 0.00*
D 1.52 0.22
L/N* 5.76 0.02*
depth 0.07 0.79
dec 3.29 0.07
def 2.71 0.10
[image:12.595.212.404.318.459.2]* significant at the 5% level