During the last century, potato (Solanum tu-berosum L.) has become a worldwide elementary staple food. The key reason for this process is the high nutritional value of potato as a carbohydrate source, storability, and ease and divergent uses. Breeding programmes resulted in new cultivars with improved yield potential (Brown 2011). In spite of a significant biological progress during the recent decades, actual yields in many countries are unsatisfactory and fail to rise further. Between 2004 and 2013, the world average yield increased from 17.7 t/ha to 19.5 t/ha (FAOSTAT 2016). The estimated potential yields for Poland (PL) and
the Czech Republic (CZ) are 39.7 t/ha, 47.7 t/ha (Supit et al. 2010), while the actual yields during 2003–2013 ranged from 15–24 t/ha and 23–30 t/ha for PL and CZ, respectively, and from 15–24 t/ha for Albania (AL) (FAOSTAT 2016).
The key reason of much lower real yields is not rooted only in the course of weather, but also results from low efficiency of applied nitrogen (N) ferti-lizer. The current mineral nutrition management in the Central Europe crop production is N-oriented, almost neglecting other nutrients, like phosphorus (P) and potassium (K). As a result, harvested yields are highly year-to-year variable (Grzebisz et al.
Potassium impact on nitrogen use efficiency in potato
– a case study from the Central-East Europe
Witold GRZEBISZ
1,*, Pavel ČERMÁK
2, Evan RROCO
3, Witold SZCZEPANIAK
1,
Jarosław POTARZYCKI
1, György FÜLEKY
41
Poznan University Life Sciences, Poznan, Poland
2Crop Research Institute, Prague, Czech Republic
3Agricultural University of Tirana, Tirana, Albania
4Szent István University, Gödöllő, Hungary
*Corresponding author: [email protected]
ABSTRACT
Grzebisz W., Čermák P., Rroco E., Szczepaniak W., Potarzycki J., Füleky G. (2017): Potassium impact on nitrogen use efficiency in potato – a case study from the Central-East Europe. Plant Soil Environ., 63: 422–427.
Potato yield is affected by an interaction between nitrogen (N) and potassium (K) supply. This hypothesis was veri-fied in a series of field experiments conducted during 2010–2013 in Albania (AL), Czech Republic (CZ) and Poland (PL). The two-factorial experiment was founded on relative scales of K (0, 50, 100, and 150%), and N application rates (75% and 100%) of the recommended doses, which were country-specific. The average tuber yield was doubled for AL, increased by 50% for PL, and by 15% for the CZ in response to K and N interaction. These differences are caused by an increase in the apparent nitrogen efficiency (ANE), which rose significantly by the progressive Krates. Maximum average ANE of 90 kg tubers/kg N was recorded in AL; it was 2-fold lower in CZ. Top average apparent potassium efficiency (AKE) of 65 kg tubers/kg K was recorded in PL; it was 4-times lower in CZ. The relationships between AKE and ANE clearly demonstrate the tight interaction between the N and K, and its effects on potato yield. However, a sound K application management should be adjusted to the local edaphic and climatic conditions.
Keywords: partial factor productivity of N fertilizer; yield gap; Solanum tuberosum L.
2010). It is well-known that potato is a crop of much higher K than N demands (Westermann 2005). The scientific reports about K fertilizer impact on potato yield are controversial, indicating lack or low crop response to high application rates (Li et al. 2015). To explain this discrepancy, an in-depth evaluation of the interaction between N and K and its impact on the potato crop growth and development is required.
The key objective of the present study was to evaluate the effect of progressive rates of K ferti-lizer on the apparent use efficiency of N fertiferti-lizer, based on field experiments conducted in different soil-climate zones of Europe.
MATERIAL AND METHODS
Experimental sites. Field experiments were
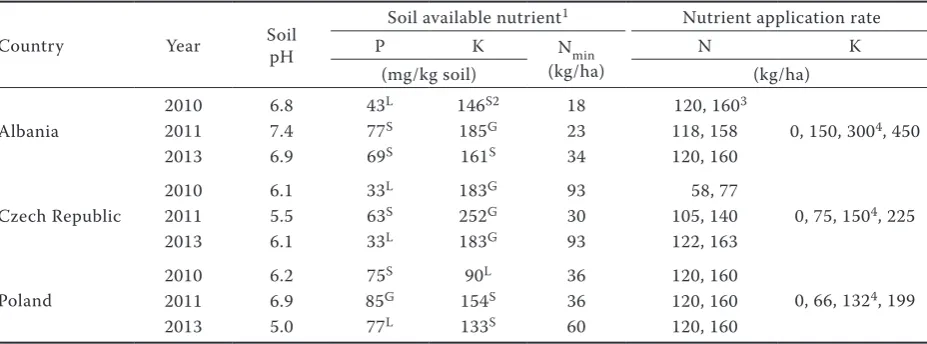
conducted during 2010, 2011 and 2013. The ex-perimental fields were located in several regions of Europe differing in soil and climatic proper-ties: Albania: Fushë Krujë (41°29'N; 19°43'E) – 2010, 2013; Baldushk (41°13'N; 19°48'E) – 2011; Czech Republic: Jaroměřice (49°5'N; 15°53'E) – 2010, 2013; Lipa (49°33'N; 15°32'E) – 2011; Poland: Donatowo (52°05'N; 16°52'E). The trials were established on Vertic Cambisol (AL), Luvisol (Jaroměřice) and Cambisol (Lipa) (CZ), and on Albic Luvisol (PL). In each of the studied sites, the initial content of available K, as shown in Table 1, was satisfactory for high potato yield. The rates of P and N were based on their actual soil content.
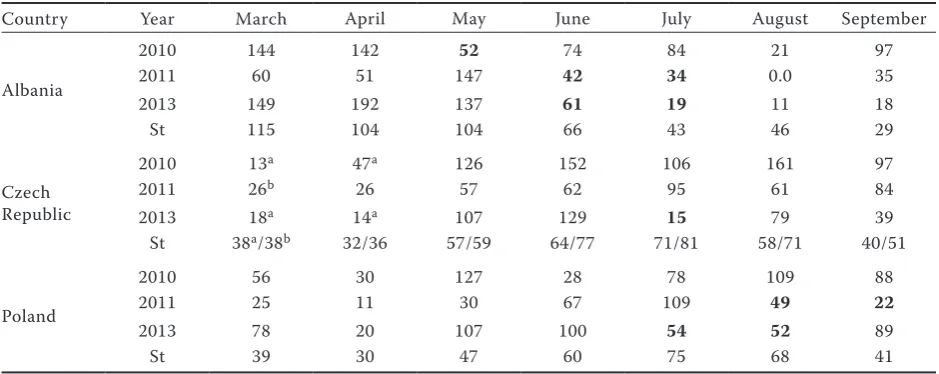
According to Köppen-Geiger classification, Albania is situated in the Mediterranean climatic zone with dry and hot summer (Csa subtype) (Rubel and Kottek 2010). In this country, each year, pe-riods of droughts were recorded during the main season of potato growth. The Czech Republic and Poland belong to the warm temperate fully humid climatic zone (Cfb). Its typical feature is an irregular frequency of droughts, which was pronounced in CZ in July and in PL also in September (Table 2).
Experimental design. Each field experiment was arranged as a two-factorial design, replicated four times, consisting of four rates of K, based on the relative level of the recommended rate: 0, 50, 100, and 150%. The N rate, based on Nmin content, was fixed at the level of 75% and 100% of the recommended rate (Table 1). The potato crop was planted in each site at the optimum date and harvested from an area of 14 m2. The size of a basic
plot was 100 m2 in PL and 50 m2 in AL and CZ.
Indices of N and K use efficiency. The set of N and K use efficiency indices was calculated using the equations:
apparent N use efficiency, ANE = (Yi – Y0)/Nf, kg tubers/kg Nf;
apparent K use efficiency, AKE = (Yi – Y0)/Kf, kg tubers/kg Kf
[image:2.595.65.529.556.728.2]Where: Yi – yield of tubers harvested from the plot with the fixed rate of N, kg/ha; Y0 – yield of tubers harvested from the plot without applied fertilizers, kg/ha; Nf, Kf – nitrogen, potassium fertilizer rate, kg N, K/ha.
Table 1. Soil properties and absolute nutrient application rates employed during a three-year potato experiment in Central-East European countries
Country Year Soil pH
Soil available nutrient1 Nutrient application rate
P K Nmin
(kg/ha)
N K
(mg/kg soil) (kg/ha)
Albania
2010 6.8 43L 146S2 18 120, 1603
0, 150, 3004, 450
2011 7.4 77S 185G 23 118, 158
2013 6.9 69S 161S 34 120, 160
Czech Republic
2010 6.1 33L 183G 93 58, 77
0, 75, 1504, 225
2011 5.5 63S 252G 30 105, 140
2013 6.1 33L 183G 93 122, 163
Poland
2010 6.2 75S 90L 36 120, 160
0, 66, 1324, 199
2011 6.9 85G 154S 36 120, 160
2013 5.0 77L 133S 60 120, 160
1Mehlich 3 procedure; 2classes of available soil phosphorus (P) and potassium (K) content: L – low; S – suitable;
The indicator of N efficiency termed as the partial factor productivity of fertilizer nitrogen (PFPN), relies on gross productivity of applied N. This parameter is required to calculate the yield gap (YG), and the maximum yield (YMAX). In the first step, the average of the fourth quarter of progres-sively rated PFPN values was calculated (cPFPN). The used equations were as follows:
PFPNf = Y/N YMAX = cPFPN × N;
YG = Y – YMAX.
Where: Y – yield of tubers, kg/ha; Nf – nitrogen rate, kg N/ha; cPFPNf – the average of the fourth quarter of the PFPNf data set.
The experimentally obtained data were subjected to the conventional analysis of variance using computer programmes Statistica 10® (StatSoft, Inc., Tulsa, USA). The differences between treat-ments were evaluated with the Tukey’s test. In tables, figures, and equations, F-test results are given at P < 0.05.
RESULTS AND DISCUSSION
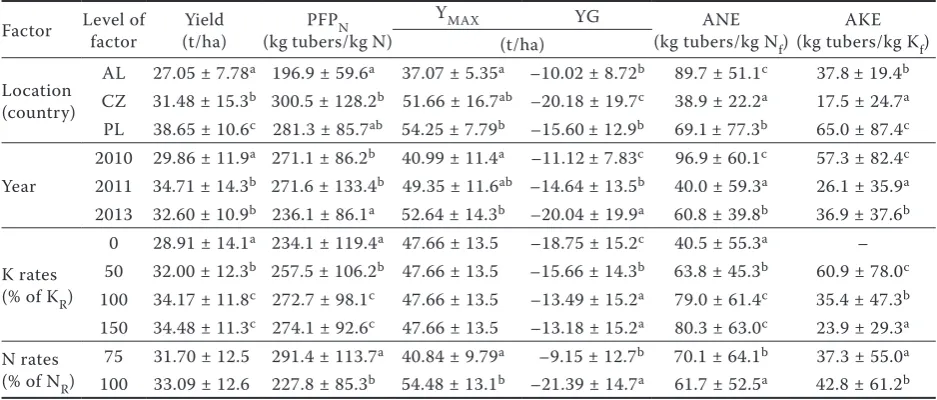
The total yield of potato was affected by all fac-tors (Table 3). It was a result of field location and interaction of K and N. The yield, measured on the plot without applied fertilizers was: 27.5, 25.9, and 14.4 t/ha for CZ, PL, and AL, respectively. The average yield of fertilized crops showed an order:
PL (38.7 t/ha) > CZ (31.5 t/ha) > AL (27.0 t/ha). In response to interactions between K and N, po-tato yields were doubled in AL, increased by 50% in PL, and by 15% in the CZ. In AL, the maximum yield was achieved at 300 kg K/ha. In PL, a rate of 66 kg K/ha was sufficient to obtain the highest yield. In CZ, only a slight response was observed to K applied at the rate of 150 kg K/ha. In all these K treatments, the maximum yield was achieved with the full N rate.
The major reason for potato yields lower than the potential productivity of currently grown cultivars is partly efficiency of N fertilizer (Singh and Lal 2012). The partial factor productivity of N (PFPN) was affected by all factors. The PFPN decreased in the order: CZ (100%) ≥ PL (94%) > AL (57%). Its value around 300 kg tuber/kg N, as calculated for the first two countries, indicates an effective N use. Potassium fertilizer (K) effect on PFPN was progressive only for its lower levels (Table 3). The PFPN is a tool for calculating both the maximum yield and yield gap. A calculated YMAX above 50 t/ha may be achieved in PL and in the CZ; however, it was below 40 t/ha in AL (Table 3). Contradictory to that, the largest average YG, –20 t/ha, was calculated in CZ, but this value was strongly affected by the extremely large YG in 2013 (Table 3). In PL and AL, the results were more stable.
[image:3.595.63.533.112.299.2]The apparent nitrogen efficiency (ANE) re-sponded significantly to all factors, with special emphasis to country (Table 3). The mean ANE value in AL, 90 kg tubers/kg N, was twice as high
Table 2. Average monthly precipitation (mm) during the potato growing seasons1
Country Year March April May June July August September
Albania
2010 144 142 52 74 84 21 97
2011 60 51 147 42 34 0.0 35
2013 149 192 137 61 19 11 18
St 115 104 104 66 43 46 29
Czech Republic
2010 13a 47a 126 152 106 161 97
2011 26b 26 57 62 95 61 84
2013 18a 14a 107 129 15 79 39
St 38a/38b 32/36 57/59 64/77 71/81 58/71 40/51
Poland
2010 56 30 127 28 78 109 88
2011 25 11 30 67 109 49 22
2013 78 20 107 100 54 52 89
St 39 30 47 60 75 68 41
1measured at the nearest meteorological station; St – standard monthly precipitation; Bold are months with water
compared to that of CZ. In Albania, ANE increased in accordance with the rising K rate, reaching a maximum of 140 kg tubers/kg N at 450 kg K/ha. In Poland, ANE was lower, ranging between –38 to 170 kg tubers/kg N, displaying the maximum average response of 90 kg tubers/kg N at 132 kg K/ha. In CZ, this index was low, ranging from 25 to 50 kg tubers/kg N, with unequivocal response to K rate (Figure 1).
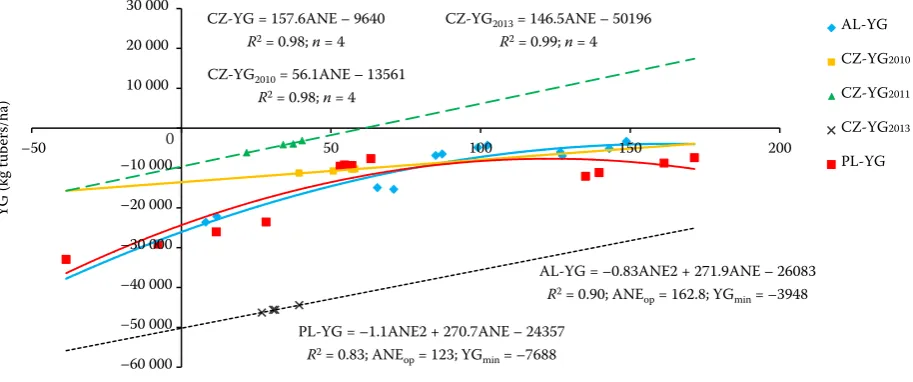
When analysed for the whole set of data, ANE followed a quadratic model (Figure 2). For AL, YG can be minimized to less than –4.0 t/ha, provided that ANE reaches 163 kg tubers/kg N. For Poland, a calculated optimum ANE of 123 kg tubers/kg N would result in a minimum YG of –7.7 t/ha. In the Czech Republic, YG varied from –3.0 t/ha to –46.0 t/ha, depending on the year. Each year, it was linearly responding to ANE.
In the present study, K fertilizer impact on potato tuber yield was evaluated based on the apparent potassium efficiency (AKE) index (Table 3). The most pronounced effect was associated to field location (country). The highest AKE, reaching, on average, 65 kg tubers/kg K, was recorded in PL. It was almost 2-times higher as compared to AL and nearly 4-times as compared to CZ. Surprisingly, this lowest value was in the range reported as op-timal by Li et al. (2015) for China, stressing a low response of potatoes to K fertilization. Differences
in AKE can be explained by diversity in the natural capacity of soils to deliver sufficient K quantity to intensively cultivated crop. As reported for Poland by Fotyma (2007), the content of exchangeable K in soils originating from the postglacial loamy-sand does not exceed a threshold value of 100 mg K/kg soil (Sparks 1987). Soils developed from loamy bedrock, widespread in AL and CZ, are several times richer in both total and available K forms (Madaras et al. 2014). Under such conditions, the productive Kf rates are expected to be exception-ally high, exceeding even 400 kg K/ha (Kovacevic and Grgić 1995). This was probably the case in AL, where N efficiency continued to respond to elevated Kf even to 450 kg K/ha (Figure 1), result-ing in the highest tuber yield. In the case of CZ, a K rate as high as 225 kg K/ha was sufficient to meet potatoes K requirements, but its impact on yield was low.
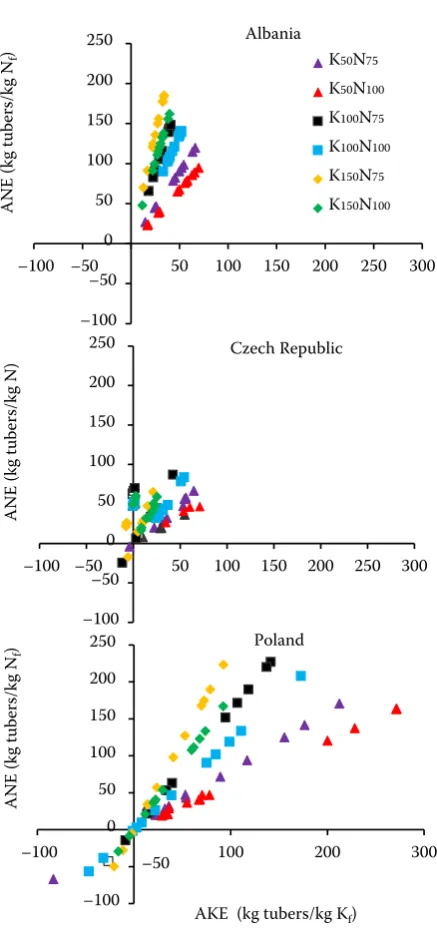
[image:4.595.63.532.126.326.2]The main objective here was to evaluate the impact of the apparent K efficiency on the ap-parent N efficiency (Figure 3). In Albania, a very strong response of ANE (69–189 kg tubers/kg N) was obtained within a relatively narrow range of K net productivity (34–69 kg tubers/kg K). The response range to Kf was much wider in Poland, from negative (–83) up to 271 kg tubers/kg K, also comprising significant increases in ANE, up to 227 kg tubers/kg N. For CZ, the AKE was in the
Table 3. Potato tuber yield and indices of nutrient use efficiency (mean ± standard deviation) as affected by four levels of potassium (K) application rates and two levels of nitrogen (N)
Factor Level of factor (t/ha)Yield PFPN
(kg tubers/kg N)
YMAX YG ANE
(kg tubers/kg Nf) (kg tubers/kg KAKE f) (t/ha)
Location (country)
AL 27.05 ± 7.78a 196.9 ± 59.6a 37.07 ± 5.35a –10.02 ± 8.72b 89.7 ± 51.1c 37.8± 19.4b
CZ 31.48 ± 15.3b 300.5 ± 128.2b 51.66 ± 16.7ab –20.18 ± 19.7c 38.9 ± 22.2a 17.5 ± 24.7a
PL 38.65 ± 10.6c 281.3 ± 85.7ab 54.25 ± 7.79b –15.60± 12.9b 69.1± 77.3b 65.0 ± 87.4c
Year
2010 29.86 ± 11.9a 271.1 ± 86.2b 40.99 ± 11.4a –11.12± 7.83c 96.9± 60.1c 57.3 ± 82.4c
2011 34.71 ± 14.3b 271.6 ± 133.4b 49.35 ± 11.6ab –14.64 ± 13.5b 40.0 ± 59.3a 26.1 ± 35.9a
2013 32.60 ± 10.9b 236.1 ± 86.1a 52.64 ± 14.3b –20.04 ± 19.9a 60.8 ± 39.8b 36.9 ± 37.6b
K rates (% of KR)
0 28.91 ± 14.1a 234.1 ± 119.4a 47.66 ± 13.5 –18.75 ± 15.2c 40.5 ± 55.3a –
50 32.00 ± 12.3b 257.5 ± 106.2b 47.66 ± 13.5 –15.66 ± 14.3b 63.8 ± 45.3b 60.9 ± 78.0c
100 34.17 ± 11.8c 272.7 ± 98.1c 47.66 ± 13.5 –13.49 ± 15.2a 79.0 ± 61.4c 35.4 ± 47.3b
150 34.48 ± 11.3c 274.1 ± 92.6c 47.66 ± 13.5 –13.18 ± 15.2a 80.3 ± 63.0c 23.9 ± 29.3a
N rates
(% of NR) 75 31.70 ± 12.5 291.4 ± 113.7
a 40.84 ± 9.79a –9.15 ± 12.7b 70.1 ± 64.1b 37.3 ± 55.0a
100 33.09 ± 12.6 227.8 ± 85.3b 54.48 ± 13.1b –21.39 ± 14.7a 61.7 ± 52.5a 42.8 ± 61.2b
range of –12 to 71 kg tubers/kg K, but resulting in a very low ANE increase of 87 kg tubers/kg N. In 2010, AKE ranged from –8 to 3 kg tubers/kg K, but resulting in ANE increase from 22 to 60 kg tubers/kg N. There was a clear impact of K rates on AKE, which can be concluded as follows: the lower the K level, the wider the AKE response. This may indicate a declining potassium availability or uptake with the increasing K inputs. Thus, a fundamental contribution of K fertilizer may be the enhancement of N uptake and use efficiency (Fontes et al. 2010, Singh and Lal 2012). Interesting, however, was the consistent difference between
[image:5.595.104.502.96.278.2]the two N levels. As a rule, the lower N level (75% of the recommended rate) resulted in significantly higher ANE but reduced AKE values. In spite of the relatively dull response of the potato yield to fertilizer inputs and the remarkable variability among years in the experiments conducted in CZ (Table 3, Figure 1), the phenomenon described here for AL and PL can be also identified there, provided the year 2010 is considered separately (Figure 3). Thus, the relationships between AKE, ANE and the nutrient application rates clearly demonstrate the tight interaction between the N and K, and its effects on potato production.
Figure 1. Effects of potassium (K) fertilizer rate (*kg K/ha) and nitrogen (N) levels at 75% and 100% (**, ***) of the recommended rate on the mean apparent N use efficiency (ANE). Numbers marked with the same letter are
not significantly different at *P < 0.05; **P < 0.01; ***P < 0.001
Figure 2. Regression models for yield gap based on the corresponding apparent nitrogen (N) use efficiency. YG – yield gap; ANE – apparent nitrogen efficiency
0 40 80 120 160
1** 2*** 1 2 1 2 1 2 1 2 1 2 1 2 1 2 1 2 1 2 1 2 1 2
0* 150 300 450 0 75 150 225 0 66 132 199
Albania Czech Republic Poland
A
N
E
(k
g
tu
be
rs
/k
g
N
)
Potassium rates (kg K/ha)
abc abc defg
abcde
fgh gh gh h
abcde
a abcde
abcabcd abcde
ab
abcdabcde abcde
cdefg bcdef
efg
abcde defg
bcde
AL-YG = –0.83ANE2 + 271.9ANE – 26083 R2 = 0.90; ANEop = 162.8; YGmin = –3948
CZ-YG2010 = 56.1ANE – 13561
R2 = 0.98; n = 4
CZ-YG = 157.6ANE – 9640 R2 = 0.98; n = 4
CZ-YG2013 = 146.5ANE – 50196
R2 = 0.99; n = 4
PL-YG = –1.1ANE2 + 270.7ANE – 24357 R2 = 0.83; ANEop = 123; YGmin = –7688
–60 000 –50 000 –40 000 –30 000 –20 000 –10 000 10 000 20 000 30 000
–50 50 100 150 200
YG
(k
g
tu
be
rs
/h
a)
ANE (kg tubers/kg Nf)
[image:5.595.67.524.523.714.2]The present study validates the principal posi-tive role of K fertilization in potato crop produc-tion. Furthermore, it demonstrates the important interactive effects of N and K application on the apparent use efficiency of both nutrients. In fact, K application has increased N use efficiency and vice versa. Therefore, none of these nutrients should be ignored, particularly K, when nutri-tion policy for potato is considered. This said,
an appropriate nutrition management must be adjusted according to local conditions such as soil properties and weather.
REFERENCES
Brown C.R. (2011): The contribution of traditional potato breeding to scientific potato improvement. Potato Research, 54: 287–300. FAOSTAT (2016): Available at: http://faostat.fao.org/site/567/
default.aspx#ancor (accessed 03.05. 2017)
Fontes P.C.R., Braun H., Busato C., Cecon P.R. (2010): Economic optimum nitrogen fertilization rates and nitrogen fertilization rate effects on tuber characteristics of potato cultivars. Potato Research, 53: 167–179.
Fotyma M. (2007): Content of potassium in different forms in the soils of southeast Poland. Polish Journal of Soil Science, 40: 19–32.
Grzebisz W., Diatta J.B., Härdter R., Cyna K. (2010): Fertilizer consumption patterns in central european countries – Effect on actual yield development trends in 1986–2005 years – A comparative study of the Czech Republic and Poland. Journal of Central European Agriculture, 11: 73–82.
Kovacevic V., Grgić D. (1995): Response of soybeans to potassium fertilization on high potassium fixing soil. Rostlinná Výroba, 41: 246–248.
Li S.T., Duan Y., Guo T.W., Zhang P.L., He P., Johnston A., Shcherbakov A. (2015): Potassium management in potato production in Northwest region of China. Field Crops Re-search, 174: 48–54.
Madaras M., Koubová M., Smatanová M. (2014): Long-term effect of low potassium fertilization on its soil fractions. Plant, Soil and Environment, 60: 358–363.
Rubel F., Kottek M. (2010): Observed and projected climate shifts 1901–2100 depicted by world maps of Köppen-Geiger climate classification. Meteorologische Zeitschrift, 19: 135–141. Singh S.K., Lal S.S. (2012): Effect of potassium nutrition on potato
yield, quality and nutrient use efficiency under varied levels of nitrogen application. Potato Journal, 39: 155–165.
Sparks D.L. (1987): Potassium dynamics in soils. Advances in Agronomy, 6: 1–63.
Supit I., van Diepen C.A., de Wit A.J.W., Kabat P., Baruth B., Lud-wig F. (2010): Recent changes in the climatic yield potential of various crops in Europe. Agricultural Systems, 103: 683–694.
Westermann D.T. (2005): Nutritional requirements of potatoes. American Journal of Potato Research, 82: 301–307.
Received on June 6, 2017 Accepted on August 31, 2017
Published online on September 11, 2017 –100 –50 0 50 100 150 200 250
–100 –50 50 100 150 200 250 300
A N E (k g tu be rs /k g Nf
) K50N75
K50N100
K100N75
K100N100
K150N75
K150N100
Albania –100 –50 0 50 100 150 200 250
–100 –50 50 100 150 200 250 300
A N E (k g tu be rs /k g N
) Czech Republic
–100 –50 0 50 100 150 200 250
–100 100 200 300
A N E (k g tu be rs /k g Nf )
AKE (kg tubers/kg Kf)
[image:6.595.70.289.84.553.2]Poland
Figure 3. Impact of the apparent potassium (K) efficiency (AKE) on the apparent nitrogen (N) efficiency (ANE) at six different combinations of N (75% and 100% of the recommended rate) and K (50, 100, and 150% of the recommended rate) application levels
–100 –50 0 50 100 150 200 250
–100 –50 50 100 150 200 250 300
A N E (k g tu be rs /k g Nf
) K50N75
K50N100
K100N75
K100N100
K150N75
K150N100
Albania –100 –50 0 50 100 150 200 250
–100 –50 50 100 150 200 250 300
A N E (k g tu be rs /k g N
) Czech Republic
–100 –50 0 50 100 150 200 250
–100 100 200 300
A N E (k g tu be rs /k g Nf )
AKE (kg tubers/kg Kf)
Poland –100 –50 0 50 100 150 200 250
–100 –50 50 100 150 200 250 300
A N E (k g tu be rs /k g Nf
) K50N75
K50N100
K100N75
K100N100
K150N75
K150N100
Albania –100 –50 0 50 100 150 200 250
–100 –50 50 100 150 200 250 300
A N E (k g tu be rs /k g N
) Czech Republic
–100 –50 0 50 100 150 200 250
–100 100 200 300
A N E (k g tu be rs /k g Nf )
AKE (kg tubers/kg Kf)