Department of Economics University of Southampton Southampton SO17 1BJ UK
Discussion Papers in
Economics and Econometrics
2000
This paper is available on our website
Linking Individual and Aggregate Price Changes
♣♣♣♣ATTILA RÁTFAI
University of Southampton and
Institute of Economics, Hungarian Academy of Sciences
This Version: July 2000
Abstract. Standard macroeconomic forecasting indicators and techniques tend to perform poorly
in predicting inflation in the short-run. The present paper shows that microeconomic price data
placed in an empirical model rooted in (S,s) pricing theory convey extra information on inflation
dynamics. The empirical model designed to capture the deviation between target and actual
price, potentially applicable in other contexts where lumpy adjustment is prevalent, is applied to
a unique, highly disaggregated panel data set of consumer prices. Fluctuations in the shape of the
cross-sectional density of price deviations are found to contribute to short-run inflation in the
sample. Asymmetry in the density particularly matters. Idiosyncratic pricing shocks appear to
impact on the size rather than the direction of inflation fluctuations.
1 Introduction
Financial analysts and central bankers are all highly keen to learn about the nature of short-term,
month-to-month or quarter-to-quarter, variation in aggregate inflation1. Despite its vital importance for business and policy, understanding the origin and determinants of short-term
aggregate price changes has been a daunting task for macroeconomists. Investigating standard
macroeconomic indicators and forecasting techniques, Cecchetti (1995) concludes that
forecasting relationships for inflation in the US are unstable and time varying. The best, still
highly imperfect predictor of inflation appears to be its own past. Cecchetti and Groshen (2000)
report that the standard deviation of forecast errors in professional forecasters’ one-year-ahead
prediction of US inflation has been about one percentage point over the past decade. This latter
fact is indicative as inflation during this period averaged about 3 percents.
Besides the displeasing performance of traditional approaches, motives are numerous for
exploring new directions in understanding short-term inflation dynamics.The present analysis is
motivated by results from two related strands of research. First, direct evidence on store level
pricing patterns shows that nominal prices are lumpy in the sense that they often exhibit
relatively long periods of inaction followed by discrete, intermittent and heterogeneous
adjustments. This description of microeconomic pricing behavior suggests that the (S,s) pricing
approach is able to serve as a particularly suitable framework for modeling store level pricing
decisions2.
1 This motive is especially strong in industrialized countries that adopted some form of explicit inflation-targeting regime.
Second, the literature on lumpy, (S,s)-type decision rules suggests that an explicit
aggregation of intermittent and heterogeneous individual actions is able to yield new insights for a more adequate understanding of dynamic patterns in aggregate economic activity. Indeed,
several authors have recently emphasized the importance of exploiting micro level data in
explaining the macroeconomy. Caballero, Engel and Haltiwanger (1997) examine employment
dynamics using a large microeconomic data set and find that changes in the cross-sectional
distribution of the deviation of actual from target individual employment demand explain a
sizeable portion of aggregate employment fluctuations in the US. Drawing on the same
firm-level data set and utilizing a similar analytical framework, Caballero, Engel and Haltiwanger
(1995) reach analogous conclusions regarding US capital demand and investment dynamics.
Eberly (1994) shows that simulated aggregate durable expenditures obtained from an explicit
characterization of the cross-section of heterogeneous and lumpy individual automobile purchase
decisions are consistent with the actual dynamics in aggregate durables in the US in the early
1990s. The upshot of this literature is that the degree of coordination of lumpy and
heterogeneous micro level actions matters in aggregate dynamics.
Over the past decades a vast amount of empirical research has been accumulated on the
issue of inflation determination. Most of the studies appear to share two common features: the
abstraction from microeconomic, behavioral considerations and the orientation towards
aggregate data. The present study departs from the traditional literature in both respects and
examines the issue of short-run inflation dynamics from a hitherto unexplored angle. First, the
empirical model set up to estimate the determinants of microeconomic pricing decisions
explicitly builds on implications of two-sided (S,s) pricing rules3. Second, the data analysis is structured around an explicit aggregation of microeconomic price data.
The central object of the empirical model developed in the paper is the price deviation
-the log difference between -the actual and -the target price level4. The main idea, potentially instrumental in related macroeconomic applications, modeling the postulated imbalance between
the actual and the target price is that the presence of menu costs in price adjustment implies
two-sided (S,s)-type decision rules for price setters5. In this framework, stores alter their nominal price and pay the menu cost only when the difference between the target and the actual price
level is sufficiently large and exceeds some threshold value. Otherwise, when shocks are not
sufficiently large to move the price deviation outside the optimally determined (S,s) band, the
current nominal price coincides with the preceding one and no actual pricing action takes place.
This description of pricing behavior naturally lends itself to a Probit interpretation of
microeconomic price data with the target price level being a latent variable6.
The empirical model is applied to a unique, highly disaggregated panel sample of
consumer prices. The data analysis is aimed at recovering and quantifying information that may
be lost in merely taking averages of individual prices in constructing aggregate inflation indices.
First, price deviations are estimated and the corresponding price adjustment functions and
cross-sectional densities of price deviations are constructed. Price deviations, adjustment functions,
and cross-sectional densities are then placed into an aggregating framework to obtain aggregate
inflation. Given these constructs, three issues are investigated. First, to evaluate the relevance of
the proposed empirical framework, the intertemporal stability of price adjustment functions and
cross-sectional densities is analyzed. Then, the role of fluctuations in the price deviation
4 What is called price deviation here is often termed as relative or real price in the related literature. The current terminology appears to capture better the behavioral concept at hand (see also Caballero and Engel (1992)).
5 The expressions of “menu cost” and fixed cost of adjustment are used interchangeably. Levy et al. (1996) provide direct empirical evidence on the nature and magnitude of menu costs.
densities in shaping aggregate price dynamics is evaluated. Finally, the relative influence of
idiosyncratic pricing shocks in aggregate price changes is briefly examined.
The rest of the paper is organized into eight sections. The new microeconomic data set
used in the study is introduced in Section 2. Elements of the proposed empirical framework are
developed in Section 3. The estimation procedure is described in Section 4. Sections 5 reports on
the various pieces of empirical results, while Section 6 concludes and suggests directions for
future research.
2 Data
Inferring the history of shocks and their propagation to individual price sequences requires a
relatively long panel of microeconomic price data, ideally of many homogenous products sold in several stores. Samples that are representative of finished goods markets at large, or even for a
specific sector of the economy, are simply inaccessible, thus shortage in appropriate data may
explain the paucity of related research. To sidestep the data availability issue, this study
examines a specific panel of microeconomic prices. The particular episode is the case of
processed meat product prices in Hungary during the mid-1990s.
The data set investigated is a balanced panel of the transaction price of fourteen different
processed meat products7 sold in eight distinct and geographically dispersed stores in Budapest, Hungary from January 1993 to December 1996. Observations are at the monthly frequency. Due
to a five-month intermission in data collection from April 1995 to September 1995, the sample is
split into two sub-periods covering 27 and 16 months. Out of the eight stores in the sample, five
are larger department stores and three are smaller grocery stores, called Közért. All stores sell
many other kinds of products besides the ones considered here. Whenever a particular store is
visited, all the fourteen product prices are recorded. Throughout the sample period, there was no
government control of the prices involved8.
The data set is specified and does not represent the whole spectrum of economy-wide
price movements. It still provides an excellent laboratory for the purposes of the present analysis.
First, items in the sample are well-defined, homogeneous food products with insignificant
variation in non-price characteristics such as quality. Second, products are manufactured by a
technology that features a single basic input component, the underlying raw material. It implies
that the fundamental source of aggregate pricing shocks is variation in raw material prices. Third,
as products are taken from the same sector, inference about stores’ pricing policies is less likely
to be contaminated by major differences across production technologies. And finally, although
being more volatile, the sample price index tracks movements in the overall CPI, especially its
food component quite closely. For instance, the partial correlation coefficient between the
average price level in the sample and the food component of the CPI in Hungary is 0.949.
Descriptive Evidence
In a detailed descriptive, non-parametric study, Rátfai (1998) documents that prices in the
sample exhibit both lumpiness and heterogeneity. To motivate the empirical approach adopted in
this paper, it is instructive to briefly highlight some of the basic findings. First, nominal prices
remain constant in 58 percent of the cases and the average duration of price quotations is about
8 Appendix A provides further details of the data.
three months with the longest spell being 17 months. With the exception of months in the third
quarter when a raw material price shock hits in, spells of adjustment are spaced irregularly across
stores. The duration of price changes is dispersed over time within stores but contemporaneously
tends to be synchronized.
The size of price changes is relatively homogenous across stores and products. The
average size of non-zero price changes is about 9 percent in the whole sample, with the largest
size being about 63 percent. Positive changes tend to be larger than negative ones. The average
size of positive changes is 10.85 percent in period 1 and 11.73 percent in period 2. Average
negative changes are smaller: -8.24 percent in period 1 and -7.32 percent in period 2.
The above observations suggest that price fixity is adequately captured at the monthly
frequency. In particular, first, quarterly or lower frequency microeconomic price observations are
likely to be heavily left-censored as the average duration of price quotations is about three
months. Second, visualizing price sequences in the data indicates that higher, say weekly,
frequency price data have little to offer in providing new information on microeconomic pricing
patterns. Also, the time series for the underlying raw material prices are available only at the
monthly frequency.
3 The Empirical Model of Inflation Dynamics
The empirical model of inflation dynamics is developed in two stages. First, the target price level
is specified and the resulting price deviation is estimated. Second, an aggregation framework is
3.1 Specification and Estimation of Price Deviations
The (S,s) model assumes that there exists a target price that would be implemented in the
absence of fixed adjustment costs. To capture the deviation between the actual and the target
price, the literature on relative prices tends to associate the target price with the across-store
average of actual prices (see, for instance, Lach and Tsiddon (1992)). There are two interrelated
concerns with this naïve practice. First, there is no apparent behavioral reason to identify the
target price level with the product level average price. And second, there exist several factors
including location or technological ones that make the target price level heterogeneous across
price setters and products as well. In the investment literature, Caballero, Engel and Haltiwanger
(1995) derive mandated investment, the log deviation between the actual and the target capital
level, as a function of two firm-specific variables that are individually both highly persistent and
argue that the (S,s) decision rule makes mandated investment mean-reverting. This is the insight
that allows them to identify parameters of mandated investment in a cointegrating framework.
The empirical framework developed below radically departs from both of the above two
strands of literature. The various pieces of the model revolve around the idea that fixed costs of
changing prices create an imbalance between actual and target pricing behavior and make actual
price adjustment state-dependent. Stores follow two-sided (S,s) pricing policies and leave their
nominal price unaltered until the state variable, the price deviation in store i of product j at time t,
zijt≡pij,t-1 - pijt*, passes one of the two adjustment boundaries, S or s. If shocks to the target price are sufficiently large then zijt is pushed outside one of the bands that in turn induces stores to pay the menu cost and adjust their nominal price either upwards when zijt≤s or downwards when zijt
<
−
−
−
>
<
−
−
<
−
=
>
−
−
−
<
s
*
ijt
p
1
t,
ij
p
if
1
t,
ij
p
S
*
ijt
p
1
t,
ij
p
s
if
1
t,
ij
p
S
*
ijt
p
1
t,
ij
p
if
1
t,
ij
p
p
ijt .This description of pricing behavior suggests that the target price level can be viewed as a latent
variable. Clearly, the two-sided (S,s) pricing rule translates into a trinomial Probit estimation
problem.
It is important to give emphasis to the timing convention adopted in the definition of
price deviations. As shocks to the target price are assumed to occur at the beginning of the
current period, the price deviation is bound not to reflect stores’ reaction to pricing shocks of any kind. That is, prices inherited from the preceding period are in effect before stores are able to
respond to current shocks.
The starting point to actually estimate price deviations under the organizing framework of
(S,s) pricing rules is specifying the individual target price level for processed meat products. To
do so, first, recurrent aggregate and idiosyncratic shocks are assumed to drive the stochastic
process for the target price level. An important advantage of the data set used in this paper is that
the aggregate forcing variable is easily characterized and the specific product prices are readily
matched with it. Indeed, aggregate shocks are identified by the change in the relevant raw
material price, the price of cattle or pig for slaughter 11. Idiosyncratic shocks are independent from aggregate shocks and specific to the particular product in the particular store at the
particular time.
Second, individual price sequences are assumed to contain both product and store specific components. The fact that certain stores may happen to be systematically more (or less)
expensive than others could be due to differences in the local tax-burden or in the affluence of
customers at a particular location. Similarly, differences in consumer taste or production
technology could perhaps cause certain products to be priced systematically higher than other
ones. To capture these effects, nominal price sequences are assumed to contain a deterministic,
store- and product-specific nuisance term. Therefore, the log target price level is a linear
combination of the nuisance term, cijt, and the relevant raw material price, Mjt. The economic interpretation attached to this specification is a fixed markup over cost story12.
Third, the nuisance term, cijt, is defined as the sum of a time-invariant intercept term, aij, and a residual term, ωijt, with homoskedastic variance, Ω. The residual is then interpreted as an idiosyncratic pricing shock. To ease estimation by reducing the number of parameters, the
store-and product-specific intercept parameter, aij, is split into two parts. In particular, aij = ai + aj where ai is a store-specific and aj is a product-specific component. Taken together, the above considerations yield the following fixed effect model for the target price level:
ijt jt j
i ijt jt ij
*
ijt a bM a a bM
p = + +ω = + + +ω .
3.2 True versus Spurious State Dependence
As past realizations of nominal prices have a genuine behavioral effect on the probability of
initiating a pricing action in the present, the discrete choice decision rule associated with the
empirical Probit framework exhibits both what Heckman (1981) calls “true” and “spurious”
state-dependence. It is important to stress that the estimation procedure adopted here
accommodates both sources of temporal dependence.
In general, decision rules of the (S,s) type naturally give rise to “true” state-dependence
in the decision variable of interest. In the present application, the current realization of the state
variable, the price deviation is directly related to past pricing actions by zijt≡pij,t-1 - pijt*.
Nonetheless, as the lagged control variable does not directly enter the true behavioral model but
it affects decisions through the censoring thresholds, the discrete choice model reflects
state-dependence in a non-standard form.
The possibility of “spurious” state dependence appears in the model in the form of
serially correlated residuals. In general, this form of intertemporal linkage stems from the fact
that past realizations of heterogeneous unobservables can persistently affect current decision
variables. In the present application, local technological or demand shocks may result in
increased persistence in the residual term of the target price model. To comply with this presence
of temporal dependence in idiosyncratic unobservables, the residual in the fixed effect regression
model, ωijt, is specified as an AR(1) process in the form of
ijt t ij
ijt ρω ε
ω = ,−1+
where εijt is i.i.d. Normal with mean zero and variance σε2. The auto-regressive parameter, ρ, is
constant across stores and products.
Taken together, these considerations yield an empirical model of price deviations
3.3 Aggregation Framework
To complete the description of the empirical model, a general accounting framework of price
deviations is introduced to arrive at a definition of aggregate inflation. In the proposed
framework both aggregate and idiosyncratic pricing shocks are filtered through the single state
variable, zt, in a non-linear manner. First, analogously to Caballero, Engel and Haltiwanger (1995), (1997) and momentarily omitting store- and product specific indices, aggregate inflation
is defined as
∫
=
Πt ztAt(zt)f(zt,t)dzt .
The aggregation formula features two fundamental building blocks: the cross-sectional density of
price deviations, f(zt,t), and the so-called price adjustment function, At(zt). The price adjustment function is defined as the mean actual price change measured at particular realizations of price
deviations normalized by the corresponding price deviation13.
The propagation pricing shocks in the model is reflected in the time and state dependent
adjustment function and cross-sectional density of price deviations. The principal advantage of
aggregating individual price changes in this particular framework is that it permits a rich
evaluation of the mechanism driving aggregate price changes, including the study of the role of
fluctuation in At(zt) and f(zt,t). Potentially, the framework also permits to separate the importance of idiosyncratic versus aggregate shocks in driving inflation.
Clearly, the above definition of aggregate inflation is not a conventional one. It is
constructed as a weighted-average of the individual mean price changes with weights given by
the cross-sectional density of the appropriate price deviation. Nonetheless, the index is virtually
13 As opposed to A
identical to a simple unweighted index of aggregate price changes in the present sample. The
correlation coefficient between the two indices is 0.99.
4 Estimation
To motivate the estimation strategy for the empirical model, consider the situation in which the
residual in the target price model, ωijt, is assumed to be Normal with variance Ω and identically and independently distributed. In the absence of temporal dependence in the error term, the
log-likelihood function for the model can be simply written as the product of the appropriate
marginal probabilities:
[
]
= − − − = ≡∑
∑ ∫
= = = = = 14 ,..., 1,...,81 ( )
* *
14 ,.., 1,...,8 1 1 * ) ( ) ,..., ( ln j
i p p
ijt jt j i ijt j i ijT ij ijt ijt dp bM a a p f p p prob L τ
∑ ∫ ∏
∏
∏
= = ∞ ∞ − − = − < − > − − − − − − − − − − × − − − − × − − − − − − − − 14 ,..., 1,...,8 1 * 1 , 1 , 1 , 1 , )) ( ( ) ( ( ) ( )) ( 1 ( ln 1 , 1 , 1 , j i ijt jt j i t ij p p jt j i t ij pp ijt i j jt
p
p ijt i j jt
dp bM a a S p F bM a a s p F bM a a S p F bM a a s p F t ij ijt t ij ijt t ij ijt
where F(.) denotes the multivariate cumulative density function. In this setup, standard quadrature based Maximum Likelihood procedures serve as a relatively straightforward
estimation method. Even if temporal dependence in the error term is neglected when it is actually
present, parameter estimates are consistent. However, standard error estimates are biased and
parameter estimates are inefficient. More importantly, if the serial correlation structure is
erroneously specified to be i.i.d. and lagged dependent variables enter the model, as they do here, then standard ML estimation may lead to inconsistent parameter estimates (see Keane (1993)).
used for prediction purposes in forming the cross-sectional density of zijt and then aggregate inflation.
Unfortunately, the residual in the target price model is likely to exhibit a non-trivial serial
correlation structure here. Moreover, the pricing model features lagged dependent variables that
appear in the censoring thresholds. These two considerations raise significant econometric
problems in the ML estimation of the Probit panel model. First, once the serial correlation in the
error term is properly taken into account, the log-likelihood function cannot be factored in the
standard fashion. It implies that estimating the joint likelihood of consecutive price observations
requires the evaluation of T (the number of time periods) dimensional integrals. Without further simplifying restrictions imposed on the correlation structure of residuals, the computation of
these high dimensional integrals by standard numerical procedures is numerically infeasible. An
obvious resolution to this problem could be to directly simulate the choice sequence probabilities
by the observed frequencies. However, obtaining reasonably precise and consistent estimates of
the possibly quite small probabilities entails a computationally burdensome number of draws and
thus excessive efforts.
In the absence of a large number of draws, the frequency simulator of the joint choice
probabilities is discontinuous in the estimated parameters. In general, besides computational
feasibility, smoothness (differentiability and continuousness) is an important feature of the
estimator as it implies that standard hill-climbing or gradient methods can be directly applied to
maximize the resulting simulated log-likelihood function. Fortunately, simulation estimation
techniques such as the Simulated Maximum Likelihood (SML) estimator employing the
Geweke-Hajivassiliou-Keane (GHK) simulator of importance sampling of univariate truncated
normal variates offer a feasible remedy. Most importantly, the SML estimator is not only
relatively quick and continuous in the parameters but it is also able to accommodate various
correlation structures and provide consistent and efficient parameter estimates even in the
presence of lagged endogenous variables. Extensive comparisons investigating the accuracy and
found that the SML estimator performs the best of the available ones (see Börsch-Supan and
Hajivassiliou (1993)). Therefore, in estimating the panel Probit model with serial correlation in
the error term the smooth Simulated Maximum Likelihood estimator employing the GHK
simulator of univariate truncated standard normals is used.
A brief outline of the SML procedure is the following. The log-likelihood function to be
maximized is
[
]
∑ ∫
∑
= = = = = − − − = ≡ 14 ,..., 1,...,81 ( )
* *
14 ,.., 1,...,8 1 1 * ) ( ) ,..., ( ln j
i p p
ijt jt j i ijt j i ijT ij ijt ijt dp bM a a p f p p prob L τ .
As described above, the presence of serial correlation in the residual implies that estimating the
parameters of this problem requires the evaluation of T dimensional integrals for each cross-sectional unit where T is either 27 or 16 here.
To understand the simulation estimation procedure, consider the sequence of prices of a
single product in a single store. First, dropping subscripts for the moment, the normally
distributed structural error term, ω, is defined recursively as ω= Ce where C is the lower triangular Cholesky decomposition of Ω satisfying C’C =Ω, and e is a univariate i.i.d. standard normal residual. Then, instead of drawing directly from the original distribution of serially
dependent truncated normals, e sequentially and independently is sampled R times from the recursively restricted univariate standard normal distribution14. For instance, if the nominal price remains constant during the first three periods then the consecutive draws of e1 ,e2, and e3 are obtained from:
1 11 * 1 11 * 1 1 11 * 1 1 β ω
α = ≤ = ≤ =
c B c e c A 2 22 1 21 * 2 22 1 21 * 2 2 22 1 21 * 2 2 β ω
α = − ≤ = − ≤ − =
c e c B c e c e c e c A 3 33 2 32 1 31 * 3 33 2 32 1 31 * 3 3 33 2 32 1 31 * 3 3 β ω
α = − − ≤ ≡ − − ≤ − − =
c e c e c B c e c e c e c e c e c A …
where At* = pij,t-1 - S – (ai + aj + bMjt) and Bt* = pij,t-1 - s – (ai + aj + bMjt). To scale the size of the dependent variable for identification purposes, the adjustment boundaries are fixed to the
average size of actual price changes. This restriction can be thought of as resulting from a
discrete time approximation to the width of the band obtained in a continuous time (S,s) model15. In general, the SML procedure requires R distinct simulations to estimate the joint
occurrence of a particular sequence of nominal price realizations. The estimated joint probability
is then given by the average of the R distinct probability simulations factored as the products of the simulated univariate probabilities:
∑
∏
∏
∏
= > < =
− × × − = Ω − − − R
r p p
r t r t p p r t p p r t j i jt ijT ij t ij ijt t ij ijt t ij ijt e F e F e F e F R S s a a b M p p prob 1 1 1 , 1 , 1 , } ) ( ) ( { )} ( { } ) ( 1 { 1 ) , , , , , , , ,..., ( α β α β ρ .
This stage of the estimation computationally is quite time consuming. Still, relatively
accurate likelihood estimates are obtained by employing only a small number of repetitive draws.
Börsch-Supan and Hajivassiliou (1993) report that only twenty or thirty draws are likely to be
sufficient in the case of three to seven alternative choices. To use err at the conservative end,
fifty sampling draws is employed in the simulations.
Although estimates of the implied truncated structural errors are biased in general, the
likelihood contribution is correctly simulated by the joint probability of the corresponding
truncated standard normal variates. As shown by Börsch-Supan and Hajivassiliou (1993), the
simulated log-likelihood is an unbiased and smooth estimate of the true likelihood function.
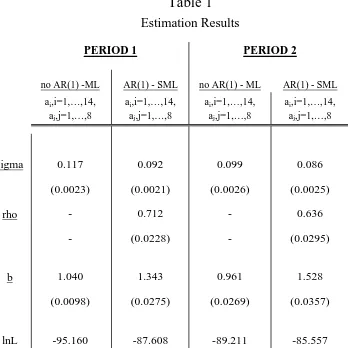
The estimated parameters of interest are presented in Table 1 separately for Period 1 and
Period 2. There are a few points that clearly stand out here. First, standard errors reported in the table indicate that the parameters are fairly tightly estimated. Second, the autocorrelation
parameters are sizeable and significantly different from zero16. The substantial persistence found in the residual clearly justifies accounting explicitly for the temporal dependence in residual
term. And third, the slope estimates are larger than one indicating the possibility of some form of
increasing returns to scale in the production technology.
5 Empirical Results
5.1.1 The Cross-Sectional Density of Price Deviations
In (S,s) pricing models, histories of shocks and the potentially heterogeneous response of stores
to these shocks are summarized in the cross-sectional distribution of price deviations. It implies
that the shape of this distribution is likely to serve as an important determinant of aggregate price
dynamics. Indeed, a novel element of the two-sided (S,s) approach is the way individual pricing
decisions are aggregated. Tsiddon (1993) develops a continuous time model in which trend
inflation (used to proxy the trend change in the target price level) is non-negative. Due to the
presence of occasional deflationary shocks, the optimal price setting rule is a two-sided (S,s)
policy, featuring both downward and upward actual price adjustments. The paper demonstrates
that the presence of non-zero trend inflation implies that the stationary distribution of price
deviations has an asymmetric, non-uniform, piece-wise exponential shape. Intuitively, this
feature of his model follows from the fact that the pressure exerted by positive trend inflation
forces price deviations to spend disproportionately more time closer to the lower adjustment
band than to the upper one. In another two-sided (S,s) model with no trend inflation, Caplin and
Leahy (1991) assumes a uniform time-invariant distribution of price deviations in aggregating
(S,s) pricing policies.
To provide microeconomic evidence on the shape of the cross-sectional distribution of
price deviations, first, recall that price deviations are defined as the log difference between the
actual lagged price level and the predicted target price levels. Aggregate shocks to the target
price are observable and represented by the change in raw material prices. However, the exact
realization of idiosyncratic shocks cannot be recovered, only their conditional density is
identified in the form of a truncated normal distribution. Consequently, target price levels are
directly unobservable as well.
Despite that target price levels and price deviations are not observed, the cross-sectional
density of price deviations can be calculated in a straightforward manner by averaging the
conditional densities. First, a discretized state space is defined with a bin width of one percent for
price deviations between –25 and 25 percents and of five percents for the rest of the state space.
The densities are evaluated at the middle-point of the bin intervals, k = -35, -30, -25, -24, -23, …,
23, 24, 25, 30, 35. Formally, the empirical densities at zijt = k can be computed as
) ) (
( )
(z k f p, 1 a a bM k
The definition of price deviations implies the truncation points for ωijt of Aijt* = pij,t-1 - S – (ai + aj
+ bMjt) and Bijt* = pij,t-1 - s – (ai + aj + bMjt). Then, for each bin interval and price observation, the conditional truncated normal densities are computed17. Adding up the individual densities at each bin interval and normalizing the resulting empirical distribution so that it sums to unity
produces the empirical distribution of price deviations in each time period.
Summary statistics show that the average of the mean price deviation calculated
separately for each product-store specific sequence of price deviation is –3.05 percent in the
whole sample with an average standard deviation of 8.74. On the one hand, the first figure
indicates that there is a substantial upward trend built in the target price levels and a
corresponding downward trend in target price changes. This observation is in accordance with
the predominance of inflationary periods in the sample. On the other hand, the standard deviation
figure confirms that there is considerable cross-sectional heterogeneity both across stores and
products in the sample.
Price deviations are constructed by imposing a decision rule of the (S,s) type on actual
price data. Is the resulting shape of the empirical density consistent with implications of
two-sided (S,s) theory? First, the upper panel in Figure 2 shows the histogram of all price deviations
pooled together18. The empirical density clearly does not take on a symmetric, rectangular shape implied by much of the literature on one-sided (S,s) pricing policies. Indeed, it appears to be
asymmetric. This feature of the distribution is actually consistent with two-sided (S,s) models
that motivate the empirical structure imposed on the data.
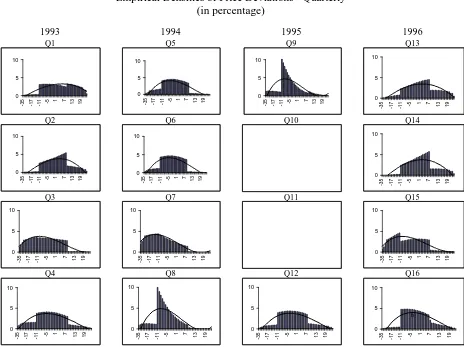
How the shape of the empirical densities of price deviations evolves over time? To ease
interpretation, only densities at the quarterly frequency are examined19. The graphs in Figure 3
17 The masses at the two tails represent the respective cumulative densities.
displaying densities show that price deviations are asymmetric and non-uniform. Changes in the
shape of the histograms are suggestive of the evolution of aggregate inflation. For instance, third
quarter histograms tend to feature strongly leftward warped distributions with many price
deviations bunching towards the lower end of the distribution. Conversely, the rightward warped
second quarter histograms tend to indicate a pressure on nominal price decreases.
A few further episodes of interest can also be identified in the histograms in Figure 3. For
instance, Figure 1a suggests that the accelerating burst in annual food price inflation in early
1994 was eventually terminated by the middle of 199520. By many price deviations bunching in the neighborhood of the lower adjustment boundary, histograms of price deviations in the present
sample quite clearly pick up this story, especially between late 1994 and early 1995.
Alternatively, at the beginning of 1993 and 1996 the large number of price deviations bunched
on the right end of the empirical densities witness deflationary pressures on meat product prices.
As evidenced by the sample inflation series displayed in Figure 6, the deflationary pressure
eventually resulted in disinflation in early 1993 or even deflation in the first two quarters of
1996. An interesting episode is 1994 when the graph actually signals pressure on subsequent
price increases.
5.1.2 The Price Adjustment Function
Dropping individual specific subscripts momentarily, for all k = -35, -30, -25, -24, -23, …, 23,
24, 25, 30, 35, the adjustment function is defined as
t t t t
t
z
j i k z DP k
z
A( = )= ( = ,∀ , ).
In the present framework, DPt(zijt = k, ∀ i, j) is computed as a weighted average of all nominal price changes (including zeros) in month t when the price deviation is equal to k. The weights are supplied by the corresponding empirical densities. Formally,
∑∑
= = −
= −
= ∀
= 14
1 8
1
1
, ) ( )
( )
, , (
j i ijt ijt ijt t
t z k i j p p f z k
DP .
Note that this definition implies that At(zt)zt measures the expected value of the size of price changes taking place at price deviation zt.
As its curvature determines the extent to which fluctuations in non-uniform price
deviation densities are able to impact on aggregate inflation, the shape of the adjustment function
may have important aggregate consequences. The Probit model imposed on the data implies
specific predictions on the shape of the adjustment function. In particular, if prices were perfectly
flexible then the middle portion of the adjustment function would contain no realization of price
deviation. However, if prices were sticky in one way or another then the adjustment function
would be hat- (or reverse-U) shaped. Intuitively, in this case stores are willing to tolerate small
deviations between the actual and the target price level but a large deviation induces them to alter
their nominal price. It implies that the adjustment function would take on large absolute values
for more extreme price deviations, outside the (S,s) band, and zero values for a range of
intermediate price deviations, side the (S,s) band. In reality, stores may not be fully intolerant
towards small deviations. They are more likely to have average adjustment functions that evolve
less smoothly in the neighborhood of the boundaries and look less concave and symmetric.
a smooth path and be virtually invariant to zt. In fact, if the adjustment function were fully flat then in the proposed aggregating framework higher moments of the cross-sectional density of
price deviations would be irrelevant to aggregate inflation.
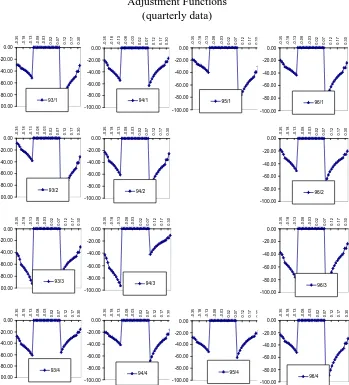
Figure 4 portrays the average adjustment functions in the sample. They are constructed
by pooling monthly observations of At(z) from the whole sample or from the same quarters in different years. The upper four panels show average adjustment functions at the quarterly
frequency, while the bottom panel shows all observations pooled together. In general, the shape
of the adjustment functions appear to be consistent with the implication of two-sided (S,s)
models. Visual inspection of the graphs suggests that the adjustment functions do take on a
hat-shaped form and reflect the inaction region implied by the Probit structure imposed on the data.
Most importantly, the average adjustment functions are relatively stable across quarters. The
discontinuity at the adjustment boundaries is due to the assumption that the boundaries are fixed.
Figure 5 displays the same information separately for all the fourteen quarters in the
sample. Despite the noise in constructing these graphs, the emerging picture clearly indicates that
adjustment functions are remarkably stable over time and broadly consistent with (S,s) theory
motivating their construction. The intertemporal stability of the adjustment function indicates
that the empirical specification imposed on the data reasonably well captures the underlying
microeconomic structure that governs stores’ pricing behavior.
5.2 Aggregate Implications
As two-sided (S,s) pricing models predict that they exert pressure on aggregate price changes,
fluctuations in the shape of the cross-sectional density of price deviations are of considerable
interest for the study of inflation dynamics. Using sectoral level inflation data, Ball and Mankiw
of price deviations do impact on changes in aggregate inflation. They find strong evidence that
inflation is related to the asymmetry in the distribution and somewhat weaker evidence that it is
related to dispersion in the distribution.
My focus is also on the same features of price deviation densities: dispersion and
asymmetry. Dispersion is measured as the standard deviation of the cross-sectional distribution
of price deviations. As a priori it is not straightforward which statistic captures better the fundamental concept of interest here, the relative bunching of price deviations to one of the two
adjustment boundaries, two alternative measures of asymmetry are considered, the inter-deciles
difference, and the standard skewness coefficient21.
First, the three panels in Figure 6 show the time path of the above three summary
measures along with the corresponding aggregate inflation series. To assess if the price deviation
series exhibit any sort of cyclical relationship with respect to inflation, first, Table 2 summarizes
the unconditional correlation coefficients among the series depicted in Figure 6. The table shows
that there is positive correlation between the second but negative correlation between the third
central moment of price deviations and aggregate inflation. At the same time, the correlation
coefficient between the inter-deciles difference and aggregate inflation is positive and sizeable.
Apparently, the two alternative asymmetry statistics, the inter-deciles difference and the
skewness coefficient, have quite different cyclical properties relative to aggregate inflation. To
sort them out, by case of example, consider the empirical density of price deviations in the third
quarter of 1993 shown in Figure 3. Clearly, the large number of price deviations bunching at the
lower end of the distribution translates into substantial aggregate price increases during that
quarter. As the top panel of Figure 6 indicates, the bunching is evidenced in the jump of the
21 The inter-deciles difference statistic is the upper 10 percentile of the distribution minus the lower 10 percentile of the distribution. Results with alternative percentile measures of
inter-deciles statistic. At the same time, the skewness coefficient turns into negative in the
quarter that does not reflect the observed bunching of price deviations around the lower
boundary. This episode and other ones as well suggest that changes in the skewness coefficient
may reflect other behavioral considerations than the pressure on price setters to change their
nominal price. Nonetheless, as much of the related literature employs the standard skewness
coefficient to capture asymmetry in the empirical density, results using both potential measures
are report.
Next, to assess the robustness of the partial correlation results, a set of horse-race
regressions is run with aggregate inflation as the dependent and the various measures of price
deviation densities as the explanatory variables. Following Ball and Mankiw (1995), the general
form of the regression equation is
t t t
t
t =b +bΠ +b StDev +b Asym +u
Π 0 1 −1 2 3
where StDev denotes the standard deviation and Asym denotes the asymmetry measure of price deviation densities. Six distinct regressions are considered, all of which include a constant, b0, and lagged inflation, Πt-1 as well. The six cases differ in what measures of the price deviation density are included as explanatory variables in the equation.
The parameter estimates along with their standard error and the goodness-of-fit measure
of the regression are displayed in Table 3. Results for the benchmark regression are reported in
the first column of the table. First, a simple comparison of the adjusted R2 statistics reported in the first and the second column of the table shows that adding the standard deviation to the
benchmark regression slightly improves the fit of the model. The equation augmented solely by
the skewness coefficient leads to a worse goodness-of-fit than the one including only the
standard deviation. However, in both cases the parameter estimates are statistically insignificant
at conventional levels. Column four shows that adding only the inter-deciles statistic as an
regressions. Moreover, the relevant parameter estimate is of the expected sign and statistically
significant. Results in column five indicate that including both the standard deviation and the
skewness coefficient in the regression equation leaves the parameter estimate statistically
insignificant and the fit about the same. Indeed, the model with only the inter-deciles difference
measure provides a better fit than the model with both the standard deviation and the skewness
coefficient included in it. Finally, a dramatic improvement in the goodness-of-fit is revealed
when the standard deviation variable is supplemented with the inter-deciles difference one. In
addition, all parameter estimates are highly significant. These findings suggest that the
asymmetry in the cross-sectional distribution is a more important determinant of aggregate
inflation than the corresponding dispersion. In this sense, they match the empirical results of Ball
and Mankiw (1995).
Next, the importance of fluctuations in At(zt) and f(z,t) in shaping aggregate dynamics is examined. The strategy followed here is to construct counterfactual aggregate inflation series by
replacing actual cross-sectional distributions and adjustment functions with their seasonal
(quarterly) or overall average and then compare the proximity of these series with the true one22. For example, replacing the actual At(zt) in my aggregating framework with the corresponding seasonal average Ats(zt) amounts to shutting down cyclical but retaining seasonal fluctuations in the adjustment function. Following CEH (1995, 1997), the following goodness-of-fit measure is
used to evaluate the proximity of actual and counterfactual price dynamics
) (
) (
1
(.) 2
2
t t cf t G
Π Π − Π − =
σ σ
where Πtcf (cf = s (seasonal), oa (overall average)) is the counterfactual and Πt is the actual aggregate price change and σ2 denotes the variance of the series. To the extent that it is not
constrained by zero from below23, the proposed statistic, G(.), is different from the traditional goodness-of-fit measure, R2.
Table 4 displays the results obtained for goodness-of-fit in the various counterfactual
cases. First, note that shutting down only cyclical and keeping seasonal movements in f(z,t)
distracts aggregate inflation from its true dynamics by a much larger extent than playing down
similar cyclical fluctuations in At(zt). In the former case, G(.) falls by 18 percent, while in the latter case it gets reduced only by 2 percent. This observation again reflects the intertemporal
stability of the adjustment function. Entries in the upper right and lower left corner of the table
show statistics obtained by removing all (seasonal and non-seasonal) fluctuations either in the
cross-sectional density or in the adjustment function. The figures indicate a dramatic
deterioration in fit when all fluctuations in the cross-sectional distribution of price deviations are
eliminated. In the other parallel case, with no time-series variation in the adjustment function, the
proximity of the two series is only slightly reduced. Indeed, removing all fluctuations in the
adjustment function results in a slightly better fit than taking away only cyclical and leaving
seasonal fluctuations in the cross-sectional distributions.
Overall, the goodness-of-fit statistics indicate that swings in both the cross-sectional
density and the adjustment function are non-trivial ingredients of aggregate price dynamics and
ignoring them results in loss of information in understanding inflation dynamics. Seasonal and
cyclical fluctuations in the adjustment function contribute relatively little to aggregate price
dynamics, while fluctuations in the cross-sectional distribution are of fundamental importance
both at the seasonal and the cyclical frequency.
5.3 Idiosyncratic versus Aggregate Shocks
Idiosyncratic shocks average to zero by definition. In addition, in a frictionless neoclassical
world their aggregate impact cancels out by relative price adjustment. However, though they are
still zero on average, idiosyncratic shocks are not neutral any more if there are fixed costs to
price adjustment. Two-sided (S,s) behavior implies that many small idiosyncratic shocks in one
direction may have no aggregate effect at all, while only a few large ones in one direction
actually does have.
How important are idiosyncratic shocks in shaping aggregate inflation dynamics after
having been filtered through the cross-sectional distribution of price deviations? What fraction of
fluctuations in aggregate inflation can be attributed to idiosyncratic shocks, after having them
filtered through the cross-sectional density of price deviations? The strategy in answering these
questions is to split aggregate fluctuations into two parts, one is due to idiosyncratic and the
other to aggregate shocks. Idiosyncratic shocks are identified with the residual in the panel Probit
regression, while aggregate shocks with the change in raw material prices. Inflation is defined
the same way as before:
∫
=
Πt ztAt(zt)f(zt,t)dzt .
First, idiosyncratic pricing shocks are suppressed in computing price deviations24. Using the counterfactual price deviations with no idiosyncratic shocks, the cross-sectional density, f(oa), is constructed. The adjustment functions assumed to be the same as in the baseline case, A(a). By sticking the above two building blocks into the aggregating framework, the counterfactual
inflation series, Πt’ are readily computed.
Figure 7 displays the counterfactual series, Πt’, together with the actual one, Πt. Visual inspection of the graph suggests that the underlying dynamics in inflation remains relatively
intact. The visual impression is confirmed by simple partial correlation coefficients reported in
Table 5. The figures show that the actual and the counterfactual series closely move together, the
partial correlation coefficient is 0.83. By displaying the difference between the true and the
counterfactual inflation series, Figure 8 shows the relative contribution of idiosyncratic shocks.
Their effect appears to be sizeable. For instance, had idiosyncratic shocks not mitigated
aggregate surprises between September 1994 and March 1995, inflation would have been higher
by about 4 to 5 percent. At the same time, idiosyncratic shocks seem to have prevented an even
more drastic deflation in meat product prices during the first eight months of 1996. Analogously
to the exercise performed in Section 5.2, the goodness-of-fit statistic, G(.), is constructed here to measure the proximity of the true and the counterfactual series. As reported in Table 6, the
resulting statistic is 0.29 indicating that the elimination of all variation in idiosyncratic
disturbances significantly alters inflation dynamics. All of this suggests that idiosyncratic shocks
do not alter the basic features of inflation dynamics but rather play a role in determining the
magnitude of fluctuations in inflation.
9 Conclusions
Traditionally, the study of short-run inflation has focused on aggregate data and abstracted from
microeconomic, behavioral considerations. In contrast, the present study examined the
implications of lumpiness and heterogeneity in micro level price setting for inflation dynamics in
the short-run. It differs from traditional approaches in that the empirical framework explicitly
microeconomic foundations for business cycle models derived under the assumption of price
stickiness. Here the (S,s) approach is exploited to gain a better understanding of a different
phenomenon in the aggregate economy, inflation. In this sense, the analysis demonstrates the
power of this approach in macroeconomic modeling.
The most important goal of the paper is to demonstrate the value of an empirical
technique that is applied to the study of inflation dynamics based on microeconomic price data25. What can one take away from the data analysis? Most importantly, the empirical results
demonstrate that microeconomic price data do contain extra information on aggregate inflation
dynamics not present in aggregate indexes. More in particular, first, the shape of the price
adjustment function is relatively stable over time. Second, fluctuations in the shape of
cross-sectional distribution of price deviations contribute to aggregate inflation dynamics. Asymmetry
in the cross-sectional density particularly matters. And finally, pricing shocks impact rather on
the magnitude than the timing of fluctuations in aggregate inflation.
The analysis has clear implications for monetary policy as well. In formulating short-term
inflation forecasts, besides some other non-price indicators, central banks today merely tend to
look at the history of aggregate inflation and ignore information contained in the cross-sectional
distribution of price deviations. It may well happen that no particular pattern is observed in past
average prices; still, a significant amount of pressure builds up in the directly unobservable price
deviations. Therefore, provided that appropriate microeconomic price data are available on a
timely basis, the empirical approach proposed in this study suggest that the direction and
intensity of bunching in price deviations are able to signal forthcoming aggregate price changes.
Of course, detecting the correct signal requires a careful specification of the target price level for
the different product prices appearing in the price index.
APPENDIX A – DATA
The data were originally collected for commercial purposes by the price-watch service of
Solvent Rt. (Solvent Inc.), Budapest. In its original form, the sample of prices in 8 stores selling
14 products over 27 (Period 1) and then 16 (Period 2) months is unbalanced in month-store
specific observations. However, no two consecutive observations are missing. Despite their
relatively sporadic occurrence26 missing price data pose a formidable obstacle to the Simulated Maximum Likelihood estimation procedure adopted in the study. To resolve this issue, missing
observations are imputed to produce a balanced panel of price data.
There appears to be two straightforward ways to get around the imputation issue. First,
the analysis could be restricted to stores with no missing observation. Unfortunately, this
approach would lead to the loss of all but one store in the sample. Second, the last available price
could be carried forward to the present. This procedure would extend the actual frequency of
observations to two months in the particular instances and so introduce a bias towards taking
excessively long intervals of nominal inaction. Instead, to avoid the shortcomings associated
with these procedures missing data are imputed the following way for each product j. Assume that pijt is missing. The case when pij,t-1 = pij,t+1 is an innocuous one. Here pijt is simply set so as
pijt = pij,t-1 = pij,t+1. If pij,t-1≠pij,t+1 then pijt is compared separately to both pij,t-1 and pij,t+1 in all stores other than store i. There are three different possible ways to set pijt: (a) pijt = pij,t-1, (b) pijt =
pij,t+1, (c) pijt≠pij,t-1, pij,t+1. If the number of non-missing price changes between period t-1 and t and between t and t+1 exceeds the number of unchanged prices in these periods then option (c) is selected. In particular, pijt is set according to (pijt- pij,t-1)/pij,t-1)/((pij,t+1- pijt)/pijt) = ((p-iijt- p-i
ij,t-1)/p-iij,t-1)/( p-iij,t+1- p-iijt)/p-iijt), where superscript –i denotes the average price level in all the stores but store i. This simply amounts to assuming that the relative size of imputed price changes
between periods t-1 and t and periods t and t+1 is proportional to the average non-missing price changes in these periods. If the number of non-missing price changes between period t-1 and t
and between t and t+1 does not exceed the number of unchanged prices then the choice is between the first two options. Option (a) is selected if the number of pairs of non-missing
APPENDIX B - A MODEL OF TARGET PRICE
The target price level of an optimizing store operating in an imperfectly competitive market and
using a frictionless price adjustment technology is specified in the following framework. For
simplicity, the profit function of a multi-product store is assumed to be separable across products
and no explicit aggregate demand linkage is allowed across product markets. It implies that a
store-product specific price sequence can be considered as the outcome of a single-product
store’s optimal decision.
The simple, illustrative model defining the target price level is as follows. In the absence
of adjustment costs, an imperfectly competitive store producing a single product maximizes its
profit subject to a demand constraint as
ijt b t b jt ijt ijt ijt t jt ijt
Pijt M W Q P Q M W Q
− Θ − = 1 ) , , (
maxπ ,
1 ,
.
. ijt= ijt− ij ijt ij > P
Q t
s η δ η .
Note that both prices (Pijt) and quantities (Qijt) are store and product specific. Stores are
assumed to operate a two-factor Cobb-Douglas technology with unit factor prices of raw
materials (Mjt) and of other inputs, like labor (Wt), and marginal costs (Θ Mjtb Wt1-b) that are the
same across different stores. Markets are imperfectly competitive, demand is unit specific with
ηij being the demand elasticity of product j sold in store i. δijt is a multiplicative demand shock.
Given this setup, the instantaneously optimal frictionless log price is obtained as
) ln( * ) 1 ln( )
ln( * 1
* jt b t ij ij ijt
ijt P W b M
p Θ +
The nature of the products examined implies that the price of raw materials (Mjt) is dominates other cost elements, thus in the empirical specification the first term on the right hand
side is assumed to be a nuisance term. Then, the target log price is further simplified to
jt ijt
ijt c bM
p* = + .
The equation states that the target price level prevailing prior to the potential adjustment is
determined by the price of raw materials up to an intercept term. The latter is interpreted here
interpreted as an individual specific markup.
The model suitable for estimation is obtained by specifying cijt as the sum of an idiosyncratic error ωijt with variance Ω and a store- and product-specific dummy, aij. To ease estimation, the individual effect, aij, is decomposed into a store-specific (ai) and product-specific (aj) component. Formally, the fixed portion of the price of product j in store i is assumed to be a convolution of separately identified store and product specific effects. All of these considerations
yield a fixed effect specification for estimation:
ijt jt j
i ijt jt ij
ijt a bM a a bM
References:
Ball, Laurence and N. Gregory Mankiw (1994): Asymmetric Price Adjustment and Economic Fluctuations, Economic Journal, pp. 247-261
Ball, Laurence and N. Gregory Mankiw (1995): Relative Price Changes as Aggregate Supply Shocks, Quarterly Journal of Economics, pp. 161-193
Blinder, Alan S. (1991): Why Are Prices Sticky? Preliminary Results from an Interview Study,
American Economic Review, pp. 89-96
Börsch-Supan, Axel and Hajivassiliou, Vassilis A. (1993): Smooth Unbiased Multivariate Probability Simulators for Maximum Likelihood Estimation of Limited Dependent Variable Models, Journal of Econometrics, pp. 347-368
Caballero, Ricardo J. and Eduardo M. R. A. Engel (1991): Dynamic (S,s) Economies,
Econometrica, pp. 1659-1686
Caballero, Ricardo J. and Eduardo M. R. A. Engel (1992): Price Rigidities, Asymmetries and Output Fluctuations, NBER Working Paper #4091
Caballero, Ricardo J., Eduardo M. R. A. Engel and John C. Haltiwanger (1995): Plant Level Adjustment and Aggregate Dynamics, Brookings Papers on Economic Activity, pp. 1-39
Caballero, Ricardo J., Eduardo M. R. A. Engel and John C. Haltiwanger (1997): Aggregate Employment Dynamics: Building from Microeconomic Evidence, American Economic Review, pp. 115-137
Cecchetti, Stephen G. and Erica L. Groshen (2000): Understanding Inflation: Implications for Monetary Policy, NBER Working Paper #7482
Caplin, Andrew S. and John Leahy (1991): State-Dependent Pricing and the Dynamics of Money and Output, Quarterly Journal of Economics, pp. 683-708
Dunne, Timothy and Mark J. Roberts (1992): Costs, Demand, and Imperfect Competition as Determinants of Plant-Level Output Prices, CES Working Paper, U.S. Bureau of the Census, 92-5
Eberly, Janice C. (1994): Adjustment in Consumers’ Durables Stocks: Evidence from Automobile Purchases, Journal of Political Economy, pp. 403-437
Hajivassiliou, Vassilis A. and Daniel L. McFadden (1990): The Method of Simulated Scores for the Estimation of LDV Models with an Application to External Debt Crises, manuscript
Heckman, James J. (1981): Statistical Models for Discrete Panel Data, in C. Manski and D. McFadden (eds.): Structural Analysis of Discrete Data with Econometric Applications, MTI Press, pp. 114-177
Kashyap, Anil K. (1995): Sticky Prices: New Evidence from Retail Catalogs, Quarterly Journal of Economics, pp. 245-274
Keane, Michael P. (1993): Simulation Estimation for Panel Data Models with Limited Dependent Variables, in Handbook of Statistics, Vol. 11, G. S. Maddala, C. R. Rao and H. D. Vinod (eds.), Elsevier Science Publishers, pp. 545-571
Rátfai, Attila (1998): The Size, Frequency and Synchronization of Price Adjustment: Microeconomic Evidence, manuscript
Table 1
Estimation Results
PERIOD 1 PERIOD 2
no AR(1) -ML AR(1) - SML no AR(1) - ML AR(1) - SML
ai,i=1,…,14,
aj,j=1,…,8
ai,i=1,…,14,
aj,j=1,…,8
ai,i=1,…,14,
aj,j=1,…,8
ai,i=1,…,14,
aj,j=1,…,8
sigma 0.117 0.092 0.099 0.086
(0.0023) (0.0021) (0.0026) (0.0025)
rho - 0.712 - 0.636
- (0.0228) - (0.0295)
b 1.040 1.343 0.961 1.528
(0.0098) (0.0275) (0.0269) (0.0357)
lnL -95.160 -87.608 -89.211 -85.557
Notes: 1 Trinomial Probit panel regressions by ML and SML with actual nominal
prices as dependent and raw material prices as explanatory variables. 2 sigma: standard deviation of residual, lnL: log-likelihood value, rho: autocerrelation parameter, b: slope parameter.
Table 2
Correlation between Aggregate Inflation and
Three Summary Statistics of the Density of Price Deviations
Π dec-diff stdev(z) skew(z)
Π 1.000
dec-diff 0.278 1.000
stdev(z) 0.120 0.941 1.000
skew(z) -0.343 0.273 0.271 1.000
Note: "stdev(z)" denotes the standard deviation, "skew(z)" denotes the skewness, "dec-diff" denotes the inter-deciles
difference of the distribution of desired price changes.
Table 3 Regression Results
-Aggregate Inflation and the Distribution of Price Deviations
Πt = b0 + b1Πt-1+ b2StDevt + b3Asymt + ut
b0 0.67 -4.20 0.90 -5.01 -5.57 7.05
0.54 3.81 0.63 2.39 3.84 4.43
b1 0.57 0.57 0.54 0.56 0.49 0.52
0.12 0.12 0.13 0.12 0.13 0.11
b2 - 56.08 - - 76.75 -357.23
- 43.38 - - 44.67 114.35
b3 - - -50.18 25.82 -2.60 112.21
- - 63.79 10.62 1.67 29.30
Adjusted R2 0.320 0.330 0.315 0.388 0.353 0.492
R2 0.335 0.360 0.346 0.416 0.396 0.526
F statistic 22.194 12.102 11.352 15.287 9.177 15.521
Notes: Estimated parameters are underlied. Standard errors are underneath the corresponding parameter estimates.
StDev denotes the standard deviation, Asym denotes the selected measure of asymmetry in the price deviation
distribution. For the latter variable, the standard skewness coefficient is used in the third and the fifth columns
[image:39.612.134.512.391.618.2]Table 4
Aggregate Price Changes: True vs. Counterfactual Series
G(.) A(oa) A(s) A(a)
f(oa) 0.00 0.25 0.31
f(s) 0.67 0.77 0.82
f(a) 0.88 0.98 1.00
[image:40.612.155.447.138.186.2]Note: a denotes actual, s denotes seasonal average, oa denotes overall average
Table 5
Correlation between Actual
and Counterfactual Series
Π aggregate A(a) , f(a) A(a) , f(no-idios)
A(a) , f(a) 1
A(a) , f(no-idios) 0.832 1
Table 6
Fit between Actual
and Counterfactual Series
f(.)
f(a)
f(no-idios)
Note: a denotes actual, no-idios denotes no idiosyncratic shocks
The counterfactual series is constructed by removing idiosyncratic
G(.)
1
[image:40.612.191.453.305.644.2]Source: Central Statistical Office, Hungary
Figure 1b
Inflation in Pigs and Cattle for Slaughter, 1993-1996 (annual growth rate; in percentage)
-20 -10 0 10 20 30 40 50 60 70
Jan-93 Feb-93 Mar-93 Apr-93 May-93 Jun-93 Jul-93 Aug-93 Sep-93 Oct-93 Nov-93 Dec-93 Jan-94 Feb-94 Mar-94 Apr-94 May-94 Jun-94