Proceedings of the Institution of Civil Engineers
Geotechnical Engineering 162
October 2009 Issue GE5 Pages 257–267
doi:10.1680/geng.2009.162.5.257
Paper 700012
Received 02/03/2007 Accepted 07/05/2009
Keywords:foundations/ geotechnical engineering
Kenneth Gavin
Lecturer, School of Architecture, Landscape and Civil Engineering, University College Dublin, Ireland
Abidemi Adekunte
Senior Group Design Engineer, Van-elle Ltd; former Research Assistant, School of Architecture, Landscape and Civil Engineering, University College Dublin, Ireland
Brendan O’Kelly
Lecturer, Department of Civil, Structural and Environmental Engineering, Trinity College Dublin, Ireland
A field investigation of vertical footing response on sand
K. Gavin
Phd, CEng, MIEI, A. Adekunte BE, CEng, MIEIand B. O’Kelly
PhD, CEng, CEnv, MICE, FIEI, PGeo, MIGI, FGSThis paper presents the results from an experimental programme that studied the factors affecting the bearing resistance of shallow footings in sand. In particular, the tests considered the effects of the footing width and embedment depth on the pressure– settlement response. By comparing the results with field tests on full-scale footings, simple correlations between the bearing pressure mobilised at normalised settlement levels of 5% and 10% of the footing width and the cone penetration testqcvalue were studied.
These correlations were found to be independent of footing size, embedment depth and sand state, although they were affected by creep. The rate of mobilisation of the footing resistance at low
settlements was found to be strongly dependent on the initial soil state and the previous loading history. A simple non-linear elastic soil model was found to adequately predict this response.
NOTATION
B footing width
c9 effective cohesion
D embedment depth
Dr relative density
D50 mean grain size
dª,dq embedment depth correction factors
E0 small-strain stiffness
E9s equivalent linear-elastic secant modulus
Ir influence factor
IR rigidity ratio
m creep coefficient
Nc,Nª,Nq bearing capacity factors
pp PMT pressure measured at a cavity strain ofR
q,qall,qult bearing pressure, allowable bearing pressure and
ultimate bearing resistance
qc cone penetration test end resistance value
q0:05,q0:10 bearing resistances mobilised at normalised
settlement ofs/B¼5% and 10%
˜R cavity strain measured in the pressuremeter text R0 original radius of the pressuremeter cavity
s,sc footing settlement, creep settlement Sª,Sq shape correction factors
t time
tref reference time
Æ empirical constant linkingqandqc
ratio ofE9s=qc
ˆ empirical function linkingqandq
ˆDesign design value is mean minus one standard
deviation
ˆMean Mean value ofˆfrom case histories
ª unit weight of the ground
Poisson’s ratio
9 friction angle
1. INTRODUCTION
Routine design of shallow footings on sand is commonly performed using the conventional bearing capacity approach to calculate the ultimate bearing capacityqult, given by
qult¼0:5BªNªsªdªþc9NcscþªDNqsqdq 1
in whichBis the footing width;ªis the unit weight of the ground;c9is the effective cohesion;Dis the embedment depth;Nª, NcandNqare bearing capacity factors that depend
on the footing shape and the effective friction angle9of the soil; and factorsSª, sc,Sq,dªanddqtake account of the footing
shape and embedment depth.
In uncemented dry or saturated sand (c9¼0) the second term of Equation 1 reduces to zero, and the non-geometrical variables are the bearing capacity factors. As noted by Randolphet al.,1the accuracy with which the bearing capacity
factors for a given soil can be determined has increased substantially in recent years, and the main uncertainty in the implementation of Equation 1 lies in the choice of an appropriate friction angle. The primary complication is the difficulty in sampling cohesionless soils to allow strength testing on representative specimens, and the stress-dependent effects on choice of friction angle. To overcome some of these challenges, greater reliance is being placed on in situ tests such as the standard penetration test (SPT)Nvalue, or the end resistance (qc) value measured in the cone penetration test
(CPT).
compared with full-scale footing tests to study factors affecting empirical correlations between the measured CPTqcvalues and
the bearing resistances mobilised at settlement levels typically associated with the serviceability limit state.
2. BACKGROUND
A number of researchers have noted that model footing tests should be corrected for scale effects. Such scale effects arise because of the dependence of the non-linear stress–strain response on the current stress level,2and the ratio of the model
width to the sand grain size.3The bearing capacity equation
(Equation 1) predicts that the ultimate bearing resistance will increase linearly with footing width and depth. Using model footings placed at the surface of sand, Cerato and Lutenegger4
showed clearly that the bearing capacity factorNªreduced significantly as the footing width increased. (See also Yamamotoet al.5, Whiteet al.6and Zhuet al.7)
Briaud8compiled data from a number of footing tests
performed in the field to investigate the effects of footing width and embedment depth on the bearing pressure mobilised by footings in sand. One case history originally reported by Ismael9included tests where both the footing width and the embedment depth were varied. These comprised two test series in an overconsolidated sand deposit, the first on a 0.5 m square footing (series 1) and the second on a larger, 1.0 m square footing (series 2). Both models were tested at four embedment depths (D), varying from 0.5 to 2.0 m below ground level (bgl). The pressure–settlement curves for these tests are shown in Figure 1a. It is clear that, at a given displacement, the smaller footing (series 1) mobilised a much higher bearing stress. However, there was no consistent increase in bearing stress when the embedment depth increased from 0.5 to 2.0 m in the overconsolidated sand deposit (in which the SPTNvalues were relatively constant with depth). Briaud8demonstrated that
when the bearing pressure was normalised by the mean SPTN value within the zone of influence of the footing, and the settlement was normalised by the footing width, the normalised pressure–settlement curves for the tests were unique (Figure 1b). Similar results were obtained from a range of sites where the bearing pressure had been normalised by in situ test data from the SPT, CPT and pre-bored pressuremeter test (PMT).
Approaches that directly link the allowable bearing pressure (qall) mobilised at specified displacement levels with SPTN
values have been suggested by Terzaghi and Peck10and
Burland and Burbridge,11among others. Empirical correlations
that link the bearing resistance (q) mobilised at some normalised displacement level (s/B) with theqcvalue are
typically of the form
q¼Æqc
2
whereÆis an empirical constant, andqis the bearing pressure typically mobilised at settlement levels ofs/B¼5% and 10% of the footing width (denoted byq0:05andq0:10respectively).
Eslaamizaad and Robertson12compiled a database of footing
tests, and suggested thatÆdepends on the soil density and relative embedment (D/B). Lee and Salgado13reported
finite-element analyses (FEA) of footings on sand. They investigated
the effect of footing width and relative density (Dr) on the
mobilised bearing resistance. Their data, shown in Figure 2 (for s/B¼10%), show thatÆincreased when the relative density of the soil reduced and the footing width increased. The rate at whichÆincreased with the footing width depended on the relative density of the soil, with an increase of 35% being noted forDr¼90% when the footing width increased from 1 m to
3 m, whereas the increase was only 5% forDr¼30%.
Randolphet al.1summarised the results of laboratory and field
tests and numerical analyses performed on shallow footings and buried piles. Although a relatively wide range ofÆvalues
0 200 400 600 800 1000 1200 1400 1600
0 5 10 15 20 25 30
s: mm (a)
q
: kP
a
Series 1:B⫽0·5 m
Series 2:B⫽1 m
D⫽2 m
D⫽1 m
D⫽2 m D⫽0·5 m
D⫽1·5 m
D⫽1 m
D⫽1·5 m D⫽0·5 m
0 10 20 30 40 50 60 70 80
0 1 2 3 4 5 6
s B/ : % (b)
q
: kP
a
/SPT
N
Series 1:B⫽0·5 m
Series 2:B⫽1 m
D⫽2 m
D⫽1 m
D⫽2 m D⫽0·5 m
D⫽1·5 m
D⫽1 m
D⫽1·5 m
[image:2.595.298.539.38.574.2]D⫽0·5 m
were reported, withƼ0.09–0.16 ats/B¼5%, increasing to Ƽ0.13–0.21 ats/B¼10%, there was no evidence thatÆ varied with footing width or sand state. This is in keeping with observations from tests that measured the base resistance of full replacement bored piles by De Cocket al.14and Cadogan
and Gavin,15who note that anÆvalue of approximately 0.2
provides a good fit to the data available ats/B¼10%. However, it should be noted that the number of high-quality case studies of full-scale pile tests is limited, and the natural data scatter could obscure some fundamental trends identified in the FEA method.
Owing to the relatively large ultimate bearing resistance of sand, foundations are usually remote from failure. Hence the designer is primarily concerned with estimating the footing settlement when the safe or allowable bearing pressure (qall) is
applied. This is typically achieved by assuming that over this stress range the foundation response can be predicted using an appropriate linear-elastic, secant Young’s modulus (E9s), and a
myriad of recommendations are available in the literature to assist in the choice of this parameter value.16
The settlementsat a given applied pressure can be estimated using the standard equation for predicting the elastic settlement beneath a plate,17
s¼qB1 2 ð ÞIr
E9s 3
whereis the Poisson’s ratio value andIris a settlement
influence factor that depends on the footing shape and rigidity, the embedment depth, and the founding layer thickness. The principal difficulty with the application of Equation 3 concerns the selection of a representativeE9svalue. A number of
researchers have proposed direct correlations betweenE9sand
qc(E9s¼qc). While a wide range ofvalues have been
published, Das16compiled values recommended by 13
researchers, who generally recommendedvalues ranging from 1 to 3. However, Lehaneet al.18and others have shown
that at relatively small strain levels there is a weak dependence betweenE9sandqc, with the effects of stress level and ageing
being dominant, which suggests that constantvalues should be used with caution.
Briaud and Gibbens19noted that the deformation pattern
recorded by inclinometers installed beneath test footings resembled the barrelling effects caused by the inflation of a PMT device. Briaud5proposed that the complete pressure–
settlement response of a footing could be constructed from the pressuremeter expansion curve using the transformation
s B¼0:24
˜R R0 4a
q¼ˆpp 4b
where˜R/R0is the ratio of the change in radius during
expansion to the original radius of the PMT cavity;qis the vertical stress mobilised when the footing settlement iss;ppis
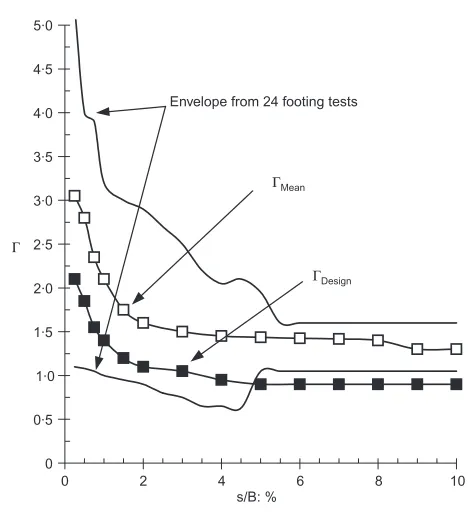
the PMT pressure when the cavity expansion is˜R; andˆis the gamma function linkingppandq. Briaud5compiled
experimental measurements and numerical estimates ofˆ (Figure 3) and proposed two best-fitˆfunctions:ˆMeanbased
on the mean data, andˆDesignbased on the mean minus one
standard deviation. It is noteworthy that there is considerable scatter in theˆdata in Figure 3, particularly at strain levels (s/B) below 2%, and Briaud5noted that this scatter suggests the
likely error involved in the application of theˆfunctions. However, this effect may also be explained by the poor correlation betweenE9sat low strain levels and in situ test 0
0·05 0·10 0·15 0·20 0·25 0·30 0·35
0 1 2 3 4
B: m
α
/
⫽
qqb0·1
c
[image:3.595.56.295.39.299.2]Dr⫽90% Dr⫽70% Dr⫽50% Dr⫽30%
Figure 2. Effect of sand state and footing width onq0:10/qc13
Γ
0 0·5 1·0 1·5 2·0 2·5 3·0 3·5 4·0 4·5 5·0
0 2 4 6 8 10
s/B: %
Envelope from 24 footing tests
ΓMean
[image:3.595.313.551.497.756.2]ΓDesign
parameters (such asqc,Nandpp) measured in tests that
impose large strains on the ground.
3. DESCRIPTION OF EXPERIMENTS
3.1. Site conditions
The plate load tests were performed at a sand quarry on the outskirts of Blessington village, located 25 km south-west of Dublin city. The sand, which was horizontally bedded, had been deposited at the base of a glacial lake. The particle grading between the beds varied from that of silty sand (mean grain sizeD50¼0.10 mm) to that of coarse sand (D50¼
0.32 mm), depending on the level of the glacial lake at the time of deposition. Glacial action and the recent removal by quarrying of the upper 15 m of overburden material has resulted in the sand being in a heavily overconsolidated state.
The footing tests were performed at two locations at the site. The first test series was conducted in 2004 on 100 mm and 250 mm wide plates in an area of the quarry that had experienced no sand extraction for a number of years. The second test series was conducted in 2005 on 400 mm wide footings shortly after sand had been excavated to a depth of 2.0 m below the 2004 test level. Four CPTs were performed at the test area in 2004 and repeated in 2005 (Figure 4a). The CPT qctraces were reasonably consistent, allowing the meanqc
profiles (heavy traces in Figure 4a) to be used as representative profiles. The mean CPT profile for the first test series indicated very highqcvalues, typically about 20 MPa, at about 0.2 m
bgl, gradually reducing to about 1.0 m bgl (below ground level), and thereafter remaining relatively uniform (withqc¼
15–18 MPa). The subsequent removal of the uppermost 2.0 m depth of sand over the second test area in 2005 clearly had an effect on the near-surface CPT profile, with the CPTqcvalues
gradually increasing with depth to about 1.0 m below the new reduced ground level, before again becoming relatively uniform at greater depth. Sand replacement tests indicated that the material is very dense (values of relative density of about 100% were recorded), and the groundwater table was located at about 5.0 m bgl (relative to the 2004 ground level). Seasonal variations of the natural water content were insignificant, with values of 6–7% being consistently measured for the sand above the groundwater table. The small-strain stiffness (E0)
profile was measured in situ at the 2004 ground level using the multichannel analysis of surface waves (MASW) technique and assuming a Poisson’s ratio value of 0.1 at low strain levels (Figure 4b). The ratio ofE0/qcmeasured at the site was
approximately 11. Further details of the soil conditions at the test site have been reported by Gavin and O’Kelly.20
3.2. Experimental procedure
The test plates were square steel plates, 25 mm thick, with side widthsB¼100, 250 and 400 mm. The footings were placed at the base of trenches that had been excavated such thatD/B ranged from 0.4 to 2.0. The load tests on the 100 and 250 mm footings were performed in 2004; the 400 mm footings were load-tested in 2005, shortly after the excavation of the 2 m depth of sand. The footings were vertically loaded using a 200 kN truck for reaction. The load was typically applied in 5–10% increments of the assumed capacity, and each increment was held for approximately 10 min. The load was measured using a 200 kN load cell. The vertical settlements of
the footing corners were measured using four linearly variable displacement transducers (LVDTs) that were secured to a 4.0 m long reference beam. The load cell and the LVDTs were connected to a data-logger that recorded the load–settlement responses at 1 s intervals throughout the tests.
3.3. Experimental results: pressure–settlement response of model footing tests
The mobilisation of the bearing resistanceqfor the 100, 250 and 400 mm square plates with increasing settlement is shown
(a)
(b) 0
0·5
1·0
1·5
2·0
2·5
3·0
3·5
4·0
0 50 100 150 200
G0: MPa
z
: m
MASW profile 1
MASW profile 2
25 20
15 10
5 0
0·5
1·0
1·5
2·0
2·5
3·0
3·5
4·0 0
CPTqc: MPa
z
: m
2005 test level CPT (2004)
[image:4.595.298.537.37.601.2]CPT (2005)
Figure 4. Characterisation of the Blessington site: (a) CPTqc
in Figure 5a. Note that the settlement shown is the mean value of the four LVDT readings. The following trends emerge.
(a) The bearing pressures mobilised at relatively modest displacements were high, ranging fromq1200 kPa at s¼13 mm for the 400 mm plate toq2950 kPa ats¼
21 mm for the 250 mm plate. The soft response of the 400 mm plates was measured in the area where recent removal of overburden had caused a significant decrease in the measuredqcvalue.
(b) The plate size has a clear effect on the bearing resistance mobilised for a given settlement. For example, the bearing resistance mobilised ats¼5 mm increased from about 650 kPa for the 400 mm plate to about 2600 kPa for the 100 mm plate.
(c) The responses of bearing resistance against settlement for
all of the footings exhibit an initial near-linear phase, which extends to higher displacements for larger footings. (d) When the 250 and 400 mm square plates were unloaded,
the response during subsequent reloading was significantly stiffer than that experienced during the initial loading, and remained so until the bearing pressure had approached the previous maximum applied pressure (qpre).
(e) Increasing theD/Bratio from 0.4 to 2.0 for the 250 mm square plate did not appear to increase the bearing pressure mobilised by the footing significantly.
The data are replotted (ignoring reloading phases) in Figure 5b, in which the bearing pressure has been normalised by the CPT qcresistance (measured below the plate and averaged over a
distance equal toB(m)0:75), and the settlement has been normalised by the plate width. The data support the findings of Briaud,5and suggest that the plate width and relative depth
have no significant effect on the mobilised bearing resistance, provided that an appropriate measure of the soil strength (in this case theqcvalue) is used to normalise the bearing
pressure.
4. COMPARISON WITH OTHER DATA
4.1. Comparison of normalised bearing resistance of model and full-scale footings
In order to examine possible scale effects, comparisons were made between the Blessington plate test results and 14 large-scale footing tests from three sites where complete pressure– settlement curves had been published (Table 1). The field data included five tests performed at Texas A&M University (site A) on footings founded at 0.75 m bgl and reported by Briaud and
0 1000 2000 3000 4000
0 5 10 15 20 25
s: mm (a)
q
: kP
a
100 mm
250 mm
400 mm
D/B⫽0·4 D/B⫽2
D/B⫽1 D/B⫽1
0 0·05 0·10 0·15 0·20 0·25
0 2 4 6 8 10
s/B: % (b)
q q
/c
100 mm
250 mm
400 mm D/B⫽0·4
D/B⫽2
D/B⫽1
[image:5.595.55.563.245.752.2]D/B⫽1
Figure 5. Effect of footing size on bearing resistances at Blessington site: (a) pressure-settlement response; (b) normalised pressure-settlement response
Test site Width:
m
Depth: m
CPT qc: kPa
SPTN60*
A Texas 1.0 0.75 7 250 18
1.5 0.75 6 500 18
2.5 0.75 6 400 18
3.0 0.75 7 250 18
3.0 0.75 5 000 18
B Kuwait 0.5 0.5 7 275† 20
0.5 1.0 7 275† 20
0.5 1.5 7 275† 20
0.5 2.0 7 275† 20
1.0 0.5 7 275† 20
1.0 1.0 7 275† 20
1.0 1.5 7 275† 20
1.0 2.0 7 275† 20
C Shenton Park 0.75 1.0 3 800 –
1.0 1.0 4 080
1.0 0.5 3 330
1.5 1.0 4 350
D Blessington 0.10 0.1 17 000 –
0.25 0.1 14 500 –
0.25 0.5 14 500 –
0.40 0.4 8 700 –
* SPTNvalues have been corrected for energy effects. † CPTqcvalue from correlation with SPTN.
SPTNand CPTqcvalues are estimated over the depth of
influence equal toB0:75below the footing.
Gibbens.19The medium-dense sand was in a lightly
overconsolidated state (OCR2) following the removal of about 1.0 m overburden depth. The mean CPTqcresistance
ranged from 5 to 7.25 MPa in the zone of influence of the footing.
The normalised pressure–settlement responses shown in Figure 6a suggest that a relatively unique curve, independent of the footing width, is obtained at a given strain level, which agrees
with the findings of Briaud.5A feature of the footing tests not
noted at the Blessington site was the effect of creep (settlement at constant applied stress). The load test procedure at Texas involved maintaining each load increment for 30 min and occasionally for 24 h. Creep-induced settlements are obvious from the test data, with the effect increasing at higher stress levels. Briaud and Gibbens19showed that the creep settlement
(sc) response could be predicted using the equation
sc1
sc2 ¼ t1
t2
n
5
wheresc1andsc2are the settlements after time periodst1and
t2respectively, andnis a creep exponent, withnvarying from
0.005 to 0.03 for sand at working stress levels.
An obvious consequence of the observed creep response is that the normalised pressure–settlement curve measured from a load test at the site is not unique, but rather depends on the load test procedure (i.e. the duration of the maintained load stage).
Ismael9reported eight footing tests performed in an
overconsolidated silty sand at a site in Kuwait with the groundwater table located at 2.8 m bgl. No creep effects are evident in the published pressure–settlement response of these footings (shown in Figure 1). In situ testing yielded SPTN values, and CPTqcvalues have been derived for the site using
the correlation proposed by Kulhawy and Mayne.21
Lehaneet al.18reported four footing tests performed at the
University of Western Australia geotechnical test site at Shenton Park, Perth. The tests were designed to investigate the effects of footing width and embedment depth on the footing response. The average CPTqcresistance varied from 3.3 MPa
to 4.3 MPa within the zone of influence of the footings. The groundwater table was located at the base of the sand layer at about 5.5 m bgl. The normalised pressure–settlement response (see Figure 6b) was found to be independent of the footing width and embedment depth. Each step in the applied load during the testing was followed by a maintained load stage of 10 min duration. Significant creep settlement (sc) occurred,
even at relatively low stress levels, during the maintained load stages. Lehaneet al.18also noted thats
cincreased in value
with the natural logarithm of elapsed timetsince application of the load, and also with the natural logarithm of the creep rate. The following equations to model the creep response were proposed.
sc
B¼mln t tref
)dðsc=BÞ
dt ¼Sn¼ m
t
6a
sc
B¼ mln Snref
Sn 6b
Snref ¼
m tref 6c
0 0·05 0·10 0·15 0·20 0·25
0 2 4 6 8 10
s/B: % (a)
q q
/c
1·0 m
1·5 m
2·5 m
3 m (N)
3 m (S)
0 50 100 150 200 250 300 350 400
0 1 2 3 4 5 6 7 8
s/B: % (b)
q
: kP
a
1·0 m
1·5 m
1·0 m
[image:6.595.56.472.163.769.2]0·75 m
wheremis a creep coefficient andtrefis a reference time
corresponding to the onset of the creep settlement.
Lehaneet al.18derived values for the creep coefficientmfrom
measurements of the one-dimensional creep settlement response of the footings, and the shear-induced creep measured in pressuremeter tests, over a range of various stress levels (q/qult) at the Shenton Park site, wherequltwas obtained by
extrapolating the measured pressure–settlement curves. The estimatedqultvalues ranged from 600 to 690 kPa (which
equated toqult/qcvalues of 0.17–0.19qc), and the following
best-fit expression was derived to describe the creep settlement response.
m¼0:02 q qult
2
7
4.2. Normalised bearing resistance
Figure 7a shows the normalised bearing resistances mobilised during all the model and full-scale load tests listed in Table 1. The mean CPTqc values recorded over a depth ofB(m)0
:75
below the footing level were used in normalising the data. Although unload–reload tests were performed in all of the Texas A&M tests (site A), at Shenton Park (site C) and in some of the Blessington tests (site D), the unload–reload portions are not included in Figure 7a for clarity. Instead the overall pressure–settlement curves5are shown in Figure 7a. Creep
significantly affected the footing response at two sites, Texas and Shenton Park (sites A and C respectively), with the effects becoming more pronounced at higher stress levels.
Withstanding the influence of creep, Figure 7a shows the following.
(a) At low strain levels (s/B,4%), the pressure–settlement curves for each site appeared to be distinct, although the curves tend to converge ats/Bvalues greater than 4% (excluding Shenton Park, where creep effects were largest). (b) Theq/qcvalues at larger strain show no tendency to vary
with footing width or sand state, which suggests that, in the absence of significant creep, the bearing resistance at s/B¼5% can be conservatively estimated usingƼ0.15. (c) While there is a dearth of data at larger normalised
settlements, anÆvalue of 0.2 (as recommended by Randolphet al.,1among others) appears reasonable,
particularly for the sites where creep effects were insignificant. This value forÆis seen to provide a reasonably conservative estimate of the bearing resistance mobilised over a range of footing size and sand state in the FEA analyses reported by Lee and Salgado13(Figure 2).
Since the rate at which the normalised resistance develops during the early loading portion of the tests appears to be quite distinct for each site, the data are replotted at a reduced scale in Figure 7b. The bearing pressure is seen to mobilise more rapidly during the early stages of the footing tests performed at sites A and C (Texas and Shenton Park respectively) than at site B (Kuwait). The Blessington pressure–settlement curves (site D) exhibited an intermediate response. Although there is limited published information in the literature from footing tests presenting both the complete pressure–settlement curve and in
situ test results, Papadopulous22compiled a database of
settlement at working load and corresponding CPTqcvalues
from 23 sites where the footing width ranged from 0.5 m to 36 m. The data (shown as discrete points in Figure 7b) suggest that the pressure–settlement curves represent a reasonable envelope to field response. Interestingly, while the settlements
0 0·05 0·10 0·15 0·20 0·25
0 1 2 3 4 5 6 7 8 9 10
s B/ : % (a)
q q
/c
Site A - 1 m Site A - 1·5 m Site A - 3 m (N) Site A - 2·5 m Site A - 3 m Site B - S1 -D⫽0·5 m Site B - S1 -D⫽1 m Site B - S1 -D⫽1·5 m Site B - S1 -D⫽2 m Site B - S2 -D⫽0·5 m Site B - S2 -D⫽1 m Site B - S2 -D⫽1·5 Site B - S2 -D⫽2 m Site D -B⫽0·1 m Site D -B⫽0·25 Site D -B⫽0·4 m Site C -B⫽1·5 Site C -B⫽1 m,D⫽1 m Site C -B⫽1 m,D⫽0·5 m Site C -B⫽0·75 m
s B/ : % (b)
q q
/c
0 0·02 0·04 0·06 0·08 0·10 0·12 0·14
0 0·5 1·0 1·5 2·0 2·5
[image:7.595.313.553.52.647.2]Site A - 1 m Site A - 1·5 m Site A - 3 m (N) Site A - 2·5 m Site A - 3 m Site B - S1 -D⫽0·5 m Site B - S1 -D⫽1 m Site B - S1 -D⫽1·5 Site B - S1 -D⫽2 m Site B - S2 -D⫽0·5 m Site B - S2 -D⫽1 m Site B - S2 -D⫽1·5 Site B - S2 -D⫽2 m Site D -B⫽0·1 m Site D -B⫽0·25 Site D -B⫽0·4 m Site C -B⫽1·5 Site C -B⫽1m,D⫽1 m Site C -B⫽1 m,D⫽0·5 m Site C -B⫽0·75 m Papadopolous
measured under the footings in his database ranged between 3 mm and 21 mm, the vast majority of footings in service settled by less than 1.25% of the footing width.
4.3. Comparison of the stiffness response of footing tests
Pressure–settlement curves compiled from the different sources suggest that at large strains (s/B.4%), and in the absence of significant creep, theq/qcratio was similar for the range of
footing widths, embedment depths and sand states considered. However, a wide variation in the rate at which the bearing resistance was mobilised at strain levels of concern to foundation designers (s/B,2.5%) was evident. Although the curves for a given site were relatively uniform, irrespective of the range of footing sizes and depths considered, the overall response at the different sites was quite distinct.
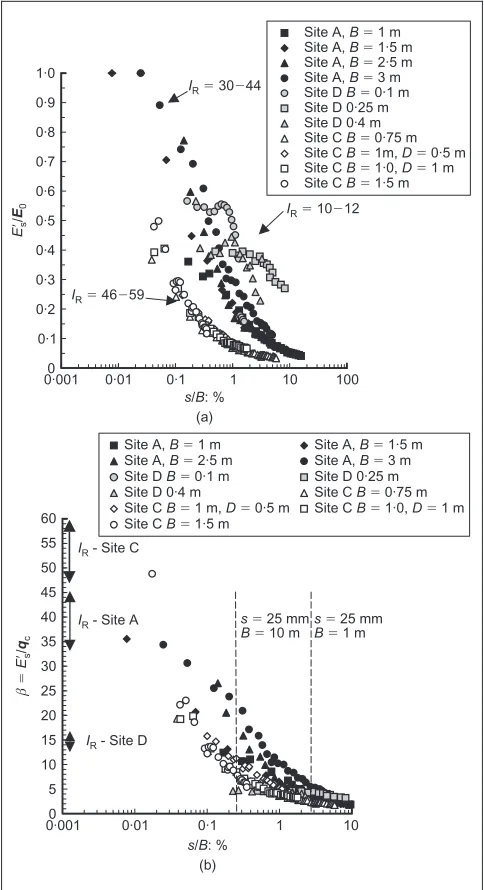
The marked difference in the initial stiffness response (seen in Figure 7b) can be examined by considering the non-linear stiffness response of the sand. Figure 8a shows the equivalent linear-elastic secant modulus values (E9s) derived from the
pressure–settlement curves using the standard equation for
predicting the elastic settlement beneath a plate (Equation 3), which were normalised by the small-strain stiffness (at sites A, D and C whereE0was measured). The normalised stiffness
(E9s=E0) responses of all footings at each site are similar,
regardless of the footing width or depth; however, there is a distinct difference in the rate of stiffness degradation (reduction ofE9s=E0) with increasing strain level between the
sites. The rate at which stiffness degradation occurred (the degree of non-linearity) was highest at Shenton Park (site C), whereE9s=E0¼0.08 ats/B¼1%. This compares withE9s=E0
values of 0.2–0.3 at Texas (site A) and 0.4–0.55 at Blessington (site D), at the same normalised displacement.
Atkinson17noted that the parameters that describe the
non-linear stiffness response of soils are the rigidity (IR), defined as
the ratio of small-strain stiffness to strength (IR¼E0/qult), and
the degree of linearity. He noted that the degree of non-linearity decreases asIRreduces. Given thatqcdescribes the
soil strength at very large strain, andE0was measured at the
sites, the rigidity can be calculated as being in the rangeIR¼
30–44 at site A, 10–12 at site D, and 46–59 at site C. Consideration of Figure 8a shows that the variation of rigidity suggests a plausible reason for the clear variation of the stiffness response evident at the three sites.
Further insight into the non-linear stiffness response can be obtained by considering the secant stiffness normalised by the CPTqcvalue (¼E9s=qc) in Figure 8b. While there is a dearth
of data at low normalised settlement (s/B,0.1%), the available data suggest that at a given site the initialvalue equalsIR. The
values at all sites tend to converge as the normalised
settlement increases, and are similar at all sites whens/Bexceeds 5%. The convergence in the range ofvalues with increasing s/Bis similar to that reported for theˆfunction in Figure 3. Given that the maximum allowable settlement beneath a shallow foundation is typically specified as 25 mm, the resulting normalised settlement beneath a range of typical foundations of width ranging from 1 m to 10 m (s/B¼0.25–2.5%) is shown in Figure 8b. It is clear that the spread ofvalues recorded over this displacement range is quite significant (¼2–24), which compares to the range of 1 to 3 typically used in design
practice.16While the data illustrate the difficulty associated with
choosing a unique value offor use in settlement calculations, this does demonstrate that the range ofvalues typically encountered when considering measured settlement data may be caused by variations in the sand rigidity and the normalised settlement level.
5. DISCUSSION
Comparison of the model and full-scale footing tests at large strains (s/B.4%) suggests that a unique normalised pressure– settlement curve for footings in sand can be described
(independent of the width and relative depth of the footing). However, theq/qcratio measured at low strain levels was not
unique, and is affected by the geological formation and stress history of the sand deposit at the displacement levels of concern to footing designers (s/B,2.5%).
Gavin and Lehane23presented a simple model that predicts the
pressure–settlement curve for a pile in sand, with the shape of the curve depending on: (a) the sand state and pile type (i.e. displacement or non-displacement); (b) the previous loading
0 0·1 0·2 0·3 0·4 0·5 0·6 0·7 0·8 0·9 1·0
0·001 0·01 0·1 1 10 100
s B/ : % (a)
s B/ : % (b)
E
⬘s0
/
E
Site A,B⫽1 m Site A,B⫽1·5 m Site A,B⫽2·5 m Site A,B⫽3 m Site DB⫽0·1 m Site D 0·25 m Site D 0·4 m Site CB⫽0·75 m Site CB⫽1m,D⫽0·5 m Site CB⫽1·0,D⫽1 m Site CB⫽1·5 m
IR⫽10 12⫺
IR⫽30 44⫺
IR⫽46 59⫺
0 5 10 15 20 25 30 35 40 45 50 55 60
0·001 0·01 0·1 1 10
β
/
⫽⬘
Esc
q
Site A,B⫽1 m Site A,B⫽1·5 m Site A,B⫽2·5 m Site A,B⫽3 m Site DB⫽0·1 m Site D 0·25 m Site D 0·4 m Site CB⫽0·75 m Site CB⫽1 m,D⫽0·5 m Site CB⫽1·0,D⫽1 m Site CB⫽1·5 m
IR- Site C
IR- Site A
IR- Site D
s⫽25 mm B⫽10 m
s⫽25 mm B⫽1 m
[image:8.595.42.284.300.745.2]history; and (c) the residual stresses at the pile base. Since residual stresses are not developed by shallow footings, a modified, two-stage form of the model is proposed (Figure 9), the key components of which are
(a) a linear stage (no stiffness degradation occurs) with the Young’s modulusE0, until a yield strain (sy/B) is reached
that, from Figure 8a, can be assumed to be 0.03%, and (b) a parabolic (non-linear stage) up to a normalised base
displacement level,s/B¼10%.
The pressure mobilised during the linear stage can be obtained from
q¼k s B
8
k¼ 4E0
ð12Þ for s=B<sy=B 9
and during the parabolic stage from
q¼ k sy B
1n s
B n
for 10%.s=B.sy=Bandsy=B>0:03% 10
The model can be used to predict the complete pressure– settlement curve for a footing up tos/B¼10%. The input parameters required are the small-strain stiffnessE0and the
bearing pressure ats/B¼10% (estimated usingq0:10¼0.2qc).
The value of the exponentnin Equation 10 is obtained by equating the bearing pressure prediction ass/B¼10% with the value derived fromq¼0.2qc. The creep effects can be
[image:9.595.204.543.33.762.2]accounted for by calculatingmcoefficient values (given by Equation 7) from the initial normalised pressure–settlement curve derived using the model outlined above.
Figure 10 shows the first-time pressure–settlement response predicted using Equations 8, 9 and 10 for the test footings at Blessington and Texas (ignoring creep effects). The model provides a reasonable prediction of the measured response, and encouragingly seems to capture the effects of the footing width, embedment depth and sand state on the response over
qb0·1
10% s By/
s/B: % Linear
Parabolic
q
: kP
a
Figure 9. Non-linear pressure–settlement model
0 500 1000 1500 2000 2500 3000 3500 4000
0 5 10 15 20 25
s: mm (a)
q
: kP
a
100 mm
250 mm
400 mm 100 mm
prediction
250 mm prediction
400 mm prediction
0 200 400 600 800 1000 1200 1400 1600
0 20 40 60 80 100
s: mm (b)
q
: kP
a
1 m
1·5 m
3 m (N)
Predicted
0 0·02 0·04 0·06 0·08 0·10 0·12 0·14
0 2 4 6 8
s/B: % (c)
q q
/c
1·0 m
1·5 m
1·0 m
0·75 m
Prediction ignoring creep
Prediction with creep (m⫽0·2)
the full strain range. The significance of the creep effect at Shenton Park is shown in Figure 10c. When the effects were not considered in the model, the settlement response was clearly underpredicted. A significant improvement in the prediction was achieved by including creep effects.
6. SUMMARY AND CONCLUSIONS
Plate load tests performed at a very dense sand test site were compared with full-scale load tests performed at a range of sites, and suggest that the normalised bearing resistance mobilised at relatively large settlements (s/B.5%) is
independent of the footing width and embedment depth. While recognising that the bearing resistance continues to increase with settlement until failure occurs, and that creep effects may significantly influence the response, it appears that the bearing resistance valuesq0:05andq0:10mobilised ats/B¼5% and
10% respectively can be adequately predicted simply as well-defined fractions of the cone penetration testqcvalue.
Ats/B,5% the normalised bearing resistance (q/qc)
mobilised was affected by the geological formation and stress history of the deposit. During first-time loading of footings the stiffness response is controlled by the rigidity of the soil. Sands with high rigidity exhibit strong stiffness non-linearity. This results in rapid development of their available bearing
resistance. In contrast, the available resistance of sand with low rigidity mobilises more gradually. This effect is illustrated in Figure 11, which shows predictions of the bearing pressure mobilised at a footing settlement of 25 mm (q0:025) as a
function of the CPTqcresistance,IR, and the footing width.
A simple pressure–settlement model was proposed and proven to provide reasonable estimates of the measured response for both model and full-scale footings. In particular, the model captured the main features that control the rate of mobilisation
of the footing resistance, namely footing width, sand state and rigidity. Given the lack of scale effects evident in the footing tests when normalised in an appropriate manner, it appears that the input parameters for the model, such as the initial stiffness and the creep coefficient, can be obtained from relatively low-cost in situ shear wave modulus and plate loading tests.
ACKNOWLEDGEMENTS
This work was part of a research project sponsored by
Sustainable Energy Ireland and Aertech Ltd. The authors would like to thank Professor Barry Lehane for helpful comments on the original draft, the technical staff in the civil engineering departments at Trinity College Dublin and University College Dublin, and Roadstone Ltd for unhindered access to the Blessington site. The paper was written by the lead author while working as a research associate in the Urban Institute, University College Dublin. Financial assistance provided by the Urban Institute is gratefully acknowledged.
REFERENCES
1. RANDOLPHM. F., JAMIOLKOWSKIM. B. and ZDRAVKOVICL. Load carrying capacity of foundations.Proceedings of Advances in Geotechnical Engineering: The Skempton Conference,London, 2004,1, 207–241.
2. ALTAEA.and FELLINIUSB.H.Physical modelling in sand. Canadian Geotechnical Journal, 1994,31, No. 3, 420–431. 3. OVESEN,N.K. The scaling law relationships.Proceedings of
the 7th European Conference on Soil Mechanics and Foundation Engineering, Brighton, 1979, 319–323. 4. CERATOA.B.and LUTENEGGERA.J. Scale effects of shallow
bearing capacity on granular material.ASCE Journal of Geotechnical and Geoenvironmental Engineering, 2007, 133, No. 10, 1192—1202.
5. YAMAMOTON.,RANDOLPHM.F.and EINAVI.Numerical study of the effect of foundation size for a wide range of sands. ASCE Journal of Geotechnical and Geoenvironmental Engineering, 2008,135, No. 1, 37—45.
6. WHITED.J.,THEK.L.,LEUNGC.F.and CHOWY.K.A comparison of the bearing capacity of flat and conical circular foundations on sand.Ge´otechnique, 2008,58, No. 10, 781–792.
7. ZHUF., CLARKJ. I. and PHILLIPSR. Scale effect of strip and circular footings resting on a dense sand.ASCE Journal of Geotechnical and Geoenvironmental Engineering, 2001, 127, No. 7, 613–621.
8. BRIAUDJ.L.Spread footings in sand: load settlement curve approach.ASCE Journal of Geotechnical and
Geoenvironmental Engineering, 2007,133, No. 8, 905–920. 9. ISMAELN.F. Allowable pressure from loading tests on
Kuwaiti soils.Canadian Geotechnical Journal, 1985,22, No. 2, 151–157.
10. TERZAGHIK. and PECKR.Soil Mechanics in Engineering Practice, 2nd edn. Wiley, New York, 1967.
11. BURLANDJ.B.and BURBRIDGEM.C. Settlement of foundations on sand and gravel.Proceedings of the Institution of Civil Engineers, Part 1, 1985,78, No. 6, 1325–1381.
12. ESLAAMIZAADS.and ROBERTSONP.K. Cone penetration testing tests to evaluate bearing capacity of foundations in sands.Proceedings of the 49th Conference of the Canadian Geotechnical Society, 1986, 429–438.
0 0·02 0·04 0·06 0·08 0·10 0·12 0·14
0 2 4 6 8 10
B: m
qq0·025
c
/
IR⫽100
IR⫽50
IR⫽25
[image:10.595.52.351.474.759.2]IR⫽12·5
13. LEEJ.and SALGADOR.Estimation of bearing capacity of circular footings on sands based on cone penetration test. ASCE Journal of Geotechnical and Geoenvironmental Engineering, 2005,131, No. 4, 442–451.
14. DECOCKF.,LEGRANDC.and HUYBRECHTSN.Overview of design methods of axially loaded piles in Europe: report of ERTC3-Piles, ISSMGE Subcommittee.Proceedings of the 8th European Conference on Soil Mechanics and Geotechnical Engineering, Prague, 2003, 663–715. 15. CADOGAND. D. and GAVINK. G. Examination of scale
effects during field tests on model bored piles in overconsolidated sand.Proceedings of the International Conference on Physical Modelling in Geotechnical Engineering, Hong Kong, 2006, Vol. 2, pp. 1335–1342. 16. DASB.M.Advanced Soil Mechanics. McGraw-Hill, New
York, 1983.
17. ATKINSONJ. Non-linear soil stiffness in routine design. Ge´otechnique, 2000,50, No. 5, 487–508.
18. LEHANEB. M., DOHERTYJ. P. and SCHNEIDERJ. A. Settlement
prediction for footings on sand. Keynote lecture.
Proceedings of the Conference on Small-strain Stiffness in Practice, Atlanta, 2008, 133–150.
19. BRIAUDJ.-L. and GIBBENSR. M.Large-scale Load Tests and Database of Spread Footings on Sand. Federal Highway Administration, 1997, publication No. FHWA-RD-97-068.
20. GAVINK.G.and O’KELLYB. C. Effect of friction fatigue on piles in dense sand.ASCE Journal of Geotechnical and Geoenvironmental Engineering,133, No. 1, 63–71. 21. KULHAWYF.H.and MAYNEP.W.Manual on Estimating Soil
Properties for Foundation Design. Electric Power Research Institute, Palo Alto, 1990, Report EL-6800.
22. PAPADOPULOUSB.P.Settlement of shallow foundations on cohesionless soils.ASCE Journal of Geotechnical Engineering, 1992,118, No. 3, 377–393.
23. GAVINK.G.and LEHANEB.M. Base load–displacement response of piles in sand.Canadian Geotechnical Journal, 2007,44, No. 9, 1019–1052.
What do you think?
To comment on this paper, please email up to 500 words to the editor at journals@ice.org.uk