Abstract - This paper presents the simulation results and analysis related to the response of a microgrid system, specifically the generators inside the microgrid, towards an accidental overload condition that will require some load shedding action. A microgrid overload can occur due to various reasons ranging from poor load schedule, inadequate switching of circuits within the microgrid, outage of one or more generators inside the microgrid, illegal load connections by some low voltage consumers, etc. It was observed that among the main factors that determine the survival of the microgrid during its transition from the grid connected mode to the islanded mode of operation are the size and type of the load connected (passive or dynamic load), the length of time that the unexpected load is connected as well as the provision of speed and voltage regulators to the generators.
Index Terms - Load shedding, Distributed generation, Islanded operation mode, Microgrid systems.
I. INTRODUCTION
OWADAYS,the establishment of microgrid systems is regarded by the power industry as one of the alternatives to keep running not only critical loads but also provide electricity to some regular consumers during periods of prolonged interruptions (e.g. blackouts). Microgrid systems are the compelled choice in remote areas where it is difficult to provide power through the power system. The microgrid concept is not new; actually, in the early days of the power industry this was the kind of system established in the urban and industrial areas. The interconnection of systems to strengthen and form the network came years later. This was done to offer the system a high level of safety regarding possible faults; thus, cope with stability issues aside of allowing the surplus generation capacity in one area to be used elsewhere in the system.
Ironically, this kind of system networking may also lead to some major interruptions (due to cascading effect) like those that affected central, south and southeastern Brazil and all Paraguay in 2009, the northeastern part of the USA in 2003, and all Italy in 2003. Also, nearly 100 million people in Indonesia were affected by a huge blackout in 2005. The
Manuscript received October 17, 2012; revised November 27, 2012. R.L. Vasquez-Arnez is with FDTE (Foundation for the Technological Development of the Engineering Sciences), São Paulo (SP), 05615-010 ([email protected]).
D.S. Ramos is an associate professor at the Electric Power and Automation Engineering Dept., University of São Paulo, 05508-900 ([email protected]).
T.E. Del Carpio-Huayllas is with the Electric Power and Automation Engineering Dept, University of São Paulo, 05508-900 ([email protected]).
last major blackout occurred in India in 2012 leaving virtually inoperative the Northern, Eastern and Northeast part of the country. In the aftermath of these undesired events nearly all the affected systems set up independently a common action, the seek for some alternatives capable to diminish their impact among which the establishment of microgrid systems was also pointed out.
One of the key features of a microgrid is its ability to separate itself from the distribution utility (e.g. during unscheduled periods of interruption) in order to continue feeding its own islanded portion. This is not a simple task though, especially when taking into account the compelled operational procedures and protocols to be followed.
Another outstanding characteristic of a microgrid is that, provided an agreement with the grid, it can supply its surplus generation to the utility, for example, during peak periods of demand or whenever the microgrid has excess capacity.
Nonetheless, it can occur that during the transition from the grid connected mode to the islanded mode of operation, an excessive load (larger than the microgrid can uphold) could be connected to the microgrid.
This overloading condition can occur due to various reasons, namely: poor load schedule, inadequate switching of circuits within the microgrid, an upstream tripping of the utility circuit breaker that leaves part of its load connected to the microgrid, illegal load connections by some low voltage consumers, etc. Under this condition, the most common way to save the microgrid from a complete collapse is to shed part of the load connected. This action can help the fading generator become stable again ensuring its safe operation.
Some critics say that the application of load shedding at specific times during the 2003 major blackout in North America could have prevented the cascading outages that came after the initial tripping event.
Several interesting references addressing the load shedding issue in large systems were found. There may also be some other references having the same merit; however, due to space restrictions of this article it will not be possible to include them all.
Reference [1], for example, provides a comprehensive coverage on the load shedding issue, load restoration and generator protection schemes using underfrequency relays during abnormal frequency conditions.
In [2], an underfrequency protection program developed for a certain region in North America is presented. The program reportedly optimizes the system wide load shed schedule, checking also up its coordination with a steam turbine-generator underfrequency protection scheme.
In [3], a method for determining the maximum probable rates at which a power system frequency will decay,
Load Shedding Application within a Microgrid
to Secure its Islanded Mode of Operation
R.L. Vasquez-Arnez, Member, IAENG, D.S. Ramos, T.E. Del Carpio-Huayllas
following a disturbance, is presented. Such an analysis is chiefly directed to providing underfrequency protection for nuclear power plants. Reference [4], presents a summary on System Protection and Voltage Stability prepared by the IEEE Power System Relaying Committee. It describes the risk and mechanism of voltage collapse as well as suggests some operation, system upgrades and protection solutions to avoid such a condition.
In [5] the effect of the reduced frequency upon the capacity of a power plant, with special regard to cases with deficiency of generation, is presented. It is stated that on systems with a high percentage of motor load (such as pumping), a combination of frequency and voltage reduction may secure maximum load relief during an emergency. In [6]-[9] some methods dealing with underfrequency load shedding (UFLS) so as to avoid voltage instability and its further collapse are presented.
In [10] an optimal load shedding algorithm based on an economic criterion is developed. In [11], a strategy to shed an optimal number of loads in an islanded distribution system, using factors like the rate of change of frequency (RoCoF) and the customers’ willingness to pay during periods of outage to stabilize its frequency, is presented.
Finally, in [12] a scheme that combines frequency and voltage changes to shed loads is proposed. The premise behind this scheme is that in the last years, power systems have changed and yet no corresponding modification of the underfrequency load shedding schemes were made; thus, the load shedding procedure would still be based on the disconnection of pre-selected loads.
As can be seen, most of the above reviewed load shedding methods and strategies are directed to large systems, hence the need to develop a study on the excessive overloading effect on microgrid generators.
The microgrid current status and some of the challenges presently encountered by the microgrid technology, is presented in [13]. In [14] and [15] a microgrid islanding condition following a fault and its respective stability behaviour is investigated.
The load shedding alternative is applied once the system frequency starts to decay from its nominal operative value (50/60 Hz). It is well established that the load shedding procedure normally happens in two ways:
(a)Automatic load shedding; where the protection system usually initiates the automatic isolation of parts of the grid (could also be the case of the microgrid).
(b)Manual (or selective) load shedding; whose main characteristic is the availability of sufficient time (typically up to 30 min) to make the selective disconnections of the load.
Some studies suggest that the introduction of the smart grid technology may substantially diminish forced load shedding as consumers, warned by the smart meters and/or receiving dynamically the price information from intelligent devices, will take the most suitable decision (e.g. disconnecting unimportant loads), thus, reducing the load demand. The above technology can be useful mainly in cases of moderate overload conditions; thus, giving time to adjust the system in at least half an hour. According to [16] and [17], the two load shedding methods widely used are:
i) Traditional frequency drop with load percentage shed. Typically, the load shedding scheme can be done in 3 (and up to 6) steps [16]. For example, in a three-step method, the percentage of load shed would be:
Step f (Hz) (%) of load 1
2 3
59.3 58.9 58.5
10 15 as required to avoid going below 58.2 Hz
ii) Use of the rate of change of frequency (RoCoF) and load percentage shed. It evaluates the speed at which the frequency (df/dt) is declining. This enables characterizing the kind of contingency occurring in the system at various instants, thus, provides the system a most adequate load shedding scheme [17]. For example, regarding the above frequency drop of 59.3 Hz, the df/dt could be set at:
59.3 Hz ….. df/dt = 0.4 Hz/s …. 10% of total load. 59.3 Hz ….. df/dt = 1.0 Hz/s …. 25% of total load. 59.3 Hz ….. df/dt = 2.0 Hz/s …. 35% of total load. The above methods are commonly used by many distribution utilities. In the context of this paper, the entire load exceeding the normal power demand of the microgrid internal generation will be shed. This is done considering the inherent differences between the grid and a microgrid as in the latter case, for example, the inertia of the generation sources is much smaller. Generally, gen-sets have no overloading capability. Nevertheless, a brief analysis on what would be the percentage of load to be shed, if the above methods were used, will be included when appropriate.
II. MICROGRID LOAD SHEDDING APPLICATION The operation of a microgrid in an islanded mode can occur due to some disturbances (e.g. faults in the system) or due to pre-planned conditions (e.g. energy cost, system maintenance, etc.) This implies an immediate change in the power control of the microgrid generators as they directly pass to control the frequency of the islanded section.
Whenever power in the network is lost, the microgrid generators assigned to provide power to the intentionally islanded portion should be able to pick up and feed the load of the islanded system after the switch at the Point of Common Coupling (PCC) has opened. The generation sources referred herein can be any of the sources cited by the IEEE std. 1547-2003 [18]: PV arrays, wind turbines, fuel cells, microturbines, conventional diesel, gas-fired turbines, and energy storage technologies.
can be found in the available literature dealing with electric machines.
The wind generator is connected to the microgrid through a 2.4/0.38kV transformer. In practice, due to technical and economic reasons, most of the sources used in wind power schemes are asynchronous generators. One of the reasons has to do with its ability to operate at speeds different from the synchronous speed. However, in this study, it was chosen a synchronous generator due to its less dependency from an external source for providing reactive power.
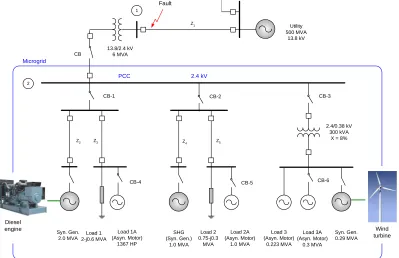
The loads fed by each generator, as well as the extra loads (equivalent motors) that simulate the overloading condition (Load 1A, Load 2A and Load 3A) are also shown in Fig. 1 (Load 1 and Load 2 were specified as constant power loads). These loads are connected to their respective generator through CB-4, CB-5 and CB-6. The complete system was
implemented in the EMTDC/PSCAD® program [19]. Some components, like the electrical generators and circuit breakers were taken from the software library, while others, like the diesel generator speed and voltage regulators, etc, were independently built and defined.
The sequence of the load shedding procedure is as follows: initially all loads are being fed by the utility when a fault (three-phase short-circuit) occurs at Bus causing the circuit-breaker (CB) to open. At this moment all three generators start running and taking up their respective loads. It is assumed that along with CB the other circuit breakers (i.e. CB1, CB2 and CB3) also trigger with the fault. This way, it will be avoided the condition of any of the generators from being carried away by another generator.
A. Diesel Generator Overloading
Among the control systems implemented on this generator are: a basic speed regulator, a constant mechanical power regulator (Fig. 2a) and a voltage regulator (Fig. 2b). As it will be shown later, a reasonably robust voltage and speed regulator may be useful in helping the machine cope with
events of this kind. Most of the synchronous generator(s) parameters like the direct and quadrature reactances as well as the transient and subtransient time constants (Xq, T′′do, X′′q, T′′qo, etc) were estimated according to [20]. The
machine starts as an ideal source (t=0.0 s) until it reaches its steady-state condition. At t=0.5 s the model enables the machine to pass from an ideal source to a non ideal machine, simultaneously the voltage regulator control is inserted in the generator. No cylinder misfiring condition was simulated.
At t=2.0 s, once the initialization transient reaches a stable condition, the dynamic model of the machine is enabled. From this moment on, the machine electromechanical equations start driving the generator, enabling the variation of the speed and mechanical torque.
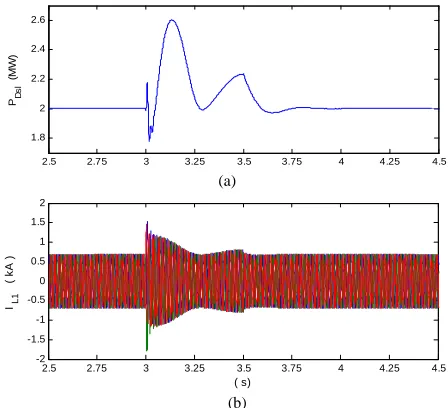
Initially, the diesel gen-set is feeding a linear load (L1=2.0+j0.6 MVA) when at t=3.0 s an equivalent induction
motor representing 50% of excess load (L1A = 1367 Hp) is
connected. The extra load (Load 1A) is switched off after 500 ms. It can be seen that at first the generator intends to take up this extra load (see P_Dsl in Fig. 3a, and the stator
current IL1 in Fig. 3b) failing subsequently in its attempt. The
instant the load shed occurs (opening of CB-4 at t=3.5 s) relieves the machine which quickly returns to its previous loading condition. The P-I (proportional-integral) constants define how quickly the machine will return to the pre-overloading condition. The terminal voltage (V_Dsl_rms)
shown in Fig. 4(a) drops instantly, upon which, following a few oscillations the voltage regulator carries it back to its previous operative value (1.03 pu). The gen-set frequency (F_Dsl) shown in Fig. 4(b) reaches a minimum value of 58.6
Hz. If the conventional load shedding strategies were to be applied (see Section Ii), the amount of load removed would be the highest specified. For example, according to [16], the percentage of load to be shed, regarding the minimum value of 58.6 Hz, would be above 15% (i.e. as required to avoid falling further the frequency). Now, according to [17], the percentage of load to be shed for this same case would be
CB
13.8/2.4 kV 6 MVA
Syn. Gen. 2.0 MVA
Load 1 2-j0.6 MVA
Load 1A (Asyn. Motor)
1367 HP
Microgrid
Z2 Z3
2
CB-4
Load 3 (Asyn. Motor)
0.223 MVA
Syn. Gen. 0.29 MVA 2.4/0.38 kV
300 kVA X = 8% Utility
500 MVA 13.8 kV Fault
Z1
1
Load 2 0.75-j0.3 MVA
Z4 Z5
PCC 2.4 kV
Diesel
engine Wind
turbine Load 2A
(Asyn. Motor) 1.0 MVA SHG
(Syn. Gen.) 1.0 MVA
CB-1 CB-2 CB-3
CB-5 CB-6
Load 3A (Asyn. Motor)
[image:3.595.108.507.254.512.2]0.3 MVA
35%, this is because the approximate RoCoF observed in Fig. 3(b) is about 12 Hz/s. In this case, shedding the entire extra load helped the frequency to get restored in about 1.0s.
P+jQ
(Load 1) 2 MW ; 0.6MVAr
B R K 2 BRK2 Tim ed Breaker Logic Open@t0 BRK5 Tim ed Breaker Logic Open@t0 BRK5 (Load 1A) Asyn mot 1367 HP
I
M
W S T
M o to r Ef_Dsl_filt Ef0 Vt If_Dsl W_Dsl S Te 3 A V Tm Tm0 Ef0 Tm w Ef If TM_Dsl * ENAB S / H in hold out N D N/D B -D + B + D + 1.0 A B Ctrl
Ctrl =1 ENAB 0 .0 I P Vrms1 Motor init W=s peed S=slip T=torque (a) B + D + Vref0 Vref Ef1 * 750.0 G
1 + sT1 1 + sT2 B
-D +
F
+ G
1 + sT1 1 + sT2
S2M Ef0 DIST A B Ctrl Ctrl = 1 0.0 0.01 S / H
in hold out Vrm s1 A B Ctrl Ctrl = 0 S2M Ef_Dsl G 1 + sT
Ef_Dsl_filt
(b)
Fig. 2. (a) Synchronous (diesel) generator model, (b) voltage regulator.
2.5 2.75 3 3.25 3.5 3.75 4 4.25 4.5
1.8 2 2.2 2.4 2.6
( s )
PD s l (M W ) (a)
2.5 2.75 3 3.25 3.5 3.75 4 4.25 4.5
-2 -1.5 -1 -0.5 0 0.5 1 1.5 2 ( s) I L1
( k A ) (b)
Fig. 3. (a) Diesel generator power, (b) Current at the stator.
B. Wind Generator Load Shed
The wind generator uses a simple PSS (Power System Stabilizer) model (Fig. 5). The wind turbine model is available in the library of the program used [19]. The main link between the generator and the wind turbine is the mechanical torque (Tm) which is set to operate at a constant
value. This is because the wind speed and the pitch angle of the wind turbine are also set to be constant (e.g. WSP=8 m/s
and 11.5°, respectively).
1.5 2 2.5 3 3.5 4 4.5 5 5.5
0.8 0.9 1 1.1
( s )
VD s l r m s ( k V ) (a)
1.5 2 2.5 3 3.5 4 4.5 5 5.5
58.5 59 59.5 60
( s )
F D s l ( H z ) (b)
Fig. 4. (a) Diesel generator terminal voltage, (b) Frequency.
1 1.0 CNT CNT * * * 60.0 2 Pi 3.0 Pole pairs N D N/D w2 A B Ctrl
Ctrl = 1
1.0
w2 A
B Ctrl
Ctrl = 1
1.0
A
B Ctrl
Ctrl = 1
Pw Wind Turbine Governor Wm Beta Pg
MOD 2 Type
TIME Tm Vw Beta W P Wind Turbine MOD 2 Type
Vw
P
[image:4.595.311.529.51.243.2]Vw Wind Source Mean
Fig. 5. Synchronous wind generator model used.
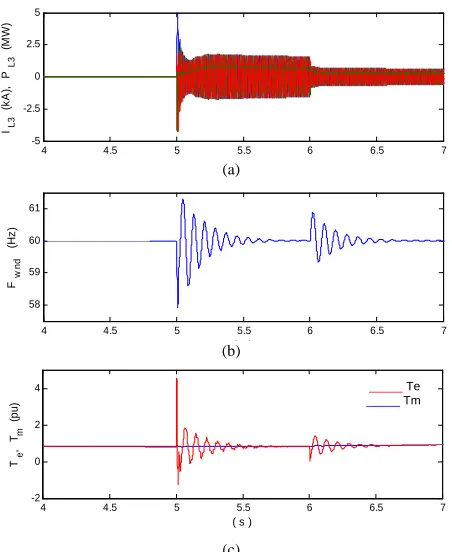
At t=1.0 s the wind generator equations in the program used are released. At t= 5.0 s both loads (L3=223.6 kVA and L3A = 300 kVA) are simultaneously connected (Fig 6a). At
this instant, the generator frequency (f_wnd) drops to about 58
Hz (Fig. 6b).
Again, if the frequency drop and RoCoF methods were applied, the percentage of load to be shed would be that exceeding the generator capacity. During this overloading period, the speed regulator damps also these oscillations. Although it can hardly be noticed, the machine power (PL3),
and the load current (IL3), start dropping steadily (Fig. 6a).
At t=6.0 s the equivalent extra load (Load 3A) is shed causing the frequency to rise up to about 60.75 Hz, though, becoming damped and stable in approximately 0.5 s. The electric torque (Te) has an opposite behaviour compared to
that of the frequency (Fig. 6c). Due to the conditions specified in the model, the mechanical torque (Tm) remains
constant at all times.
C. Small Hydro-Generator (SHG) Load Shed
The machine dynamics previously described in Case A (i.e. the diesel generator model) also apply here. The passive load and the unexpected load (equivalent motor), is shown in Fig. 7.
Speed regulator Constant mech. power
[image:4.595.303.542.58.471.2] [image:4.595.44.291.93.409.2] [image:4.595.303.544.263.469.2] [image:4.595.55.279.438.642.2]4 4.5 5 5.5 6 6.5 7 -5
-2.5 0 2.5 5
( s ) I L
3
(k
A
),
PL
3
(M
W
)
(a)
4 4.5 5 5.5 6 6.5 7
58 59 60 61
( s ) Fw
n
d
(
H
z
)
(b)
4 4.5 5 5.5 6 6.5 7
-2 0 2 4
( s ) Te
,
Tm
(p
u
)
(c)
Fig. 6. Wind generator: (a) Total load connected, (b) Frequency, (c) Electric and mechanical torques.
w
Wref z0 z
Hydro Gov 1
w Tm
Wref z
zi Hydro Tur 1
VT IT 3 If Ef Ef0
Vref
Exciter_(AC1A) Vref0
S2M_2
S / H in
hold out
1.0
Tmstdy TM
IF
E
F
W
S Te
3
A V
Tm
Tm0 Ef0
Tm w Ef If
(Load 4) 0.75 MW-0.3 MVAr
B
R
K
4
BRK4
Timed Breaker Logic Open@t0
BRK6
Timed Breaker Logic Open@t0
BRK6
Pn = 1.0 MVA
[image:5.595.53.279.55.331.2]P+jQ
Fig. 7. Small hydro-generator model used.
In this case, two consequences of the load shed procedure were considered.
i) Successful disconnection of the extra load
It can be observed (Fig. 8a) that at t=2.5 s the generator is running at its nominal frequency (F_hydr) with an initial load
(L4=0.75+j0.3 MVA). Then, at t=3.0s, the extra load (i.e. L4A=1.0 MVA) is connected. The output power in the
generator (PL4) rises up immediately, though, failing to take
up this load until at t=3.5 s the extra load is shed. The effect of the voltage regulator (V_rms) in restoring the terminal
voltage can be seen in Fig. 8(b). Notice also how after the disconnection of the extra load the machine frequency
(F_hydr) returns to its normal value not before facing some
low frequency oscillations (Fig. 9a). The electrical and mechanical torque oscillation (T_elt and Tmech) and their
subsequent damping are shown in Fig. 9(b).
2.5 2.75 3 3.25 3.5 3.75 4 4.25 4.5
0 0.5 1 1.5 2
( s )
P
o
u
t
(
M
W
)
(a)
2.5 2.75 3 3.25 3.5 3.75 4 4.25 4.5
0.2 0.4 0.6 0.8 1 1.2
( s )
V
rm
s
(p
u
)
(b)
Fig. 8. (a) Output power of the SHG, (b) Terminal voltage.
0 10 20 30 40 50
58 59 60 61 62
( s ) Fh
y
d
r
(H
z
)
(a)
0 10 20 30 40 50
0.2 0.6 1 1.4 1.8 1.8
( s ) Te
lt
,
Tm
e
c
(p
u
)
(b)
Fig. 9. (a) Frequency and, (b) electric and mechanical torques of the SHG.
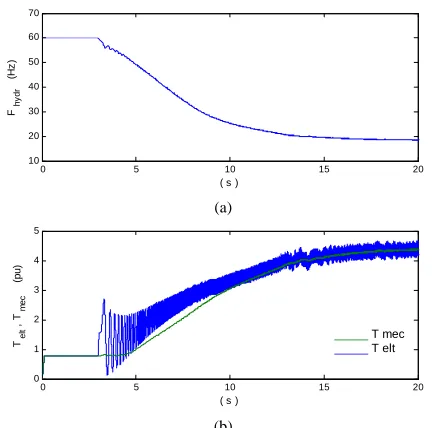
ii) Failure to disconnect the excessive (extra) load
Failure in disconnecting the extra load will inevitably lead to a steady collapse of the SHG generator. In this case, the switch CB-7 that connects the equivalent extra asynchronous motor is not opened. Similarly to the previous case, the generator initially intends to take up the extra load (Pout in
Fig. 10a); however, due to its limited capacity it quickly drops to zero. Notice that despite the machine has a speed regulator, in situations like this, there can not be any speed regulator (or power/frequency control) able to cope with such a condition.
A similar falling pattern after the accidental connection of the extra load can be observed in the case of the SHG terminal voltage (V_rms in Fig. 10b). Note that nothing was
mentioned about the overcurrent protection system which would trip before the current reaches a certain specified threshold.
The steady drop of the SHG frequency (Fig. 11a) towards the excess load is more evident. Finally, both electrical and mechanical torques (T_elt and Tmech in Fig. 11b) start up a
_____ Te _____ Tm
[image:5.595.315.532.103.305.2] [image:5.595.310.534.325.527.2] [image:5.595.46.288.366.602.2]continuous rise in an effort to fulfill the unexpected load demand.
2.4 2.6 2.8 3 3.2 3.4 3.6
-0.5 0 0.5 1 1.5 2 2.5 3
( s )
P
o
u
t
(MW
)
(a)
2.4 2.6 2.8 3 3.2 3.4 3.6
0 0.2 0.4 0.6 0.8 1 1.2
( s )
V
rm
s
(p
u
)
(b)
Fig. 10. (a) Output power and (b) terminal voltage of the SHG.
0 5 10 15 20
10 20 30 40 50 60 70
( s )
Fh
y
d
r
(
H
z
)
(a)
0 5 10 15 20
0 1 2 3 4 5
( s )
Te
lt
,
T
m
e
c
(p
u
)
(b)
Fig. 11. (a) Frequency, (b) electric and mechanical torques of the SHG.
III. CONCLUSIONS
Microgrid systems are currently regarded as one of the alternatives to diminish the effects of network interruptions. A quick load shed applied to such a microgrid systems upon which large unforeseen loads are connected is vital for keeping the generators running normally. Provided their respective voltage and speed regulators all three generators resumed their operation and frequency stabilization after the extra load was shed. On this regard, the article presents the main control components of a gen-set and the various situations the microgrid generators can face during the transition from the grid connected to the islanded mode of operation.
Also, from the simulations conducted, it can be stated that the size and length of time taken to shed the extra load connected are important factors that can lead to the collapse of the generator and the microgrid itself. Particularly, the size of the extra load accidentally connected will determine the frequency drop; thus, the extent with which the speed regulator will respond.
REFERENCES
[1] W.C. New (ed.), J. Berdy, P.G. Brown, L.E. Goff, “Load Shedding, Load Restoration, and Generator Protection Using Solid-State and Electromechanical Underfrequency Relays,” General Electric Co. Publication GET-6449. Available: http://store.gedigitalenergy.com/ FAQ/Docum ents/489/GET-6449.pdf
[2] C. R. Rowland, D. W. Smaha, J. W. Pope, “Coordination of Load Conservation with Turbine-Generator Underfrequency Protection,”
IEEE Transaction on Power Apparatus and Systems, Vol. 99, No. 3,
May/June 1980.
[3] M.S. Baldwin, H.S. Schenkel, “Determination of Frequency Decay Rates During Periods of Generation Deficiency,” IEEE Transactions
on Power Apparatus and Systems, Vol. 95, No. 1, Jan/Feb 1976, pp.
26-36.
[4] M. Begovic, et al, “System Protection and Voltage Stability,” IEEE
Transactions on Power Delivery, Vol. 10, No. 2, April 1995, pp
631-637.
[5] H.A. Bauman, G.R. Hahn, C.N. Metcalf, “The Effect of Frequency Reduction on Plant Capacity and on System Operation,” AIEE
Transactions on Power Apparatus and Systems, Vol PAS-74, Feb.
1955. pp. 1632-1637.
[6] S.A. Niremberg, D.A. McInnis, K.D. Sparks, “Fast Acting Load Shedding,” IEEE Trans. on Power Systems, Vol 7, No. 2, May 1992, pp 873-877.
[7] T.Q. Tuan, J. Fandino, N. Hadjsaid, J.C. Sabonnadiere, H. Vu, “Emergency Load Shedding to Avoid Risks of Voltage Instability Using Indicators,” IEEE Trans. on Power Systems, Vol. 9, No. 1, Feb. 1994, pp. 341-351.
[8] V. V. Terzija, “Adaptive under-frequency load shedding based on the magnitude of the disturbance estimation,” IEEE Trans. Power
Systems, Vol. 21, No. 3, Aug. 2006. pp. 1260–1266.
[9] X. Xiong and W. Li, “A new under-frequency load shedding scheme considering load frequency characteristics,” in Proc. Int. Conf. Power
System Technology, Oct. 2006, pp. 1–4.
[10] D.K. Singh, R. Shekhar, P.K. Kalra, “Optimal Load Shedding: An economic approach,” in: TENCON 2010 - 2010 IEEE Region 10
Conference, 21-24 Nov. 2010, Fukuoka, pp. 636 - 639.
[11] P. Mahat, C. Zhe, B. Bak-Jensen, "Underfrequency Load Shedding for an Islanded Distribution System With Distributed Generators".
IEEE Transactions on Power Delivery, Vol. 25, No. 2, Apr. 2010.
pp. 911 - 918.
[12] D. Prasetijo, W. R. Lachs, and D. Sutanto, “A New Load Shedding Scheme for Limiting Underfrequency,” IEEE Trans. on Power
Systems, Vol. 9, No. 3, Aug. 1994. pp. 1371–1378.
[13] T.E. Del Carpio Huayllas, D.S. Ramos, R.L. Vasquez-Arnez, “Microgrid systems: Current status and challenges.” In: Proc. 2010
IEEE/PES Transmission and Distribution Conference and Exposition: Latin America (T&D-LA), 8-10 Nov. 2010, São Paulo.
pp. 7 – 12.
[14] A. H. Kasem Alaboudy, H.H. Zeineldin, L. Kirtley, “Microgrid Stability Characterization Subsequent to Fault-Triggered Islanding Incidents,” IEEE Transactions on Power Delivery, Vol. 27, No. 2, pp. 658 – 669, 2012.
[15] T.E. Del Carpio Huayllas, D.S Ramos, R.L. Vasquez-Arnez, “Microgrid Transition to Islanded Modes: Conceptual Background and Simulation Procedures Aimed at Assessing its Dynamic Performance,” in Proc. 2012 IEEE Power & Energy Society
Transmission and Distribution Conference and Exposition, Orlando,
FL, 7-10 May, 2012.
[16] IEEE Guide for Abnormal Frequency Protection for Power Generating Plants, ANSI/IEEE C37.106-1987, pp. 1-26.
[17] B. Delfino, S. Massucco, A. Morini, P. Scalera, F. Silvestro, "Implementation and Comparison of Different Under Frequency Load-Shedding Schemes," in: Power Engineering Society Summer
Meeting, Vol. 1, pp. 308-312, 2001.
[18] IEEE Standard for Interconnecting Distributed Resources with Electric Power Systems, IEEE Std 1547.2-2008. pp. 1 - 207.
[19] PSCAD/EMTDC®, Manitoba HVDC Research Center, v.4.3.1.0 (x4), 2010.
[20] M. S. Sarma, Electric Machines: Steady-State Theory and Dynamic Performance, Boston, MA, PWS Pub. Co., 2nd Ed., 1994.
[image:6.595.54.271.76.287.2] [image:6.595.57.273.312.526.2]