ISSN Print: 1945-3094
DOI: 10.4236/jwarp.2019.117054 Jul. 30, 2019 886 Journal of Water Resource and Protection
Evolution and Prospect of Dakar Drinking
Water Consumption
Ndiouga Camara
1*, Ibrahima Mbaye
2, Baba Ngom
3, Déthié Sarr
1, Séni Tamba
31University of Thiès, Engineering Science Department, Thiès, Senegal 2University of Thiès, Science and Technique Department, Thiès, Senegal 3Polytechnic School of Thiès, Thiès, Senegal
Abstract
In Dakar, there has been a considerable deficit in the drinking water supply for more than a decade. The distribution is poorly controlled in this region. And yet, there is no lack of supply sources or solutions. With a drinking wa-ter deficit of 300,000 m3/d to fill, the State of Senegal proposed two (02)
op-tions: firstly, the construction of a second Plan at Keur Momar Sarr on the Guiers Lake with a capacity of 75,000 m3/d coupled with a third pipeline
be-tween Keur Momar Sarr and Thiès (KMS3); secondly, the construction of a seawater desalination Plant with a capacity of 75,000 m3/d. In this article, we
studied the evolution of the drinking water consumption and the statistical data relating to population growth, which is the key element in the drinking water consumption evolution in Dakar. We were able to extract the equations from the trend curves that made it possible to predict a population growth. The results obtained with the equations and the curves show that the real needs for drinking water in Dakar are proportional to population growth.
Keywords
Drinking Water, Dakar, Evolution, Perspective, Consumption, Needs
1. Introduction
Senegal, a country of West Africa, is divided into fourteen (14) regions. It is lo-cated in the intertropical zone and is bordered on the north by Mauritania, on the south by Guinea Bissau and the Republic of Guinea; to the East by Mali and to the West by the Atlantic Ocean. The capital, Dakar concentrates a bulk of economic, political and administrative activities, and is facing an exponential demographic growth [1].
How to cite this paper: Camara, N., Mbaye, I., Ngom, B., Sarr, D. and Tamba, S. (2019) Evolution and Prospect of Dakar Drinking Water Consumption. Journal of Water Resource and Protection, 11, 886-895. https://doi.org/10.4236/jwarp.2019.117054
Received: May 17, 2019 Accepted: July 27, 2019 Published: July 30, 2019
Copyright © 2019 by author(s) and Scientific Research Publishing Inc. This work is licensed under the Creative Commons Attribution International License (CC BY 4.0).
DOI: 10.4236/jwarp.2019.117054 887 Journal of Water Resource and Protection Dakar is characterized by a high human density. 23.2% of the Senegalese pop-ulation live on 0.3% of the national territory. That corresponds to 3.2 million inhabitants in the last census carried out in 2013 [2]. For a long time, the drink-ing water supply system in Dakar has been facdrink-ing increasdrink-ing needs [3].
In fact, Dakar alone consumes 70% of the drinking water production on the whole enclosed area entrusted to the National Water Company of Senegal (SONES) by the government [1]. This high flow is explained by population growth, the development of economic activities and the extension of the city to the new urban poles of Diamniadio, Lac Rose and Rufisque. All those factors re-sulted in a daily deficit of 300,000 m3/d [4].
Thus, the state of Senegal committed to a major emergency program to solve the water problem in Dakar. It is a special program for drinking water supply in Dakar, launched pending the construction of the third Keur Momar SARR Plant and the commissioning of the seawater desalination plant. It consists of twen-ty-five (25) drillings and for the time being, twenty (20) are finalized, completed and delivered with an additional flow of twenty thousand cubic meters per day (20,000 m3/day).
Another measure taken by the state is the disconnection of Pout market gar-deners who use drinking water estimated between 10 and 12 thousand m3/day,
which corresponds to the consumption needs of a city like Saint Louis [5]. It is in this perspective that this article seeks to define a set of actions for improving the drinking water supply with requirements that guarantee the profitability and balance of the sub-sector of urban water supply. We will establish the equations, giving the real increase of the population per area, according to the trend curves; in order to have a better precision of the population growth relative to the drinking water consumption.
The current research consists of two fundamental axes: - The diagnosis of the current state of the infrastructures;
- The assessment of past and current water needs as well as the resources to reach a reliable outlook for the evolution of drinking water consumption in Dakar.
For such studies, it is very important to first use field data to exploit existing plans and to outline the drinking water supply sources.
This work will follow up and take into account programs, recommendations and conclusions from previous studies.
2. Materials and Methods
2.1. Data Acquisition
These are the digital plans of the SDE water system and of the consumption data from 2007 to 2009.
ac-DOI: 10.4236/jwarp.2019.117054 888 Journal of Water Resource and Protection tivity reports from SONES and SDE and inventories of the infrastructure fi-nanced by the regional departments of the SDE.
These data are of paramount importance in the development of the water needs and resources review and the diagnosis of existing facilities [6].
2.2. Treatment and Analysis (Numerical Statistics) of the Data
The region of Dakar is composed of four (4) counties (Figure 1).The analysis and treatment of digital data were facilitated by the Excel soft-ware which allowed us to draw figures and curves; which will make it possible to extract the drinking water consumption evolution equations of the region of Dakar.
The distribution and density of its population per county are shown in Figure 2.
For the situation of water supply sources, “Senegalaise des Eaux” (SDE) is linked to the State of Senegal by a contract and provides drinking water to pop-ulations in urban and peri-urban areas. It has eleven (11) regional management centres whereas the Dakar region has three departments (03) including 14 units of this study as shown in Table 1[4].
2.2.1. The Regional Management of Dakar 1
The main drinking water supply sources of these units are constituted of Thiès reservoirs upstream via ALG pipelines [7]. The water consumption in 2009 of these units is estimated at: 2,604,700 m3 for Plateau Médina; 2,558,768
[image:3.595.209.538.440.711.2]m3 for Grand Dakar; 2,446,720 m3 for Sicap Liberté; 4,347,748 m3 for Yoff and
DOI: 10.4236/jwarp.2019.117054 889 Journal of Water Resource and Protection
Figure 2. Distribution of Dakar regional population by department in 2013. Source:
ANSD 2015.
Table 1. Distribution of the 14 units in the different Regional Management (RD).
Regional Management Attached Units Units in the Regional Management
DAKAR 1 Grand Dakar, Liberté, Front de Terre, Grand Yoff, Plateau 05
DAKAR 2 Guédiawaye 1, Guédiawaye 2, Pikine, Parcelles, Thiaroye 05
RUFISQUE Rufisque, Bambilor, Bargny, Sébikotane 04
3,182,007 m3 for Front de Terre [8]. In the last census carried out in 2002, the
population of Dakar 1 is estimated at 221,438 inhabitants for Plateau Médina with a 1.6% annual rate of growth; 129,566 inhabitants for Grand Dakar with a 1.9% annual rate of growth; 103,417 inhabitants for Sicap Liberté with a 1.5% annual rate of growth; 182,073 inhabitants for Yoff with a 3.4% annual rate of growth and 140,952 inhabitants for Front de Terre with a 1.7% annual rate of growth [9].
2.2.2. The Regional Management of Dakar 2
The Regional Management of Dakar 2 provides water services in the suburbs of Dakar. The estimated water consumption of these units is 1,540,289 m3 for
Guédiawaye 1; 3,175,570 m3 for the Parcelles Assainies; 5,466,938 m3 for
Thia-roye; 1,490,756 m3 for Pikine and 1,683,378 m3 for Guédiawaye 2 [4] [8]. The
[image:4.595.207.539.350.447.2]DOI: 10.4236/jwarp.2019.117054 890 Journal of Water Resource and Protection annual rate of growth [9].
2.2.3. The Regional Directorate of Rufisque
The water supply sources of these units are the same as those of Dakar 1 with the exception of B Point and Mamelles drillings. The water consumption of the Ru-fisque units in 2009 is: 3,854,336 m3 for Rufisque; 441,502 m3 for Bambilor;
877,409 m3 for Bargny and 1,436,271 m3 for Sébikotane [4]. The population of
the Rufisque units, according to the figures of the last 2002 census, is estimated at 145,282 inhabitants for Rufisque with a 2.5% annual rate of growth; 43,015 inhabitants for Bambilor with a 4.5% rate of growth; 36,516 inhabitants for Bargny with a 2.5% annual growth rate and 28,582 inhabitants for Sébikotane with a 2.5% annual growth rate [9]. The Bargny, Sébikotane and Bambilor Units feed polarized localities and villages such as Sendou, Toubab Dialaw, Yene, Di-amniadio, Dougar, etc.
2.3. Population and Drinking Water Needs Assessment
The drinking water needs assessment will be based on the Millennium Devel-opment Goals (MDGs). The targets of service rate in urban units are 100% (% of population); 100% for Private water connections (BP) and 0% for Standpipes (BF).
For the Privatewater connections (BP), the population’s consumption needs are 55 liters/pers/day and for the FF, the population’s consumption needs are 25 li-ters/pers/day [7]. The daily peak coefficient is equal to 1.1 or 1.3 in the following cases: small units 1.10 (pop < 100,000 inhabitants) and large units 1.30 (pop > 100,000 inhabitants). The hourly peak coefficient is 2 or 2.2 in the following cases: small units 2 (pop < 100,000) and large units 2.2 (pop > 100,000).
For the future population estimation, a Polynomial projection based on a cor-relation coefficient of 1 was used for the different units [9].
In this context, it is important to know what would be the most appropriate method for Dakar region.
The needs were estimated as follows: Total domestic consumption (Cdtot);
Consumption for special connections (BP): future population ConsBP.
ConsBP Pop dBP= ×τ ×ConsSpBP (1)
With:
Pop: Total population in 2018;
dBP: MDG desertification rate for the BP;
SpBP Cons: Specific Consumption (l/d/hbt) for BP.
ConsBF Pop dBF= ×τ ×ConsSpBF (2)
With:
Pop: Total population in 2018; dBF: MDG desertion rate for the BF;
DOI: 10.4236/jwarp.2019.117054 891 Journal of Water Resource and Protection Cdtot=ConsBP+ConsBF (3) Public buildings and market garden consumption (Consep)
Based on the 2009 SDE consumption, analyses were made to determine the ratio (consumption of public buildings is equal to 16% of annual consumption. And the market gardening consumption is estimated at 12,000 m3/day) [5].
This ratio will be used for future estimations: Total industry consumption (Consi)
Based on the 2009 SDE’s consumption, analyses were made to determine the ratio which is estimated at 11% of annual consumption (total industry consump-tion/total consumption).
This ratio will be used for future estimations. Total unit consumption (Constot)
Constot Cd= tot Cons+ ep+Consi (4)
Daily needs with leaks (Bj)
(
Constot)
Bj= η (5)
With:
Constot: Total consumption of the center; η: Network performance;
Daily Peak needs (Bpj).
Bpj Bj Cp= + (6) With:
Bj: Daily needs with leakage; cp: Daily peak coefficient;
The Cph hourly peak coefficient of 2 or 2.2 is established as follows: small units (pop < 100,000)→2 and a large one (pop ≥ 100,000)→2.2.
The values above come from the formula:
0,5 2,5 1.5
ph
Q
Q
= + (7)
Thus the hourly peak flow (Qph) is given by the formula:
ph ph pi
Q =C ×Q (8)
With Qpj, the daily peak flow.
3. Results and Discussions
According to the annual drinking water consumption curve in Dakar, there is an increase throughout the Region (Figure 3).
The counties of Pikine and Dakar are more populated with each 37% of the population of the region (Figure 2) [10]. Proportionally, we note that the evolu-tion of consumpevolu-tion is more pronounced [7][9].
DOI: 10.4236/jwarp.2019.117054 892 Journal of Water Resource and Protection
Figure 3. Dakar Region Annual Consumption from 1996 to 2006. Source: DGRPE 2010.
infrastructures they provide are not only a real attraction but also a demographic amplifier because of their very varied numbers and functions. Special attention must therefore be paid to the demographic evolution of Rufisque county (Figure 4) [12][13].
Figure 4 shows that since 2004, Rufisque knows a considerable demographic evolution. The analysis of this evolution will make it possible to evaluate the level of involvement of the future population in drinking water consumption [14].
Since the end of the 1980s, the population has increased by 2.7% per year, due to the natural increase of the population, to reach 2,956,000 inhabitants in 2013. It is in the two most rural counties that growth has been the strongest between 2002 and 2013: Rufisque experienced population growth of +6% per year and Pikine, +4% per year [7].
In Rufisque, there are great disparities between the 12 municipalities. The three (3) municipalities of Rufisque concentrate the largest number of inhabi-tants (221,000), i.e. 45.1% of the population. Finally, three-quarters of the popu-lation of the Department (77.4%) live in urban areas [9].
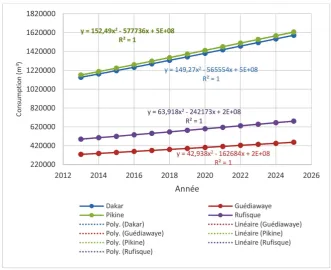
Eventually, drinking water consumption evolution projection of the various counties is represented in Figure 5.
The comparison of the logarithmic, polynomial, linear and exponential mathematical models allowed us to choose the one that gives more precision with a correlation coefficient that is equal to 1.
DOI: 10.4236/jwarp.2019.117054 893 Journal of Water Resource and Protection
Figure 4. Evolution of the population of Dakar between 2004 and 2013.
Figure 5. Comparison of the projection curves of the drinking water consumption of the
different departments.
to the quantity of consumption of water which is mainly proportional to the population [15].
[image:8.595.207.539.288.558.2]DOI: 10.4236/jwarp.2019.117054 894 Journal of Water Resource and Protection of the region, this approach gives the advantage of having a specific accuracy for each department, which gave us more accurate results. And this precision, rela-tive to the geographical position of the different departments in the region, will play a determining role on the flow distribution during the design of the drink-ing water supply network.
4. Conclusion
This study relevance and the results can be organized on three (3) levels. For re-search, the results of this article will catch attention both to the choice of the method and the need or not to take into account in the drinking water needs es-timation, some consumers in the process of disappearance such as agricultural spaces, because of galloping urbanization. The parameters that determine water consumption at the city level are poorly known and few actors were interested in it when consumption was increasing. The actors have become increasingly aware that the demand of drinking water is a complex function, depending on many factors. In agreement on this subject, we can say that the mastery of the main actors, but also the careful estimation of the needs for drinking water, must be at the heart of the research work. And this is justified by the fact that the parame-ters on which drinking water consumption depends are not only difficult to fol-low, but they are in perpetual variation as well. Therefore, the factors identified by the statistical studies must be contextualised, redirected and adapted accord-ing to the study framework because, household equipments such as the eco-nomic dishwashers and washing machines, the ecoeco-nomic sprinkle systems, re-main very poorly developed in Senegal. But overnight, we can always expect abrupt changes in the factors influencing drinking water consumption.
Conflicts of Interest
The authors declare no conflicts of interest regarding the publication of this pa-per.
References
[1] Béture-Sétane (1988) Dakar Water Supply Reinforcement.
[2] Faye, S. (1995) Hydrodynamic Modeling of Aquifers of the North Coast between Kayar and Saint-Louis. The Impact of Future Withdrawals in Connection with the Water Supply in Dakar and Its Surroundings. Dakar.
[3] Faye, S. (1998) Modeling the Aquifer’s Hydrodynamic Functioning of the Northern Coast of Senegal. Simulation of Additional Samples to Reduce the Deficit of Drink-ing Water Distribution in the Dakar Region. BRGM Hydrogéologie, 13-22. [4] SONES (2012) Hydrochemical Study of the Quaternary Sand Table in Dakar Area. [5] SONES (2018) Dakar Special Drinking Water Supply Program.
[6] COWI-Polyconsult (2009) Control of the Dakar and Subsurbs Production Facilities. [7] DGPRE (2012) Basic Data, Resource Needs Assessment and Diagnosis of Existing
Facilities.
DOI: 10.4236/jwarp.2019.117054 895 Journal of Water Resource and Protection
[9] ANSD/RGPHAE (2013) Renaming the Population of Senegal.
[10] ANSD (2015) Report on the Census of Population of the Dakar Region. [11] SDE/SONES (2013) Establishment of Master Plan, Phase 2 Report.
[12] SONES (2007) Mobilization of Alternative Water Resources for Irrigation in the Dakar Region. 79 p.
[13] Merlin, C. (2010) Drinking Water Supply Project for Cities in the Counties and Lit-toral Zone. Dakar.
[14] SETICO/CONCEPT (2013) Possible Variables for Water Resource Mobilization. [15] Merlin, C. (2010) Drinking Water Supply Project for the Cities of the Central and