Evaluation of Treated Municipal Wastewater
Quality for Irrigation
Abdul Hameed M. Jawad Alobaidy, Mukheled A. Al-Sameraiy, Abass J. Kadhem, Athmar Abdul Majeed
Environmental Research Center, University of Technology, Baghdad, Iraq.
Email: jawaddhy@yahoo.co.in, mukheled@yahoo.com, aik_mik@yahoo.com, athmarjaffer@yahoo.com
Received May 27th, 2010; revised June 24th, 2010; accepted June 27th, 2010.
ABSTRACT
Wastewater reuse is a useful tool in minimizing the amount of wastewater in the environment. Therefore, evaluation of the suitability of Al-Rustamiyah WWTP municipal treated wastewater for irrigation was made according to its compo-sition and the international irrigation water quality standards. In addition, to classify water quality and to evaluate its suitability for irrigation purposes, Sodium Adsorption Ratio (SAR), Soluble Sodium Percentage (SSP) and Residual Sodium Carbonate (RSC) were calculated following standard equations and found experimentally as (2.11), (35.67) and (–12.75) respectively. Plotting the values of conductivity (EC) and sodium absorption ratio (SAR) on the US salin-ity diagram illustrated that most of the samples fall in the field of C3-S1, indicating high salinsalin-ity and low sodium water which can be used for irrigation on almost all types of soil without danger of exchangeable sodium. Furthermore, the data indicate slight to moderate degree of restriction on the use of this treated wastewater in irrigation due to chloride hazard. RSC value is negative at all sampling sites, indicating that there is no complete precipitation of calcium and magnesium. Overall, the treated wastewater can be classified with few exceptions as suitable for irrigation use.
Keywords: Wastewater Reuse, Irrigation, Sodium Adsorption Ratio (SAR), Residual Sodium Carbonate (RSC), Soluble Sodium Percentage (SSP)
1. Introduction
In many arid and semi-arid countries water is becoming an increasingly scarce resource and planners are forced to consider any sources of water which might be used economically and effectively to promote further devel-opment. Thus, the availability of good-quality water for irrigation is threatened in many places [1] and irrigated agriculture faces the challenge of using less water, in many cases of poorer quality, to irrigate lands that pro-vide food for an expanding population.
The irrigation water needs can be met by using the available water more efficiently, but in many cases it will prove necessary to make increased use of municipal wastewaters [2]. The use of wastewater in agriculture has potential for both positive and negative environmental impacts [3]; with careful planning and management the use of wastewater in agriculture can be beneficial to the environment. However, the direct and indirect use of untreated wastewater in irrigated agriculture is increasing as a result of increasing global water scarcity, inadequate
and inappropriate wastewater treatment and disposal, increased food insecurity and escalating fertilizer costs [4-6]. Consequently, the reuse of wastewater for agricul-ture is highly encouraged [7,8] and it is a common prac-tice for many reasons, not least of which is nutrient value and environmental protection [1,9]. Irrigation with treated municipal wastewater is considered an environmentally sound wastewater disposal practice compared to its direct disposal to the surface or ground water bodies [3,8].
The amount of collected and treated wastewater is likely to increase significantly with population growth, rapid urbanization, and improvement of sanitation ser-vice coverage [14-16]. Hence, the use of treated waste-water in agriculture is one of the strategies adopted for increasing water supply in arid and semi arid countries [17,18]. Wastewater also has been used in agriculture for decades in many countries like India [15], Nepal [19], China [20], Spain [21] and Italy [22]. Under the condi-tions of increased freshwater scarcity at Arabian coun-tries like Saudi-Arabia [17], Kuwait [23,24] and Jordan [25,26], the reuse of wastewater in agriculture is receiv-ing great attention and increased recognition as a poten-tial water source.
It is generally accepted that wastewater use in agricul-ture is justified on agronomic and economic grounds but care must be taken to minimize adverse health and envi-ronmental impacts. However, in Iraq such usage of treated or untreated wastewater has not been widely in-vestigated and evaluated. In view of these facts, the pre-sent study was undertaken to characterize the secondary treated wastewater produced from Al-Rustamiyah WWTP and to evaluate its suitability for irrigation purposes as non-conventional water resources.
2. Materials and Methods
2.1. The Study Area
The Iraqi capital, Baghdad, has the highest level of sani-tation provision with about 80% of the population con-nected to sewer conveying sewage to treatment facilities. It is located in the Mesopotamian alluvial plain between latitudes 33°14’-33°25’ N and longitudes 44°31’-44°17’ E.
The general altitude ranges between 30.5 and 34.85 m a.s.l. Tigris River divides the city into a right (Karkh) and left (Risafa) sections (Figure 1). The area is character-ized by arid to semi arid climate with dry hot summers and cold winters; the mean annual rainfall is about 151.8 mm [27].
[image:2.595.308.537.83.269.2]The sewerage network that was established between 1960 and 1980 worked on the basis of the separate sys-tem, but a combined system has been adopted since 1980. In general, the wastewater quantities generated within the urban and rural areas of the mayoralty of Baghdad are estimated at 1,426,013 and 2,354 cubic meters per day respectively. However, the capacity of all wastewater treatment plants in the mayoralty of Baghdad was esti-mated at 789, 200 cubic meters per day, in which it rep- resents as 55% of the total capacity of wastewater. The secondary treated wastewater effluent for Iraqi (WWTP) was designed to produce an average of final effluent qual-ity of biological oxygen demand (BOD) and total sus-pended solids (TSS) as 20 and 30 mg/L, respectively to
Figure 1. Base map of Baghdad city.
meet the Iraqi National Standards set by the Regulation 25 of 1967. It reported that each day 500,000 cubic me-ters of raw sewage are discharged into Iraqi waterways [3].
In the Iraqi wastewater treatment plants, the existing pumping stations are also inefficient because of the lack of proper operation and maintenance and unavailability of spare parts. Despite this, most of the treated wastewa-ter in the area under study (Baghdad City) was mixed with freshwater from the Diyala River and used down-stream for unrestricted irrigation. Thus around 50% of the total treated wastewater generated could be reused [3].
2.2. Sampling and Analysis
Treated wastewater samples from Al-Rustamiyah WWTP were bimonthly collected during January 2009 to De-cember 2009 in stopper fitted polyethylene bottles that prewashed with dilute hydrochloric acid and then rinsed several times with the effluent sample before filling them to the required capacity. These samples were stored at a temperature below 4℃ prior to analysis in the laboratory. Procedures followed for analysis have been in accor-dance with the Standard methods for examination of wa-ter and wastewawa-ter [28]. The calibration for different chemical constituents was done by preparing low-level standard solutions using AR-grade chemicals and was periodically repeated to check the accuracy. Calcium (Ca2+) and Magnesium (Mg2+) were determined
titrimet-rically using standard EDTA, while Chloride (Cl–) was
determined by standard AgNO3 titration. Carbonate
(CO32-) and Bicarbonate (HCO3-) were determined by
titration with HCl. Sodium (Na+) and Potassium (K+)
were measured by flame photometry and Sulphate (SO42-)
de-termined by gravimetric method (dried at 103℃). Bio-logical Oxygen Demand (BOD) was determined by the 5 Day BOD test while Chemical Oxygen Demand (COD) was determined in the laboratory by the standard Open Reflux Method. Other tests such as Conductivity (EC) and pH were directly measured in situ using portable measuring devices (HANNA instruments, HI 9811, port- able pH-EC-TDS METER, Italy). Note that before each measurement, the pH meter was calibrated with reference buffer solution. Each analysis was carried out in triplicate and then the mean value was taken.
2.3. Indicators of Water Quality for Irrigation
Important irrigation water quality parameters include a number of specific properties of water relevant in rela-tion to the yield and quality of crops, maintenance of soil productivity and protection of the environment. These parameters mainly consist of certain physical and che- mical characteristics of water that are used in the evalua-tion of agricultural water quality. Numerous water qual-ity guidelines have been developed by many researchers for using water in irrigation under different condition [29-32]. However, the classification of US Salinity Laboratory (USSL) is used most commonly. Parameters such as EC, pH, Sodium Adsorption Ratio (SAR), ad-justed SAR (adj SAR) and the Exchangeable Sodium Percentage (ESP), Soluble Sodium Percentage (SSP) and Residual Sodium Carbonate (RSC) were used to assess the suitability of water for irrigation purposes. The crite-ria used to evaluate quality of wastewater for use in ag-riculture are listed in Table 1.
3. Results and Discussion
Descriptive statistics for all characteristics are presented in Table 2. An explanation of the observed characteris-tics follows in the following sections.
3.1. Hydrogen Ion Activity (pH)
The values of pH varied from 6.87 to 8.40 with an aver-age value of 7.70, which indicates that the treated mu-nicipal wastewater is slightly alkaline in nature. The normal pH range for irrigation water is from 6.5 to 8.4. Irrigation water with a pH outside the normal range may cause a nutritional imbalance or may contain a toxic ion [32,33].
3.2. Salinity Hazard
Electrical conductivity (EC) is the most important pa-rameter in determining the suitability of water for irriga-tion use and it is a good measurement of salinity hazard to crop as it reflects the TDS in wastewater. The most important negative effect on the environment caused by
agricultural wastewater is the increases in soil salinity, which if not controlled, can decrease productivity in long term [3]. EC values of experimental samples varied from 1910 to 2120 μS/cm (mean value = 1949.78 μS/cm) while TDS values varied from 1164 to 1350 mg/L (mean value = 1234.6 mg/L) indicating slight to moderate de-gree of restriction on the use of this wastewater in irriga-tion due to salt build-up in soils and its adverse effects on plant growth [32]. Furthermore, the results indicted also that this type of water can be used on the soils with re-stricted drainage. Special salinity control management with selection of good salt tolerant plants is required. However, irrigation water with conductivity in the range of 750-2250 μS/cm is permissible for irrigation and widely used. Satisfactory crop growth is obtained under good management and favorable drainage conditions but saline conditions will develop if leaching and drainage are inadequate [30]. It is clear that irrigation using saline water can add salt concentration to the soils and a prob-lem may be occurred due to the increase in concentration that is harmful to the crop or landscape. Therefore, it is necessary to combine the use of wastewater with prac-tices to control salinization, such as soil washing and appropriate soil drainage [3]. The primary effect of high EC reduces the osmotic activity of plants and thus inter-feres with the absorption of water and nutrients from the soil [34].
3.3. Sodium Hazard
Sodium content is the most troublesome of the major constituents and an important factor in irrigation water quality evaluation. Excessive sodium leads to develop-ment of an alkaline soil that can cause soil physical pro- blems and reducing soil permeability [35]. Furthermore, irrigation water containing large amounts of sodium is of special concern due to absorbed sodium by plant roots which is transported to leaves where it can accumulate and cause injury [36]. However, there is a restriction in use of overhead sprinklers method with water contained a high level of sodium salts because these salts can be absorbed directly by plant leaves and will produce harmful effects.
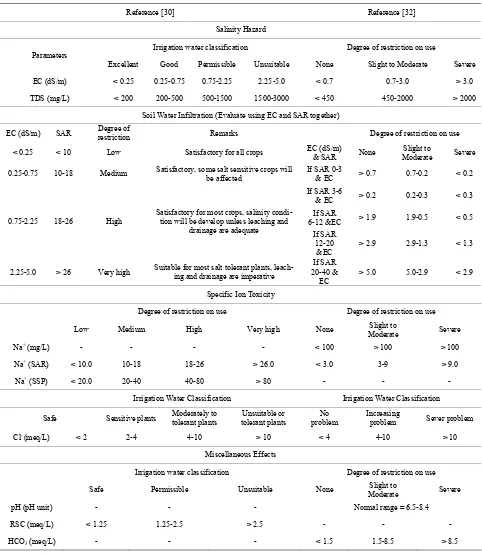
Table 1. Water quality classes for agricultural irrigation.
Reference [30] Reference [32]
Salinity Hazard
Irrigation water classification Degree of restriction on use Parameters
Excellent Good Permissible Unsuitable None Slight to Moderate Severe
EC (dS/m) < 0.25 0.25-0.75 0.75-2.25 2.25-5.0 < 0.7 0.7-3.0 > 3.0
TDS (mg/L) < 200 200-500 500-1500 1500-3000 < 450 450-2000 > 2000
Soil Water Infiltration (Evaluate using EC and SAR together)
EC (dS/m) SAR restriction Degree of Remarks Degree of restriction on use
< 0.25 < 10 Low Satisfactory for all crops EC (dS/m) & SAR None Moderate Slight to Severe
0.25-0.75 10-18 Medium Satisfactory, some salt sensitive crops will be affected If SAR 0-3 & EC > 0.7 0.7-0.2 < 0.2
If SAR 3-6
& EC > 0.2 0.2-0.3 < 0.3 If SAR
6-12 &EC > 1.9 1.9-0.5 < 0.5 0.75-2.25 18-26 High
Satisfactory for most crops, salinity condi-tion will be develop unless leaching and
drainage are adequate If SAR 12-20
&EC
> 2.9 2.9-1.3 < 1.3
2.25-5.0 > 26 Very high Suitable for most salt tolerant plants, leach-ing and drainage are imperative
If SAR 20-40 &
EC
> 5.0 5.0-2.9 < 2.9
Specific Ion Toxicity
Degree of restriction on use Degree of restriction on use
Low Medium High Very high None Moderate Slight to Severe
Na+ (mg/L) - - - - < 100 > 100 > 100
Na+ (SAR) < 10.0 10-18 18-26 > 26.0 < 3.0 3-9 > 9.0
Na+ (SSP) < 20.0 20-40 40-80 > 80 - - -
Irrigation Water Classification Irrigation Water Classification
Safe Sensitive plants Moderately to tolerant plants tolerant plants Unsuitable or problem No Increasing problem Sever problem
Cl- (meq/L) < 2 2-4 4-10 > 10 < 4 4-10 > 10
Miscellaneous Effects
Irrigation water classification Degree of restriction on use
Safe Permissible Unsuitable None Moderate Slight to Severe
pH (pH unit) - - - Normal range = 6.5-8.4
RSC (meq/L) < 1.25 1.25-2.5 > 2.5 - - -
HCO3 (meq/L) - - - < 1.5 1.5-8.5 > 8.5
Sodium hazard is usually expressed in terms of So-dium Adsorption Ratio (SAR) and it can be calculated from the ratio of sodium to calcium and magnesium. SAR is an important parameter for the determination of the suitability of irrigation water because it is responsible
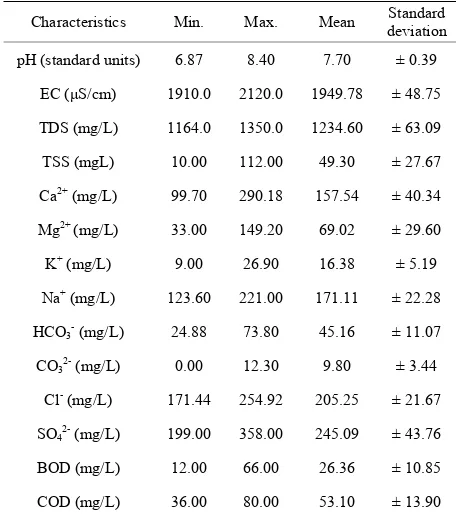
Table 2. Summary statistics of the analytical data.
Characteristics Min. Max. Mean deviationStandard
pH (standard units) 6.87 8.40 7.70 ± 0.39
EC (μS/cm) 1910.0 2120.0 1949.78 ± 48.75
TDS (mg/L) 1164.0 1350.0 1234.60 ± 63.09
TSS (mgL) 10.00 112.00 49.30 ± 27.67
Ca2+(mg/L) 99.70 290.18 157.54 ± 40.34
Mg2+ (mg/L) 33.00 149.20 69.02 ± 29.60
K+ (mg/L) 9.00 26.90 16.38 ± 5.19
Na+ (mg/L) 123.60 221.00 171.11 ± 22.28
HCO3- (mg/L) 24.88 73.80 45.16 ± 11.07
CO32- (mg/L) 0.00 12.30 9.80 ± 3.44
Cl- (mg/L) 171.44 254.92 205.25 ± 21.67
SO42- (mg/L) 199.00 358.00 245.09 ± 43.76
BOD (mg/L) 12.00 66.00 26.36 ± 10.85
COD (mg/L) 36.00 80.00 53.10 ± 13.90
pervious. It has been calculated as follows:
2 2
Na SAR =
Ca Mg
2
(1)
where: Na+, Ca2+ and Mg2+ are in meq/L.
For waters containing significant amounts of bicar-bonate, Bower and Maasland [40] proposed a modifica-tion in the old SAR procedure to include changes in soil water composition that are expected to result due to dis-solution/precipitation of lime in the soil upon irrigation. Therefore, the adjusted sodium adsorption ratio (adj SAR) is sometimes used [32], and it is an SAR value corrected to account for the removal of Ca2+ and Mg2+ by their
pre-cipitation with CO32- and HCO3- ions in the water added
[37]. It can be calculated as in reference [41] by using the following formula:
adj SAR = SAR 1 + 8.4 pHc (2)
where 8.4 is the approximate of a nonsodic saline soil in equilibrium with CaCO3 and is substituted for the pH of
water. This substitution reflects the high buffering capac-ity of calcareous soils. pHc is defined by:
2+ 2+
2 c
pHc = pK + pK + p Ca + Mg + pAlk (3) where p refers to the negative logarithm, K2 is the second
dissociation equilibrium constant of carbonic acid, Kc is
solubility equilibrium constant for calcite. Concentra-tions of Ca2+, Mg2+, CO
32- and HCO3- in meq/L.
The pHc can be calculated using the standard table given by reference [41] which related to the concentra-tion values from water analysis. This concept has been found very useful for predicting the effect of sodium hazard of irrigation water on soil properties. Values of pHc above 8.4 indicate tendency to dissolve lime from soil through which the water moves; values below 8.4 indicate tendency to precipitate lime from waters applied [32].
A new adj SAR method [42] is derived which adjusts the calcium concentration of the irrigation water to the expected equilibrium value and includes the effects of carbon dioxide CO2, carbonate (HCO3-) and of salinity
(EC) upon the calcium originally present in the applied water but now a part of the soil water. The new adjusted SAR is termed widely as adj RNa, and the equation is as follows:
2 2
x
Na adj RNa =
Ca Mg
2
(4)
where Cax2+, a modified calcium concentration value in
meq/L expected to remain in near surface soil water fol-lowing irrigation with water of given HCO3-/Ca2+ ratio
and EC available from the standard Tables [32].
The SAR value of the treated wastewater ranges from 1.43 to 3.19 (mean = 2.11), while adj SAR and adj RNa values range from 2.35 to 4.40 (mean = 3.12) and from 1.52 to 3.03 (mean = 2.03) respectively (Table 3). The comparison between SAR, adj SAR and adj RNa values and their standard values reflects water is suitable for irrigation.
[image:5.595.310.537.530.721.2]Total salt concentration of irrigation waters should not be used as single criteria to prevent it in irrigation use.
Table 3. Calculated irrigation quality characteristics.
Characteristics Min. Max. Mean deviation Standard
SAR 1.43 3.19 2.11 ± 0.43
adj SAR 2.35 4.40 3.12 ± 0.58
adj RNa 1.52 3.03 2.03 ± 0.36
SSP 21.38 50.82 35.67 ± 6.75
ESP (SAR) 0.84 3.34 1.82 ± 0.61
ESP (adj SAR) 2.16 4.97 3.25 ± 0.80
ESP (SAR RNa) 1.00 3.12 1.70 ± 0.51
pHc 7.63 8.14 7.90 ± 0.3
RSC –25.91 –7.07 –12.75 ± 4.002
Even water with high salt concentration can still be used for irrigation without endangering soil productivity. High sodium content common to recycle water can cause de-flocculating (breakdown) of soil clay particles, severely reducing soil aeration and water infiltration and percola-tion. In other words, soil permeability is reduced by irri-gation with water high in sodium [35,43]. It is therefore, the best measure of a water likely effect on soil perme-ability is the waters SAR considered together with its EC. In this respect, the US salinity diagram (Figure 2) which is based on the integrated effect of EC (salinity hazard) and SAR (alkalinity hazard), has been used to assess the water suitability for irrigation [30]. When the analytical data of EC and SAR plotted on the US salinity diagram, it is illustrated that most of the treated wastewater sam-ples fall in the class of C3-S1 indicating high salinity with low sodium water, which can be used for irrigation on almost all types of soil, with only a minimum risk of exchangeable sodium. This type of water can be suitable for plants having good salt tolerance but restricts its suitability for irrigation, especially in soils with restricted drainage [30,44]. Figure 3 shows the positive correlation between EC and SAR with a correlation coefficient (R2)
= 0.193. The lower values of R2 show that there is a
higher variation in the EC values.
3.4. Soluble Sodium Percentage (SSP)
It is also used to evaluate sodium hazard. The Soluble Sodium Percentage (SSP) was calculated as in reference [29] by the following equation:
2 2
Na 100 SSP =
Ca Mg Na K
(5)
where all the ions are expressed in meq/L.
Water with SSP greater than 60 percent may result in sodium accumulations that will cause a breakdown of the soil’s physical properties [45]. The calculated values of SSP varied from 21.38% to 50.82% (mean value = 35.67%) indicating moderate degree of restriction on the use of this wastewater in irrigation. When the concentra-tion of sodium ion is high in irrigaconcentra-tion water, Na+ ion
tends to be absorbed by clay particles, displacing Mg2+
and Ca2+ ions. This exchange process in soil reduces the
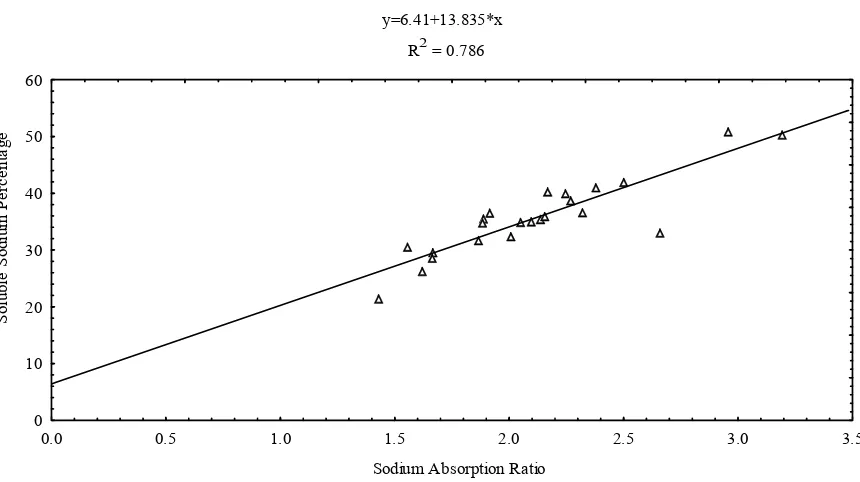
permeability and eventually results in soil with poor in-ternal drainage [32]. Figure 4 shows the positive correla-tion between SSP and SAR with a coefficient of 0.786. Irrigation with waters that have high concentrations of Na+ ion relative to divalent cations may cause an
accu-mulation of exchangeable Na+ on soil colloids.
Contin-ued uses of alkaline waters for irrigation in a closed sys-tem may have adverse effects on soil physical properties [46,47], deteriorate the soil and water resources of the region and affect the sustainability of crop production in the long run.
[image:6.595.78.520.467.701.2]It is reported that salinity and sodicity are the principal water quality concerns in irrigated areas receiving such water [48]. Saline-sodic irrigation water, coupled with limited rainfall and high evaporation, may increase soil sodicity significantly. In general, when sodium is an im-portant component of the salts, there can be a significant amount of adsorbed sodium making the soil sodic [31].
y=1845.184+49.462*x R2 = -0.193
Sodium Adsorption Ratio
C
ond
uc
tiv
ity
(
µ
S/
cm
)
1850 1900 1950 2000 2050 2100 2150
[image:7.595.79.517.89.324.2]0.0 0.5 1.0 1.5 2.0 2.5 3.0 3.5
Figure 3. Correlation between sodium adsorption ratio and conductivity.
y=6.41+13.835*x R2 = 0.786
Sodium Absorption Ratio
S
ol
ub
le
S
od
iu
m
P
er
ce
nt
ag
e
0 10 20 30 40 50 60
0.0 0.5 1.0 1.5 2.0 2.5 3.0 3.5
Figure 4. Correlation between sodium adsorption ratio and percentage sodium.
The ratio of the exchangeable Na+ to total
exchange-able cations (Exchangeexchange-able Sodium Percentage, ESP) is a good indicator for soil structure deterioration. Although, the ESP of 10-15% is generally accepted as a critical level, an ESP of 25% may have little effect on soil struc-ture in a sandy soil, whereas an ESP of 5% is considered high particularly in soils containing 2:1 clay minerals
like montmorillonite [49]. The ESP of soils can be pre-dicted quite well from the following the empirical rela-tionship [30]:
100 0.0126 0.01475SAR ESP =
1 0.0126 0.01475SAR
(6)
[image:7.595.84.514.359.600.2]in range of 0.84-3.34 SAR, 2.16-4.97 adj SAR and 1.0-3.12 SAR RNa as shown in Table 3. The ESP pre-dicted from adj SAR of treated wastewater was higher than those predicted from SAR and SAR RNa.
3.5. Chloride Hazard
The most common toxicity is from chloride (Cl-) in the
irrigation water. Cl- is not adsorbed or held back by soils,
therefore it moves readily with the soil-water, is taken up by the crop, moves in the transpiration stream, and ac-cumulates in the leaves. If the Cl- concentration in the
leaves exceeds the tolerance of the crop, injury symptoms develop such as leaf burn or drying of leaf tissue. Nor-mally, plant injury occurs first at the leaf tips (which is common for chloride toxicity), and progresses from the tip back along the edges as severity increases. Excessive necrosis (dead tissue) is often accompanied by early leaf drop or defoliation [33]. The obtained Cl- ion
concentra-tion of the samples varied from 171.44 to 254.92 mg/L (mean value = 205.25) representing slight to moderate degree of restriction on the use of this wastewater in irri-gation [32]. While, according to USSL classification of irrigation water, the effluent samples can be used for moderately tolerant plants [30]. Chemical analysis of plant tissue is commonly used to confirm chloride toxicity. The part of the plant generally used for analysis varies with the crop, depending upon which of the available interpretative values is being followed. However, for ir-rigated areas, the chloride uptake depends not only on the water quality but also on the soil chloride, controlled by the amount of leaching that has taken place and the ability of the crop to exclude chloride. Crop tolerances to chloride are not nearly so well documented as crop tolerances to salinity [32]. On the other hand, significant correlation was found between Na+ and Cl- of wastewater (R2 = 0.60),
suggesting that the common source of these ions is salt dissolution. The possible sources of these ions were an-thropogenic and natural.
3.6. Magnesium Hazard
Generally, Ca2+ and Mg2+ maintain a state of equilibrium
in most waters. Both Ca2+ and Mg2+ ions are associated
soil aggregation and friability, but they are also essential plant nutrients. High concentration of Ca2+ and Mg2+ ions
in irrigation water can increase soil pH, resulting in re-ducing of the availability of phosphorous [23]. Water con- taining Ca2+ and Mg2+ higher than 10 meq/L (200 mg/L)
cannot be used in agriculture [50]. The observed results show that 60% of the samples have exceeded 200 mg/L. High correlation was found between Ca2+ and Mg2+ of
wastewater (R2 = 0.68), suggesting that the common
source of these ions is carbonate dissolution.
Another indicator that can be used to specify the mag-nesium hazard (MH) is proposed by reference [51] for irrigation water as in the following formula:
2
2 2
Mg
MH = 100
Ca Mg
(7) where, Ca2+ and Mg2+ ions are expressed in meq/L.
If the value of MH is less than 50, then the water is safe and suitable for irrigation [50]. From the calculated value (Table 3), the MH values range between 7.97-56.53%, (mean = 39.86) and the treated wastewater can be classi-fied with few exception as suitable for irrigation use.
3.7. Residual Sodium Carbonate (RSC)
The excess sum of CO32- and HCO3- in wastewater over
the sum of Ca2+ and Mg2+ influences the unsuitability of
wastewater for irrigation. In water having high concen-tration of CO32- and HCO3-, there is tendency for Ca2+
and Mg2+ to precipitate as carbonates. To qualify this
effect, an experimental parameter termed as RSC [29] was used. It can be calculated as follows:
2
2 2
3 3
RSC CO HCO Ca Mg
(8)
All ion concentrations are reported in meq/l.
The water with high RSC has high pH and land irri-gated by such waters becomes infertile owing to deposi-tion of sodium carbonate as known from the black colour of the soil [29]. According to the USSL [30], RSC value less than 1.25 meq/L is safe for irrigation, a value be-tween 1.25 and 2.5 meq/L is of permissible quality and a value more than 2.5 meq/L is unsuitable for irrigation. The calculated RSC value (–12.75) show that all samples have RSC less than zero and are good suitable for irriga-tion purposes.
3.8. Other Related Characteristics
The oxygen demand arises from the biochemical degra-dation of organic materials, the oxidegra-dation of inorganic material such as sulphides and ferrous and possibly the oxidation of reduced from of nitrogen [28]. The BOD, COD and TSS values in the present study varied from12 to 66 mg/L, 36 to 80 mg/L and 10 to 112 mg/L, respec-tively. With few exceptions, the treated wastewater in this study area displayed higher values of BOD, COD and TSS. Calculated results highlight that the final efflu-ent produced from Al-Rustamiyah WWTP did not meet the Iraqi National Standards set by Regulation 25 of 1967. Ultimately, reconsideration of the WWTPs system and completed environmental impact assessment are needed.
4. Conclusions
that the treated wastewater of Baghdad City is slightly alkaline in nature. The US salinity diagram illustrates that most of the treated wastewater samples fall in the field of C3S1, indicating high salinity and low sodium water, which can be used for irrigation on almost all types of soil without danger of exchangeable sodium. Therefore, the sustainable use of treated wastewater in agriculture can be beneficial to the environment in such a way that minimizes the side effects on the quality of downstream water resources, but it requires the control of soil salinity at the field level.
Based on these results that proper management of wastewater irrigation and periodic monitoring of quality parameters are required to ensure successful, safe and long term reuse of wastewater for irrigation. It is recom-mended as a matter of high priority that treated wastewa-ter is considered and made a reliable alwastewa-ternative source in water resources management. Agricultural wastewater reuse can effectively contribute to fill the increasing gap between water demand and water availability particularly in semi-arid areas. In future, further work is needed to examine organic and toxic constituents in wastewater and more intensive sampling and studies to measure any change of chemical elements in wastewater, irrigated soil and plant.
5. Acknowledgements
Many thanks to Ministry of Higher Education and Scien-tific Research, Research and Development Office, with-out their financial support the work would have not been done.
REFERENCES
[1] G. Zulu, M. Toyota and S. Misawa, “Characteristics of Water Reuse and its Effects on Paddy Irrigation System Water Balance and the Riceland Ecosystem,” Agricultural Water Management, Vol. 31, No. 3, October 1996, pp.
269-283.
[2] J. D. Oster, “Irrigation with Poor Quality Water,” Agri-cultural Water Management, Vol. 25, No. 3, July 1994,
pp. 271-297.
[3] WHO, “A Regional Overview of Wastewater Manage-ment and Reuse in the Eastern Mediterranean Region,” World Health Organization, Regional Office for the East-ern Mediterranean Regional, California Environmental Health Association, 2005.
[4] C. A. Scott, N. I. Faruqui and L. Raschid-Sally, “Waste-water Use in Irrigated Agriculture: Confronting the Live-lihood and Environmental Realities,” CABI Publishing, Wallingford, 2004.
[5] M. Qadir, D. Wichelns, L. Raschid-Sally, P. S. Minhas, P. Drechsel, A. Bahri and P. McKornick, “Agricultural Use of Marginal Quality Water—Opportunities and Chal-lenges,” In: D. Molden, Ed., Water for Food, Water and
life: A Comprehensive Assessment of Water Management in Agriculture, Earthscan, London, 2007.
[6] B. Jimenez and T. Asano, “International Survey on Water Reuse,” International Water Association Publishing, Lon-don, 2008.
[7] S. S. Al-Salem, “Environmental Considerations for Waste- Water Reuse in Agriculture,” Water Science and Tech-nology, Vol. 33, No. 10-11, 1996, pp. 345-353.
[8] M. J. Mohammad and N. Mazahreh, “Changes in Soil Fertility Parameters in Response to Irrigation of Forage Crops with Secondary Treated Wastewater,” Communica-tions in Soil Science and Plant Analysis,Vol. 34, No. 9-
10, May 2003, pp. 1281-1294.
[9] L. S. McNeill, M. N. Almasri and N. Mizyed, “A Sus-tainable Approach for Reusing Treated Wastewater in Agricultural Irrigation in the West Bank–Palestine,” De-salination, Vol. 248, No. 1-3, 2009, pp. 315-321.
[10] H. Al-Hamaiedeh and M. Bino, “Effect of Treated Grey Water Reuse in Irrigation on Soil and Plants,” Desalina-tion, Vol. 256, No. 1-3, 2010, pp. 115-119.
[11] I. Papadopoulos, “Wastewater Management for Agricul-ture Protection in the Near East Region,” Technical Bulle-tin, FAO, Regional Office for the Near East, Cairo, Egypt, 1995.
[12] EPA, “Guidelines for Water Reuse,” EPA625-R-04/018, US Environmental Protection Agency, Cincinnati, 2004. [13] WHO, “Health Guidelines for the Use of Wastewater in
Agriculture and Aquaculture,” Report of a WHO Scien-tific Group, Geneva, 2006.
[14] W. K. Al-Zubari, “Towards the Establishment of a Total Water Cycle Management and Re-Use Program in the GCC Countries,” Desalination, Vol. 120, No. 1-2, 1998,
pp. 3-14.
[15] R. K. Yadav, B. Goyal, R. K. Sharma, S. K. Dubey and P. S. Minhas, “Post-Irrigation Impact of Domestic Sewage Effluent on Composition of Soil, Crop and Ground Wa-ter—A Case Study,” Environmental International, Vol.
28, No. 6, December 2002, pp. 481-486.
[16] M. Qadir, D. Wichelns, I. Raschid-Sally, P. G. McCornik, P. Drechsel, A. Bahri and P. S. Minhas, “The Challenges of Wastewater Irrigation in Developing Countries,” Agri-cultural Water Management, Vol. 97, No. 4, 2009, pp.
561-568.
[17] G. Hussain and A. J. A1-Saati, “Wastewater Quality and its Reuse in Agriculture in Saudi Arabia,” Desalination,
Vol. 123, No. 2-3, October 1999, pp. 241-251.
[18] Y. Chen, C. X. Wang and Z. J. Wang, “Assessment of the Contamination and Genotoxicity of Irrigated with Waste-water,” Journal of Plant and Soil, Vol. 261, No. 1-2,
April 2004, pp. 189-196.
[19] T. Rutkowski, L. Raschid-Sally and S. Buechler, “Waste- water Irrigation in the Developing World—Two Case Studies from the Kathmandu Valley in Nepal,” Agricul-tural Water Management, Vol. 88, No. 1-3, March 2007,
pp. 83-91.
Waste-water Irrigation Effect on Soil, Crop and Environment: Wastewater Recycling in the Loess Area of China,” Jour-nal of Environmental Sciences, Vol. 19, No. 9, 2007, pp.
1093-1099.
[21] R. I. Esteban and E. O. de Miguel, “Present and Future of Wastewater Reuse in Spain,” Desalination, Vol. 218, No.
1-3, January 2008, pp. 105-119.
[22] F. Morari and L. Giardini, “Municipal Wastewater Treat-ment with Vertical Flow Constructed Wetland for Irriga-tion Reuse,” Ecological Engineering, Vol. 35, No. 5, May 2009, pp. 643-653.
[23] M. Al-Shammiri, A. Al-Saffar, S. Bohamad and M. Ah-med, “Waste Water Quality and Reuse in Irrigation in Kuwait Using Microfiltration Technology in Treatment,”
Desalination, Vol. 185, No. 1-3, November 2005, pp.
213-225.
[24] S. B. Al-Shammiri and A. M. Shahalam, “Effluent from and Advanced Wastewater Treatment Plant—An Alter-nate Source of Non-Potable Water for Kuwait,” Desalina-tion, Vol. 196, No. 1-3, September 2006, pp. 215-220. [25] M. S. Mohsen and J. O. Jaber, “Potential of Industrial
Wastewater Reuse,” Desalination, Vol. 152, No. 1-3,
Feb-ruary 2002, pp. 281-289.
[26] B. Y. Ammary, “Wastewater Reuse in Jordan: Present Status and Future Plans,” Desalination, Vol. 211, No. 1-3,
June 2007, pp. 164-176.
[27] A. S. Al-Adili, “Geotechnical Evaluation of Baghdad Soil Subsidence and their Treatments,” Ph.D. Thesis, Univer-sity of Baghdad, Iraq, 1998.
[28] APHA, WWA & WEF, “Standard Methods for Examina-tion of Water and Wastewater,” 21st EdiExamina-tion, American Public Health Association, Washington, D.C., 2005. [29] F. M. Eaton, “Significance of Carbonates in Irrigated
Waters,” Soil Science,Vol. 69, No. 2, February 1950, pp.
127-128.
[30] US Salinity Laboratory, “Diagnosis and Improvement of Saline and Alkaline Soils,” Department of Agriculture, Handbook No. 60, 1954, p. 160.
[31] L. V. Wilcox, “The Quality of Water for Irrigation Use,” US Department of Agriculture, Technical Bulletin No. 962, Washington, D.C., 1948, p. 40.
[32] R. S. Ayers and D. W. Westcot, “Water Quality for Agri-culture,” Irrigation and Drainage Paper No. 29, FAO, Rome, 1985.
[33] M. B. Pescod, “Wastewater Treatment and Use in Agri-culture,” FAO Irrigation and Drainage Paper No. 47, FAO, Rome, 1985.
[34] R. K. Tatawat and C. P. Singh Chandel, “A Hydrochemi-cal Profile for Assessing the Groundwater Quality of Jaipur City,” Environmental Monitoring and Assessment,
Vol. 143, No. 1-3, August 2008, pp. 337-343.
[35] W. P. Kelley, “Alkali Soils: Their Formation Properties and Reclamations,” Reinhold, New York, 1951.
[36] S. Begum and M. G. Rasul, “Reuse of Stormwater for Watering Gardens and Plants Using Green Gully: A New Stormwater Quality Improvement Device (SQID),” Water
Air Soil Pollution: Focus, Vol. 9, No. 5-6, December
2009, pp. 371-380.
[37] B. Abdul-Moneim, “Protected Irrigation,” Kuwait Univer-sity, 1985.
[38] D. K. Todd, “Groundwater Hydrology,” Wiley Interna-tional Edition, John Wiley and Sons. Inc., New York, 1980. [39] T. N. Tiwari and A. Manzoor, “Pollution of Subarnarekha
River near Jamshedpur and the Suitability of its Water for Irrigation,” Indian Journal of Environmental Protection, Vol. 8, 1988, pp. 494-497.
[40] C. A. Bower and M. Maasland, “Sodium Hazards of Pun-jab Groundwater,” West Pakistan Engineering Congress Proceeding, Vol. 50, 1963, pp. 49-61.
[41] R. S. Ayers and D. W. Westcot, “Water Quality for Agri-culture,” Irrigation and Drainage Paper No. 29, FAO, Rome, 1976.
[42] D. L. Suarez, “Relation between pHc and Sodium Ad-sorption Ratio (SAR) and An Alternative Method of Es-timating SAR of Soil or Drainage Waters,” Soil Science Society of American Journal, Vol. 45, No. 3, 1981, pp. 469-475.
[43] N. S. Rao, “Seasonal Variation of Groundwater Quality in a part of Guntur District, Andhra Pradesh, India,” Envi-ronmental Geology, Vol. 49, No. 3, January 2006, pp.
413-429.
[44] K. R. Karanth, “Hydrogeology,” McGraw-Hill, New Delhi, 1989.
[45] G. Fipps, “Irrigation Water Quality Standards and Salinity Management,” The Texas A & M University System, 1998. http://www.extension.org/mediawiki/files/1/1e/Sali- nity document.pdf
[46] D. J. Halliwell, K. M. Barlow and D. M. Nash, “A Re-view of the Effects of Wastewater Sodium on Soil Physi-cal Properties and their Implications for Irrigation Sys-tems,” Australian Journal of Soil Research, Vol. 39, No. 6, 2001, pp. 1259-1267.
[47] R. W. Tillman and A. Surapaneni, “Some Soil-Related Issues in the Disposal of Effluent on Land,” Australian Journal of Experimental Agriculture, Vol. 42, No. 3, 2002, pp.
225-235.
[48] J. E. Ayers and K. K. Tanji, “Effect of Drainage on Water Quality in Arid and Semiarid Lands,” In: R. W. Skaggs and J. van Schilfgaarde, Eds., Agricultural Drainage,
ASA-CSSA-SSSA, Madison, 1999, pp. 831-867.
[49] J. W. van Hoorn and J. G. van Alpen, “Salinity Control, Salt Balance and Leaching Requirement of Irrigated Soil- 9,” International Course of Land Drainage, Wageningen, the Netherlands, 1990.
[50] L. Khodapanah, W. N. A. Sulaiman and D. N. Khoda-panah, “Groundwater Quality Assessment for Different Purposes in Eshtehard District, Tehran, Iran,” European Journal of Scientific Research, Vol. 36, No. 4, 2009, pp.
543-553.
[51] I. Szabolcs and C. Darab, “The Influence of Irrigation Water of High Sodium Carbonate Content of Soils,” Pro-ceedings of 8th International Congress of Isss, Vol. 2,