THE POVERTY, GROWTH AND INEQUALITY IN CANADA
Department of Economics, Faculty of Economics and
ARTICLE INFO ABSTRACT
The relationship between income distribution and development process is one of the oldest issues in economic research.
poverty in developing countries. The basic political question for policy economic growth reduces poverty?
plus for poverty reduction and reduction of
examine the relationship between poverty (POV), inequality (GINI) and real GDP growth (EC) for Canada over the period 1976
Approach. According
found that 1% increase in growth rate is leading to a 0.006% decrease on poverty rate. In addition to this, 1% increase in income inequality (GINI) is leading to a 0.91 % incr
JEL Classification:
Copyright © 2018, Özgür Bayram SOYLU. This is an open use, distribution, and reproduction in any medium, provided
INTRODUCTION
The relationship between income distribution and development process is one of the oldest issues in economic research. 1950s and 1960s, economists such as Nicholas Kaldor and Simon Kuznets argued that there is a exchange between reducing inequality and encouraging growth (Forbes, 2000).The claim that economic growth will rapidly reduce poverty since 1970s has been met with passion by some researchers (Ravallion, 1995). Kuznets (1955) states that as working population in the development process flows into the sectors of the economy with high productivity, the income inequality growth relationship must first follow the increasing, then decreasing reverse-U shape. Inequality first increases and then decreases with economic development.
economic development and income distribution will be an important part of the agenda of all national policy makers. Most economists and policymakers agree that economic growth will reduce poverty in developing countries.
political question for policy-makers is: how much economic growth reduces poverty? Some estimates have been developed about the rate at which economic growth decreases poverty. Ravallion and Chen (1997) suggest that a 10% increa economic growth will lead to a 20-30% reduction in poverty. Bhalla (2002) argued that a 10% increase in economic growth would reduce poverty by 25% on the basis
countries. The long-term analysis of the relationship between economic growth and income distribution has provided
*Corresponding author: Özgür Bayram SOYLU
Department of Economics, Faculty of Economics and Administrative Sciences, Kocaeli University, Turkey.
ISSN: 0975-833X
Article History:
Received 16th July, 2018 Received in revised form 26th August, 2018
Accepted 15th September, 2018
Published online 30th October, 2018
Citation: Özgür Bayram SOYLU, 2018. “The poverty, growth and inequality in
Key Words:
Poverty, economic growth, Income inequality, ARDL Bound Testing.
RESEARCH ARTICLE
THE POVERTY, GROWTH AND INEQUALITY IN CANADA
*Özgür Bayram SOYLU
Department of Economics, Faculty of Economics and Administrative Sciences, Kocaeli University, Turkey
ABSTRACT
The relationship between income distribution and development process is one of the oldest issues in economic research. Most economists and policymakers agree that economic growth w
poverty in developing countries. The basic political question for policy economic growth reduces poverty? If the goal is to reduce poverty, then clearly,
plus for poverty reduction and reduction of income inequality. The main aim of this study is to examine the relationship between poverty (POV), inequality (GINI) and real GDP growth (EC) for Canada over the period 1976-2015 by using Autoregressive Distributed Lag (ARDL) Bounds Testing Approach. According to this approach, there is a cointegration relation between the series and it is found that 1% increase in growth rate is leading to a 0.006% decrease on poverty rate. In addition to this, 1% increase in income inequality (GINI) is leading to a 0.91 % incr
JEL Classification: D63, E10, I32, O47, O52.
open access article distributed under the Creative Commons Attribution provided the original work is properly cited.
The relationship between income distribution and development process is one of the oldest issues in economic research. In the 1950s and 1960s, economists such as Nicholas Kaldor and that there is a exchange between reducing inequality and encouraging growth (Forbes, 2000).The claim that economic growth will rapidly reduce poverty since 1970s has been met with passion by some Kuznets (1955) states that as the working population in the development process flows into the sectors of the economy with high productivity, the income inequality growth relationship must first follow the increasing, Inequality first increases and n decreases with economic development. The course of economic development and income distribution will be an important part of the agenda of all national policy makers. Most economists and policymakers agree that economic loping countries. The basic makers is: how much economic growth reduces poverty? Some estimates have been developed about the rate at which economic growth decreases poverty. Ravallion and Chen (1997) suggest that a 10% increase in 30% reduction in poverty. Bhalla (2002) argued that a 10% increase in economic growth basis of developing term analysis of the relationship between th and income distribution has provided
Department of Economics, Faculty of Economics and Administrative Sciences,
important policy implications for developing countries. the most serious problems faced by developing countries and transition economies today is to identify and implement reforms that accelerate growth and reduce poverty.
and Squire (1997) summarize the policy implications as follows:
Is there a slower economic growth in countries with unequal income distribution than in more equitable countries?Are governments considering accepting redistribution policies to improve the situation of the poor?
Economic growth leads to a more unequal distribution of income in countries with low levels of development. The income per capita must reach a certain minimum level in order to begin to decrease income inequality.
suggests that inequality affects total production and has different effects between rich and poor countries (Brueckner and Lederman, 2018). Inequality harms many aspects of the economy. It directs the money needed for public investments and social development to manage the crises and pathologies that will be generated by income inequality.
literally a matter of life and death.
significantly reduced due to low unemployment, strong growth of middle-class jobs, and large investments in public services and social programs from the 1940s to the 1970s. However, income inequality has started to increase since the early 1980s.The income of middle class workers and families stagnated, while poverty remained unacceptably high. Jha International Journal of Current Research
Vol. 10, Issue, 10, pp.74326-74332, October, 2018
DOI: https://doi.org/10.24941/ijcr.32522.10.2018
The poverty, growth and inequality in Canada”, International Journal of Current Research
THE POVERTY, GROWTH AND INEQUALITY IN CANADA
Administrative Sciences, Kocaeli University, Turkey
The relationship between income distribution and development process is one of the oldest issues in Most economists and policymakers agree that economic growth will reduce poverty in developing countries. The basic political question for policy-makers is: how much If the goal is to reduce poverty, then clearly, economic growth is a inequality. The main aim of this study is to examine the relationship between poverty (POV), inequality (GINI) and real GDP growth (EC) for 2015 by using Autoregressive Distributed Lag (ARDL) Bounds Testing to this approach, there is a cointegration relation between the series and it is found that 1% increase in growth rate is leading to a 0.006% decrease on poverty rate. In addition to this, 1% increase in income inequality (GINI) is leading to a 0.91 % increase on poverty rate.
ribution License, which permits unrestricted
important policy implications for developing countries. One of most serious problems faced by developing countries and transition economies today is to identify and implement reforms that accelerate growth and reduce poverty. Deininger and Squire (1997) summarize the policy implications as
economic growth in countries with unequal income distribution than in more equitable countries?Are governments considering accepting redistribution policies to improve the situation of the poor?
Economic growth leads to a more unequal distribution of ome in countries with low levels of development. The income per capita must reach a certain minimum level in order to begin to decrease income inequality. Economic theory suggests that inequality affects total production and has ich and poor countries (Brueckner and Lederman, 2018). Inequality harms many aspects of the economy. It directs the money needed for public investments and social development to manage the crises and pathologies that will be generated by income inequality. Inequality is literally a matter of life and death. Inequalities were significantly reduced due to low unemployment, strong growth class jobs, and large investments in public services and social programs from the 1940s to the 1970s. However, ome inequality has started to increase since the early 1980s.The income of middle class workers and families stagnated, while poverty remained unacceptably high. Jha
INTERNATIONAL JOURNAL OF CURRENT RESEARCH
(2000) state that the ultimate goal of economic growth should be to improve the living conditions of the poor.
Economic growth, which does not lead to sharp and steady declines in poverty, can create more problems than it solves. Likewise, if rapid economic growth can only be achieved at the expense of the deterioration of resources, such growth will ultimately become unsustainable as it will create social tensions. There are some mechanical properties of growth, inequality and poverty. Kanbur describes these features as follows: First, an increase in per capita (in other words, growth) reduces poverty by keeping inequality constant. Second, protecting per capita income leads to an increase in inequality. If the goal is to reduce poverty, then clearly, growth is a plus for poverty reduction and reduction of inequality (Kanbur, 2005). The average incidence of income poverty decreases as countries become richer. Other welfare indicators also tend to improve such as the average level of education and health. For these reasons, economic growth is a powerful force for poverty reduction. According to the world development report, around one-fifth of the people in the world are surviving with less than $ 1 a day. Understanding policies and institutions that lead to sustainable and sustainable economic growth is the first step in developing strategies to improve most of the poor (Giilis et al., 2001). The impact of growth on poverty depends on how the additional income generated by growth is distributed within a country. Does growth lead to systematic increases or decreases in income inequality? Do policies and institutions that contribute to higher growth increase or decrease inequality? Does the combination of regional or sectoral growth affect changes in income inequality? Seeking answers to these questions remains one of the main objectives of policy makers. The effects of inequality on growth have been subjected to a significant empirical investigation. In addition to poverty, inequality has an economic impact from 1 percent to the lowest one in the whole of society. The basic mechanism by which poverty affects human capital is simple: If people cannot access goods and services that allow them to accumulate basic human capital, they will be less competitive in the labor market and earn lower wages. In Canada, income inequality has been increasing
in the last thirty years. Gini coefficient represents income inequality of Canadian economy.
This paper is organized as follows: The Section 2, explains the relationship between poverty, economic growth and income inequality as a theoretically and many studies have been carried out in this section. The section 3, contains data and methodology. The emprical findings and disccussion have been defined in section 4. The conclusion part of this paper has been summarized in the last section.
Literature review
The literature on the relation between economic growth, poverty and inequality is very controversial with conclusions and direction of causality. Each country should have targets for effective redistribution of wealth to support growth. Barro (2000) concluded that the effect of income inequality on growth may be positive or negative depending on the level of economic development. Income inequality in poor countries retards economic growth, while income inequality in rich countries stimulates growth. Cogneau and Guenard (2002) examined the relationship between inequality and growth at macroeconomic level. They did not find a strong relationship between income inequality and economic growth and physical and human investment. The main theoretical approach in evaluating the determinants of inequality includes some versions of the Kuznets (1955) curve. Kuznets's idea focused on human movement from agriculture to industry, which was further developed by Robinson (1976). Rich people maintain a higher portion of their income to increase savings and investment (Kaldor 1957). Several theories have been created to assess macroeconomic relations between inequality and economic growth. Perotti (1996) reports a general trend of inequality in order to achieve lower economic growth in cross-country regressions. Perotti (1993) reveals that a high level of income allows the state to allocate more tax in different sectors such as health, education and social protection in relation to economic growth and poverty. This has a significant impact on poverty reduction. Hull (2009) emphasized the importance of employment creation for poverty reduction. Economic growth .29
.30 .31 .32
[image:2.595.52.544.102.342.2]76 77 78 79 80 81 82 83 84 85 86 87 88 89 90 91 92 93 94 95 96 97 98 99 00 01 02 03 04 05 06 07 08 09 10 11 12 13 14 15
GINI
is strongly linked to poverty reduction. Persson and Tabellini (1994) examined the relationship between economic growth and income inequality, taking into account the effects of the increase in demand for redistribution on political instability. The demand for redistribution could create negative impacts on economic growth by causing social / political instability, leading to deterioration of investment environment and production efficiency. The study of Panizza (2002), which aims to examine the relationship between economic growth and income inequality by using panel data method, covers the period of 1940-1980 and 48 American states. The higher class incomes of the middle class will result in higher growth rates while higher inequality will decrease the growth rate. International poverty comparisons have used income poverty measures since their significant contribution to the estimation of income poverty in developing countries by Ravallion, Datt and Van de Walle (1991). Is there a direct link between poverty and inequality? The results of empirical studies indicate that inequality is important for the welfare of households, so we must understand the impact of this variable (Wilkinson and Pickett, 2010). Kakwani (2001) and Son (2007) concluded that there is a positive relationship between inequality and poverty. In addition, Alesina and Rodrik (1994) found that initial inequalities led to less growth and this contributed to the acceleration of poverty.
Sbaouelgi and Boulila (2013) studied the causality between income inequality and economic growth for nine countries in the MENA region from 1960 to 2011. there was long-term causality between economic growth and inequality for Tunisia, Iran and Morocco. Khemili and Belloumi (2018) investigated the causality between poverty, inequality and economic growth in Tunisia. The result of the ARDL test reveals that there is evidence of a long-term relationship between the indicators. It is determined that there is a positive relationship between income inequality and poverty in the long term. There is a positive relationship between inequality and growth towards poverty in the short term. The work suggests that governments should intensify efforts to strengthen economic growth and pay attention to its sustainability. In addition, political leaders should focus their efforts on middle-class and poverty and reduce inequality. Therefore, it should support economic growth which can reduce poverty. Evidence from a large panel of countries shows that there is little correlation between income inequality and growth and investment rates (Barro 2000). There is a sign that inequality slows growth in poor countries, but encourages growth in richer places. More recent studies have emphasized that inequality may be detrimental to growth. Galor and Zeira (1993), emphasizing the interaction of credit market deficiencies and fixed investment costs in education, show that inequality can invest in human capital and reduce growth Galor and Moav (2004) propose a unified inequality and growth theory that argues that the effect of inequality depends on the relative return to physical and human capital. The accumulation of human capital becomes the main driving force of growth and inequality reduces growth In the modern growth regime (Berg et al., 2018). De la Croix and Doepke (2003) argue that inequality increases the productivity of the poor and therefore reduces the accumulation and growth of human capital. According to the Asian Development Bank (2012), income inequalities have increased over the last two decades, with about 82% of the Asian population growing in Asia, becoming a growing concern in countries that are not more equitable in terms of income distribution. Forbes (2000) shows that the increase in
the level of income inequality of a country has a significant positive relationship with the next economic growth in the short and medium term. These relationship examples are very robust in terms of variable definitions and model properties. Javry and Sadoulet (2000) studied the determinants of changes in urban and rural poverty incidence and Gini coefficients, taking advantage of poverty and income inequality data for 12 Latin American countries between 1970 and 1994. In particular, he emphasized the role of total income growth. He found that income growth reduced urban and rural poverty, but did not reduce inequality. If the level of income inequality and poverty is low and the level of secondary education is higher income growth is more effective in reducing urban poverty. Jha (2000) examines the empirical relationship between economic inequality, poverty and economic growth in Indian states. JHA found that rural poverty was spreading more widely among states.
It is important to understand the role of inequality in growth-poverty. While explaining that significant growth in developing countries can contribute to the development of human development, especially in poverty reduction (Fosu, 2009; Kalwij and Verschoor, 2007; Ravallion, 1997). Leight (2010) examines the relationship between economic inequality, income growth and political control in US states for the period from 1969 to 2005. The result shows that inequality has a significant and strong impact on the growth in the short term. In addition, the findings suggest that the relationship between inequalities is not linear. The literature has found that growth in average income is associated with decreases in the incidence and depth of poverty. Ravallion and Chen (1997) demonstrate that changes in inequalities are unrelated to growth rates between 1981 and 1994, and that poverty reduction is strongly associated with growth in average incomes. Dollar and Kraay (2002) find that growth is also good for the poor. In a sample of 92 countries, the average income of the poorest 20% of the population increased by an average of the same average compared to fourty years. Ravallion and Datt (1996) found that growth in the agriculture and (especially) services sectors had a greater impact on poverty than production growth. Fosu (2017) emphasizes the role of income inequality and presents comparative global evidence on the transformation of economic growth into poverty reduction in developing countries. Fosu (2017) shows that average income growth is the main driving force behind both decreases and increases poverty.
MATERIALS AND METHODS
integrated variables. The fact that the variables to be used in the model are stationary I (0) or stationary I (1) in the first difference does not preclude the application of the boundary test. Since the ARDL boundary test uses the unrestricted error correction model, it gives statistically more reliable results. The most important feature of the error correction model is that it contains information about the short- and long-term dynamics of the variables.
The unrestricted error correction model for the ARDL boundary test is defined as follows: (1)
∆ = + + ∑ ∆ + ∑ ∆ +
∑ ∆ + + + + (1)
(POV) represents poverty rate, (EC) represents real GDP growth, (GINI) represents income inequality, α represents constant, ∆ represents the first difference operator and μ_t represents error term. The ARDL bounds testing follows estimation of regressions in order to obtain the optimal lag length for each variable. An appropriate lag selection is chosen based on Akaike information criterion (AIC). In order to test the existence of the cointegration relation, F test is applied to the first differences of dependent and independent variables. The null hypothesis for this test is as follows:
= = = 0 (No long-run relationships exist)
= ≠ ≠ 0 (Long-run relationships exist)
The F statistics in the ARDL boundary test method are determined according to the lower and upper values in the study of Pesaran et al. (2001). If the value obtained from the analysis is smaller than the calculated subcritical value of F, it is considered that there is no cointegration relation between the series. If the value obtained is larger than the upper critical value, the existence of the cointegration relation can be mentioned.
However, if the value lies between the lower and upper critical values, then no decision on cointegration can be made. The ARDL models are defined to determine the long term and short term relationships of the variables when the cointegration relation is obtained between variables as a result of the boundary test result. The emprical process is organized as follows: Firstly, Augmented Dickey Fuller Test results will be included in next section. Then, the results of the boundary test will be given in tables. If the cointegration relation is obtained, the estimation results of long and short term ARDL model will be given.
EMPRICAL FINDINGS AND DISCUSSION
The stationarity is very important in the time series analysis. Augmented Dickey Fuller (ADF) test is the most commonly used unit root test. The Augmented Dickey Fuller (ADF) unit root test is used to determine whether the variables are stationary or not. The Augmented Dickey Fuller (ADF) and Philips-Perron (1988) unit root tests are used to determine whether the variables are stationary or not. Table 1 represents the results of unit root tests for selected macroeconomic indicators.
Table 1 shows that the economic growth series is stationary at the level while poverty (POV) and inequality (GINI) series are not stationary at level. Table 2 represents the results of unit roots for POV and GINI series at first difference. POV and GINI series are stationary at first difference according to unit root test results. To summarize the results of unit root tests, economic growth rate is stationary at level I(0), poverty and inequality series are stationary at first level I(1). In this case, the ARDL test can be applied. The first step of the ARDL model is to determine the appropriate lag length. Critical values such as Akaike, Schwarz and Hannan-Quinn are used to determine the lag length.
Table 1: Unit Root Test at Level
Variables ADF PP
t-statistic Probability Critical Values at 5% t-statistic Probability Critical Values at 5%
POV -2.126327 0.5156*** -3.529758 -1.772214 0.6989*** -3.529758
EC -4.731997 0.0026* -3.529758 -4.567948 0.0040* -3.529758
GINI -3.331392 0.0762** -3.529758 -3.372043 0.0700** -3.529758
H0 = EC has a unit root
* The H0 hypothesis is rejected because the probability value is smaller than 0.05, the series is stationary. H2 = GINI has a unit root
** The H2 hypothesis is accepted because the probability value is larger than 0.05, the series is not stationary. H4 = POV has a unit root
* The H4 hypothesis is accepted because the probability value is larger than 0.05, the series is not stationary Source: Calculated by Eviews
Table 2. Unit Root Test at First Differences Variables ADF PP
t-statistic Probability Critical Values at 5% t-statistic Probability Critical Values at 5%
POV -7.927589 0.0000* -3.533083 -13.57213 0.0000* -3.533083
GINI -7.720383 0.0000** -3.533083 -7.906389 0.0000** -3.533083
H6 = POV has a unit root
* The H6 hypothesis is rejected because the probability value is smaller than 0.05, the series is stationary. H8 = GINI has a unit root
* The H8 hypothesis is rejected because the probability value is smaller than 0.05, the series is stationary. Source: Calculated by Eviews
Table 3. Breusch-Godfrey Serial Correlation LM Test
F-statistic 0.955756 Prob. F(1,23) 0.3384
Obs*R-squared 1.396386 Prob. Chi-Square(1) 0.2373*
The lag length providing the smallest critical value is determined as the lag length of the model. The optimal lag length was determined as based on Akaike (AIC). The F statistics are used to determine the existence of the cointegration relation between the series after determining the lag length. The F statistics in the ARDL boundary test method are determined according to the lower and upper values in the study of Pesaran et al. (2001). In other words, F statistics should be compared with Peseran Critical value at 1 percent level. The results of the ARDL boundary test and diagnostisc test results are given in Table 4. Also I have to check whether this ARDL model has serial corelation or not. Table 3 shows the resuls of Breusch-Godfrey Serial Correlation LM Test. The poverty, growth and inequality series have long run associateship. That means all the three variables move together in the long run. The long-run model can be estimated as: (2)
= + ∑ ∆ + ∑ ∆ + ∑ + (2)
[image:5.595.307.558.280.535.2]The AIC information criterion was used in determining the lag length in the study and the long-term predicted model was the ARDL (5,2,1) model.
Table 4. ARDL Bounds Test and Diagnostic Test Results
k (independent variable)
F-statistic I(0) Bound (1%)* I(1) Bound (1%)*
2 9.046596 5.15 6.36
Null Hypothesis: No long-run relationships exist.
* I (0) indicates the lower bound, I (1) indicates the upper bound at the 1% level.
Source: Calculated by Eviews
Table 4 represents the ARDL Cointegrating and Long Run Coefficients. The long term coefficients of the model have expected signs and are statistically significant. According to long run coefficients 1% increase in growth rate is leading to a 0.006% decrease on poverty rate. In addition to this, 1% increase in income inequality (GINI) is leading to a 0.91 % increase on poverty rate. The short term relationship between the variables was investigated with an error correction model based on the ARDL approach. The coefficient of this variable indicates how much of the imbalance in the short term will be corrected in the long run. It is expected that the sign of this coefficient is negative. The lag lengths in the model are determined by AIC. This model is as follows: (3)
∆ = + ∑ ∆ + ∑ ∆ + ∑ ∆ +
+ (3)
As it is stated above, The ECTt-1should be negative and
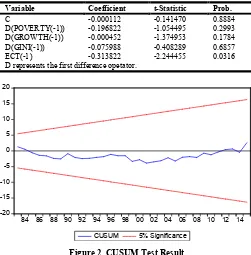
significant. Table 6 shows that it is negative and it is significant meaning that the whole system can get back long run equilibrium. The long run equilibrium at the spead of 0.31%. In models, the stability of long and short run coefficients is generally measured by CUSUM test which is recommended by Brown et al. (1975). In the CUSUM test, it can be argued that the estimated coefficients are steady if the error terms obtained in the models are between the confidence intervals at 5% significance. If the CUSUM statistics remain within the critical limits (between two lines) at the 5% level of significance, the H0 hypothesis will be accepted, which indicates that the coefficients in the ARDL model are steady (Bahmani-Oskooee, Ng, 2002). The results of CUSUM investigating the structural breaks related to the variables are given in Figure 2. Figure 2 shows that there is no structural break, in other words, the ARDL model is stable.
Table 5. ARDL (5,2,1) ARDL Cointegrating And Long Run Coefficients
Variable Coefficient t-Statistic
D(POVERTY(-1)) -0.608063 -3.845101
D(POVERTY(-2)) -0.324659 -2.056111
D(POVERTY(-3)) -0.102405 -0.759177
D(POVERTY(-4)) -0.226584 -1.561768
D(GROWTH) 0.000101 0.296627
D(GROWTH(-1)) 0.001043 2.959828
D(GINI) 0.884249 5.443585
CointEq(-1) -0.256886 -2.142018
Long Run Coefficients
Variable Coefficient t-Statistic (Probability)
Growth -0.006719 -2.011880 (0.0556)
Gini 0.911743 2.265187(0.0328)
C -0.138423 -1.178820 (0.2500)
D represents the first difference opetator. ()The probability values are in parentheses. Source: Calculated by Eviews
Table 6. Error Correction ARDL Model Results
Variable Coefficient t-Statistic Prob.
C -0.000112 -0.141470 0.8884
D(POVERTY(-1)) -0.196822 -1.054495 0.2993
D(GROWTH(-1)) -0.000452 -1.374953 0.1784
D(GINI(-1)) -0.075988 -0.408289 0.6857
ECT(-1) -0.313822 -2.244455 0.0316
D represents the first difference opetator.
-20 -15 -10 -5 0 5 10 15 20
84 86 88 90 92 94 96 98 00 02 04 06 08 10 12 14
CUSUM 5% Significance
Figure 2. CUSUM Test Result
It is clear that the long run coefficients are steady calculated according to the ARDL Boundary Test and the model can be predicted without using any artificial variables to express the structural break.
Conclusion
[image:5.595.35.290.326.356.2]In addition, policy makers need to see social challenges such as inequality and poverty as obstacles to the long-term prosperity of Canadians. This requires a comprehensive approach to policy analysis that can best be achieved with a new mechanism. On the other hand, economic reforms can create opportunities for the poor and thus support pro-poverty growth. By rearranging public expenditures, it is necessary to develop people-oriented policies. The basic asic and technical education should be invested in order to increase the supply of qualified labor force.
REFERENCES
Adams Jr, R. H. 2004. Economic growth, inequality and poverty: estimating the growth elasticity of poverty. World
Development, 32(12), 1989-2014.
ADB. 2002. Poverty in Pakistan: Issues, causes, and institutional responses.
Alesina, A. and Rodrik, D. 1994. Distributive politics and economic growth. The quarterly journal of economics, 109(2), 465-490.
Bahmani-Oskooee, M. and Ng, R. C. W. 2002. Long-run demand for money in Hong Kong: an application of the ARDL model. International journal of business and
economics, 1(2), 147.
Barro, R. J. 2000. Inequality and Growth in a Panel of Countries. Journal of economic growth, 5(1), 5-32.
Berg, A., Ostry, J. D., Tsangarides, C. G. and Yakhshilikov, Y. 2018. Redistribution, inequality, and growth: new evidence. Journal of Economic Growth, 23(3), 259-305. Bhalla, S. S. 2002. Imagine there's no country: Poverty,
inequality, and growth in the era of globalization. Peterson
Institute.
Brown, R. L., Durbin, J. and Evans, J. M. 1975. Techniques for testing the constancy of regression relationships over time. Journal of the Royal Statistical Society. Series B (Methodological), 149-192.
Brueckner, M. and Lederman, D. 2018. Inequality and economic growth: the role of initial income. World Bank. Cogneau, D., Guenard, C., 2002. Les inégalités et la croissance
une relation introuvable, DT, Paris, DIAL, pp: 1-26. De La Croix, D. and Doepke, M. 2003. Inequality and growth:
why differential fertility matters. American Economic
Review, 93(4), 1091-1113.
Deininger, K. and Squire, L. 1997. Economic growth and income inequality: reexamining the links. Finance and
Development, 34, 38-41.
Dollar, D. and Kraay, A. 2002. Growth is Good for the Poor.
Journal of economic growth, 7(3), 195-225.
Engle, R. F. and Granger, C. W. 1987. Co-integration and error correction: representation, estimation, and testing.
Econometrica: journal of the Econometric Society,
251-276.
Forbes, K. J. 2000. A reassessment of the relationship between inequality and growth. American economic review, 90(4), 869-887.
Fosu, A. K. 2009. Inequality and the impact of growth on poverty: comparative evidence for sub-Saharan Africa. The
Journal of Development Studies, 45(5), 726-745.
Fosu, A. K. 2017. Growth, inequality, and poverty reduction in developing countries: recent global evidence. Research in
Economics, 71(2), 306-336.
Galor, O. and Moav, O. 2004. From physical to human capital accumulation: Inequality and the process of development.
The Review of Economic Studies, 71(4), 1001-1026.
Galor, O. and Zeira, J. 1993. Income distribution and macroeconomics. The review of economic studies, 60(1), 35-52.
Gillis, M., Shoup, C. and Sicat, G. P. 2001. World development
report 2000/2001-attacking poverty. The World Bank.
Janvry, A. D. and Sadoulet, E. 2000. Growth, poverty, and inequality in Latin America: A causal analysis, 1970–94.
Review of Income and Wealth, 46(3), 267-287.
Jha, R. 2000. Growth, inequality and poverty in India: Spatial and temporal characteristics. Economic and Political
Weekly, 921-928.
Jha, R. 2000. Growth, inequality and poverty in India: Spatial and temporal characteristics. Economic and Political
Weekly, 921-928.
Johansen, S. 1988. Statistical analysis of cointegration vectors.
Journal of economic dynamics and control, 12(2-3),
231-254.
Kakwani, N., 2001. On specifying poverty lines, Paper presented at the Asia and Pacific forum on poverty: Reforming Policies and Institutions for poverty Reduction,
Asia Development Bank, Manila. pp: 1-34.
Kaldor, N. 1957. A model of economic growth. The economic
journal, 67(268), 591-624.
Kalwij, A. and Verschoor, A. 2007. Not by growth alone: The role of the distribution of income in regional diversity in poverty reduction. European Economic Review, 51(4), 805-829.
Kanbur, R. 2005. Growth, inequality and poverty: some hard questions. Journal of International Affairs, 223-232. Khemili, H. and Belloumi, M. 2018. Cointegration
Relationship between Growth, Inequality and Poverty In Tunisia. International Journal of Applied Economics,
Finance and Accounting, 2(1), 8-18.
Kuznets, S. 1955. Economic growth and income inequality.
The American economic review, 45(1), 1-28.
Kuznets, S. 1955. Economic growth and income inequality.
The American economic review, 45(1), 1-28.
Leight, E. H. 2010. The Relationships Between Inequality, Economic Growth, and Political Control: Explorations Using US State-level Panel Data, 1969-2005. Wesleyan University
Perera, L. D. H. and Lee, G. H. 2013. Have economic growth and institutional quality contributed to poverty and inequality reduction in Asia?. Journal of Asian Economics, 27, 71-86.
Perotti, R. 1996. Growth, income distribution, and democracy: What the data say. Journal of Economic growth, 1(2), 149-187.
Perotti, R., 1993. Income distribution and investment.
European Economic Review, 38(3-4): 827-835.
Persson, T. and Tabellini, G. 1994. Is inequality harmful for growth?. The American economic review, 600-621.
Pesaran, M. H., Shin, Y. and Smith, R. J. 2001. Bounds testing approaches to the analysis of level relationships. Journal of
applied econometrics, 16(3), 289-326.
Ravallion, M. 1995. Growth and poverty: Evidence for developing countries in the 1980s. Economics letters, 48(3-4), 411-417.
Ravallion, M. 1997. Can High-Inequality Developing Countries Escape Absolute Poverty?’World Bank Policy
Research Working Paper 1775.
Ravallion, M. and Chen, S. 1997. What can new survey data tell us about recent changes in distribution and poverty?.
Ravallion, M. and Datt, G. 1996. How important to India's poor is the sectoral composition of economic growth?. The
World Bank Economic Review, 10(1), 1-25.
Ravallion, M., Datt, G. and Van De Walle, D. 1991. Quantifying absolute poverty in the developing world.
Review of Income and Wealth, 37(4), 345-361.
Robinson, S. 1976. A note on the U hypothesis relating income inequality and economic development. The American
economic review, 66(3), 437-440.
Sbaouelgi, J., Boulila, G., 2013. The causality between Income Inequality and Economic growth : Empirical Evidence from the Middle East and North Africa Region, Asian
Economic and Financial Review, 3(5): 668-682.
Son, H. H. 2007. Interrelationship between growth, inequality, and poverty: the Asian experience (No. 96. ERD Working
Paper Series.
Wilkinson, R., Pickett, K., 2010. The Spirit Level: Why Equality is Better for Everyone. Journal of Social Policy, 42(4): 840-84.