http://www.scirp.org/journal/gep ISSN Online: 2327-4344
ISSN Print: 2327-4336
DOI: 10.4236/gep.2019.76003 Jun. 21, 2019 26 Journal of Geoscience and Environment Protection
Application of Surface Water Quality
Classification Models Using Principal
Components Analysis and Cluster Analysis
Mohamed Ahmed Reda Hamed
Civil Engineering Department, Canadian International Colleague (CIC), El Sheikh Zayed, Egypt
Abstract
Water quality monitoring has one of the highest priorities in surface water protection policy. Many variety approaches are being used to interpret and analyze the concealed variables that determine the variance of observed water quality of various source points. A considerable proportion of these ap-proaches are mainly based on statistical methods, multivariate statistical techniques in particular. In the present study, the use of multivariate tech-niques is required to reduce the large variables number of Nile River water quality upstream Cairo Drinking Water Plants (CDWPs) and determination of relationships among them for easy and robust evaluation. By means of mul-tivariate statistics of principal components analysis (PCA), Fuzzy C-Means (FCM) and K-means algorithm for clustering analysis, this study attempted to determine the major dominant factors responsible for the variations of Nile River water quality upstream Cairo Drinking Water Plants (CDWPs). Fur-thermore, cluster analysis classified 21 sampling stations into three clusters based on similarities of water quality features. The result of PCA shows that 6 principal components contain the key variables and account for 75.82% of total variance of the study area surface water quality and the dominant water quality parameters were: Conductivity, Iron, Biological Oxygen Demand (BOD), Total Coliform (TC), Ammonia (NH3), and pH. However, the results from both of FCM clustering and K-means algorithm, based on the dominant parameters concentrations, determined 3 cluster groups and produced cluster centers (prototypes). Based on clustering classification, a noted water quality deteriorating as the cluster number increased from 1 to 3. However the clus-ter grouping can be used to identify the physical, chemical and biological processes creating the variations in the water quality parameters. This study revealed that multivariate analysis techniques, as the extracted water quality dominant parameters and clustered information can be used in reducing the How to cite this paper: Hamed, M. A. R.
(2019). Application of Surface Water Qual-ity Classification Models Using Principal Components Analysis and Cluster Analysis. Journal of Geoscience and Environment Protection, 7, 26-41.
https://doi.org/10.4236/gep.2019.76003
Received: April 1, 2019 Accepted: June 18, 2019 Published: June 21, 2019
Copyright © 2019 by author(s) and Scientific Research Publishing Inc. This work is licensed under the Creative Commons Attribution International License (CC BY 4.0).
http://creativecommons.org/licenses/by/4.0/
DOI: 10.4236/gep.2019.76003 27 Journal of Geoscience and Environment Protection number of sampling parameters on the Nile River in a cost effective and effi-cient way instead of using a large set of parameters without missing much in-formation. These techniques can be helpful for decision makers to obtain a global view on the water quality in any surface water or other water bodies when analyzing large data sets especially without a priori knowledge about relationships between them.
Keywords
Surface Water, Principal Component Analysis, Cluster Analysis
1. Introduction
The Nile constitutes the essential source of life in Egypt; it provides people with their fresh water needs. It is an essential factor of production and vital for agri-culture, transport, tourism and henceforth the socio-economic development of the country. However, the Nile has become, to a great extent, adversely affected by human activities. On the other hand, industrial waste discharge, leakage of sewage by urban agglomeration and agricultural runoff directly lead to the Nile contamination (Abd El-Daiem, 2011).
Surface water quality deterioration at the intakes of Cairo water treatment plants along River Nile due to increasing level of some pollutants concentration above the guidelines paid the attention of public concern and may cause health hazards. Thus, the need for better management of Cairo treatment plants water sources quality is becoming essential.
The water quality can be characterized by many parameters that represent a water composition in specific localities and time. Real raw data are mostly huge; it means that they are not normally distributed, often co-linear or autocorre-lated, including outliers or errors etc. Due to this reason, multivariate methods such as principal component analysis, cluster analysis, the factor analysis, and the discriminant analysis, are used (Zen & Rasmussen, 2005).
Principal Components Analysis( PCA) is a data analysis tool that is usually used to reduce the number of variables of a large number of interrelated va-riables, while retaining as much of the information (variation) as possible. PCA calculates an uncorrelated set of variables. These factors are ordered so that the first few retain most of the variation present in all of the original variables.
In cluster analysis, the objects are grouped on the basis of similarities within a class and dissimilarities among different classes (Panda et al., 2006). The similar-ities and dissimilarsimilar-ities are obtained on the basis of distance measures which are Euclidean and Manhattan (Kaufman & Rousseeuw, 1990).
con-DOI: 10.4236/gep.2019.76003 28 Journal of Geoscience and Environment Protection tent. By carefully selecting the cluster centers in a way which disperses the initial cluster centers through the data space, the resulting FCM approach determines the cluster centers during the initialization phase. The cluster centers are well spread in the input space, resulting in both faster convergence times and higher quality solutions.
K-means can be used for cauterizing monitoring stations with similar water quality characteristics. K-means cluster analysis is a divisive clustering method with k number of groups set a priori to analysis (Akume & Weber, 2002). Once the number of clusters is set as an input and cluster centroids are initialized, ob-servations are added iteratively to the most similar cluster, whose centroid is then recalculated until all of the observations are grouped (Davis, 2002).
2. Study Area
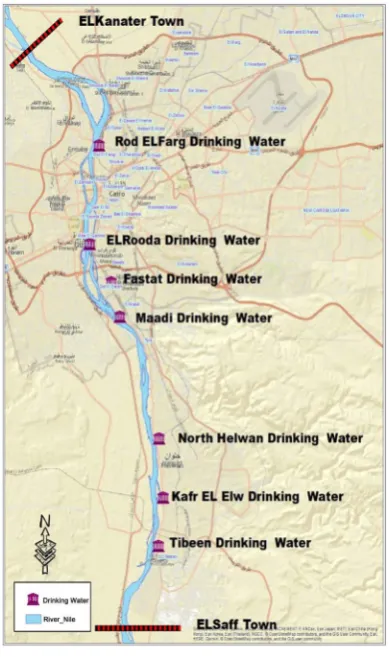
[image:3.595.276.471.384.713.2]The Nile River enters Egypt at its southern boundary with Sudan and runs through 1000 km long narrow valley, then divided at a distance of 25 km north of Cairo into two branches (Rosetta and Damietta) forming a delta which ends at the Mediterranean Sea. Cairo, located on the Nile River south of the Mediterra-nean Sea, just upstream of the point where the river widens into the Delta. Cairo has an area of 353 km2 with an average reach length along the river about 50 km (from 900 km to 950 km referenced to Aswan High Dam). Figure 1 illustrates
DOI: 10.4236/gep.2019.76003 29 Journal of Geoscience and Environment Protection the study area layout which covers Cairo governorate along the River Nile, bounded by El Saff town (Giza Governorate) at 877.00 km from the South and El Kanater town (Qalubia Governorate) at 953.00 km from the North. The study scope will focus on the upstream of drinking water plants located in Cairo go-vernorate along Nile River (Tibeen, Kafr Elw, North Helwan, Maadi, Fostat, El Roda and Rod Farg).
Cairo Drinking Water Plants (CDWPs)
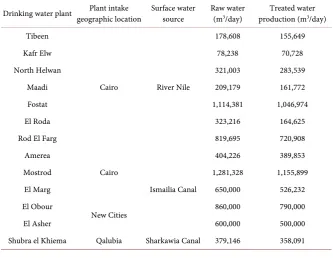
Cairo water company (CWC), a subsidiary of the Holding Company of Water and Wastewater, produces potable water with an amount reaches to 6 million m3/day used by inhabitants of Greater Cairo (CDWC, Central Laboratory An-nual Technical Report, 2018). This is done through 13 Cairo drinking water plants (Tibeen, Kafr Elw, North Helwan, Maadi, Fostat, El Roda, Rod El Farg, Amerea, Mostrod, El Marg, El Obour, El Asher, Shubra el Khiema) distributed in Greater Cairo. Table 1 shows the annual average raw water, treated water and sludge & washing water for Greater Cairo drinking water plants (CDWC, Cen-tral Laboratory Annual Technical Report, 2018).
From Table 1 and according to the study scope which focus on seven CDWPs located on Cairo governorate along Nile River only (Tibeen, Kafr Elw, North Helwan, Maadi, Fostat, El Roda and Rod Farg).
3. Materials and Methods
3.1. Data Requirements
[image:4.595.206.540.472.730.2]Surface Water samples were collected from various sampling locations of rivers,
Table 1. CDWPs surface water source, annual average raw water and treated water.
Treated water production (m3/day)
Raw water (m3/day)
Surface water source Plant intake
geographic location Drinking water plant
155,649 178,608 River Nile Cairo Tibeen 70,728 78,238 Kafr Elw 283,539 321,003 North Helwan 161,772 209,179 Maadi 1,046,974 1,114,381 Fostat 164,625 323,216 El Roda 720,908 819,695
Rod El Farg
389,853 404,226 Ismailia Canal Cairo Amerea 1,155,899 1,281,328 Mostrod 526,232 650,000 El Marg 790,000 860,000 New Cities El Obour 500,000 600,000 El Asher 358,091 379,146 Sharkawia Canal Qalubia
DOI: 10.4236/gep.2019.76003 30 Journal of Geoscience and Environment Protection canal, drains and industrial pollution sources of the study area. The analyses of water samples were carried on twenty water quality parameters for twelve con-sequence months during two years (2017, 2018) to show the effect of the spatial and temporal variation.
These water quality parameters included: pH, Turbidity, Electric Conductivi-ty(EC), Total hardness, Total dissolved solids (TDS), Total alkalinity, Sulfates, Chlorides, Ammonia (NH3), Nitrates (NO3), Nitrites(NO2), Phosphate, Iron, Man-ganese, Calcium, Magnesium, Aluminum, Biological Oxygen Demand (BOD), Chemical Oxygen Demand (COD), Dissolved Oxygen (DO), Total Coliform (TC).
3.2. Methods
The methods consisted of three main components as follows:- 1) Perform the principal component analysis;
2) Develop the dominant water quality parameters;
3) Develop the optimum number of clusters by using Fuzzy C-Means (FCM); 4) Apply K-means algorithm technique to produce the generalized characte-ristics of clusters using the dominant parameters normalized data.
3.2.1. Principal Component Analysis
Principal component analysis (PCA) is mainly applied for the removal of data noise by the reduction of their dimensionality (Jolliffe, 2002). PCA searches new abstract orthogonal principal components (eigenvectors) which explain most of the data variation in a new coordinate system. Each principal component (PC) is a linear combination of the original variables and describes a different source of variation.
1 1 2 2
i n n
PC =w x +w x + + w x (1)
where xi and wi are the original variable and the component weight, respectively. The principal component weights are used as measures of the correlation be-tween the variables and the principal components. The largest or first PC is oriented in the direction of largest variation of the original variables and passes through the center of the data. The second largest PC lies in the direction of the next largest variation, passes through the center of the data and is orthogonal to the first PC. The third largest PC is directed towards the next largest variance, goes through the data center and is orthogonal to the first and second PCs, and so forth. Classical PCA is based on the decomposition of a covariance/correlation matrix by the eigenvalue decomposition or by the singular value decomposition of real data matrices. The eigenvalues or singular values indicate variations among the observed variables (Yu et al., 2003).
DOI: 10.4236/gep.2019.76003 31 Journal of Geoscience and Environment Protection Procedural steps of the PCA (Suhr, 2005) are:
• Number of components equal to number of variables is generated; • The number of components to retain is determined;
• Components are rotated (rotations is a linear transformation of the solution to make interpretation easier);
• Rotated solution is interpreted.
3.2.2. Dominant Water Quality Parameters
In this study, to determine the main dominant water quality parameter, varimax rotation used as an effective orthogonal rotation method that minimized the number of variables that have high loading on each factor. The Varimax coeffi-cient having correlation greater than 0.75 are considered as strong and indicate high proportion of its variance explained by the factor, between 0.50 and 0.75 is considered as moderate loading while 0.30 - 0.50 as weak significant factor loading, indicating much of that attribute’s variance remains unexplained and it is less important (Reghunath et al., 2002).
3.2.3. Fuzzy C-Means Clustering (FCM) Analysis
FCM applied for clustering the raw data into several categories using the selected operators without respect to any predetermined criteria in relation to each cate-gory. Most of the rules designed for FCM are based on the proper search for centroids or representative objects around which all observations will be clus-tered on a minimum basis (Selim, 1984; Trauwaert et al., 1991).
FCM seeks to minimize the following objective function, C, made up of clus-ter memberships and distances (Kaufman & Rousseeuw, 1990).
2 2 1 1 2 1 1 2 N N
ik jk ij K i j N k jk j
m m d C m = = = = =
∑
∑∑
∑
where mik represents the unknown membership of the object i in cluster k and dij is the dissimilarity between objects i and j. The memberships are subject to con-straints that they all must be non-negative and that the memberships for a single individual must sum to one.
One of the most difficult tasks in cluster analysis is choose the appropriate number of clusters. In fuzzy clustering, the following coefficients are used:
1) The amount of “fuzziness” in a solution may be measured by Dunn’s parti-tion coefficient which measures how close the fuzzy soluparti-tion is to the corres-ponding solution. This hard solution is formed by classifying each object into the cluster which has the largest membership. The formula for Dunn’s partition coefficient is:
( )
21 1
1 K N
ik k i
F U m
N = =
=
∑∑
DOI: 10.4236/gep.2019.76003 32 Journal of Geoscience and Environment Protection membership is unity and the rest are zero.
2) Dunn’s partition coefficient may be normalized so that it varies from 0 (completely fuzzy) to 1 (hard cluster). The normalized version is
( )
( ) (
(
1)
)
1 1
F U K
Fc U
K − =
−
3) Another partition coefficient, given in Kaufman and Rousseeuw (1990) is:
( )
(
)
21 1
1 K N
ik ik
k i
D U h m
N = =
=
∑∑
−4) The normalized version of this equation is:
( )
(
( )
)
1 1 D U Dc U K = −Fc(U) and Dc(U) together give a good indication of an optimum number of clusters. We should choose K so that maximize the value of Fc(U) and minimiz-es Dc(U) (Kaufman & Rousseeuw, 1990).
3.2.4. K-Means Algorithm
K-means is a simple and efficient algorithm. It divides n observations into given K clusters and each observation belongs to cluster with nearest mean.
It uses the sum of square error criteria. The cluster pattern is assigned when sum of square error is minimum. The sum of square error equation (SSE) for K-means is given by:
2
SSE
i i
i C x C
x m
∈
=
∑ ∑
−where mi is the mean of the ith cluster and i
x∈C is a pattern assigned to that cluster. The K-means clustering has advantage over other methods as it can be used to assign new cases to the existing clusters.
4. Results and Discussion
4.1. Descriptive Statistics
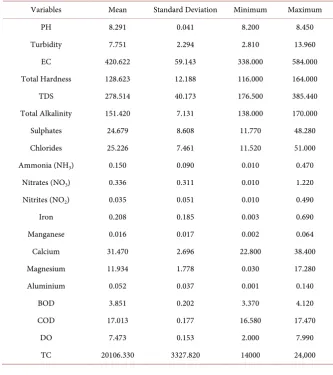
Basic statistics were carried out in order to give initial information about the water quality data. Table 2 shows the details of descriptive statistics for the water quality variables measured in two years.
4.2. Principal Component Analysis
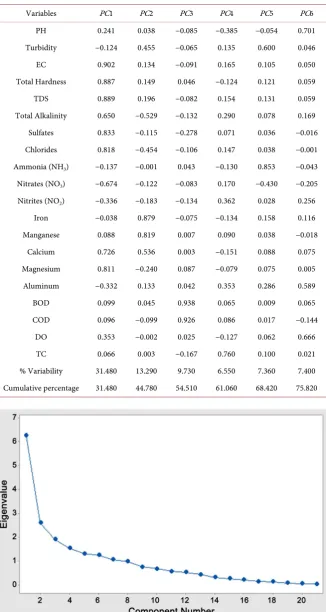
The calculated principal components loadings, eigenvalues, total variance and cumulative variance are shown in Table 3 while the scree plot of the eigenvalues of observed components is depicted in Figure 2.
DOI: 10.4236/gep.2019.76003 33 Journal of Geoscience and Environment Protection to varimax rotation in order to make interpretation easier and fundamental sig-nificance of extracted components to the water quality status of the selected study period. The result of rotation revealed further, the percentages of the total variances of the 6 extracted components when added account for 75.82% (that is their cumulative variance) of the total variance of the observed variables. This indicates that the variance of the observed variables had been accounted for by these 6 extracted components.
[image:8.595.204.538.355.731.2]As it is obvious, the first principal component (PC1), accounts for 31.48% from total variation, can be called as an indication of salt component because it is mainly saturated with conductivity, hardness (including calcium). PC1 ac-counts show a strong loading on EC (0.902), TDS (0.889), Total Hardness (0.887), Sulfates (0.883), Chlorides (0.881), Magnesium (0.811), while moderate loading on Calcium (0.726), Nitrates (0.674) and Total Alkalinity (0.65). Electric Conductivity (EC) measurements indicate the presence of dissolved salts and electrolytic contaminants, but it gives no information about specific ion compo-sitions (Adekunle et al., 2007). There was a strong positive correlation between TDS and EC values which revealed positively strong correlation to each other (r =
Table 2. Mean and standard deviation of surface water quality parameters.
Variables Mean Standard Deviation Minimum Maximum
PH 8.291 0.041 8.200 8.450
Turbidity 7.751 2.294 2.810 13.960
EC 420.622 59.143 338.000 584.000
Total Hardness 128.623 12.188 116.000 164.000
TDS 278.514 40.173 176.500 385.440
Total Alkalinity 151.420 7.131 138.000 170.000
Sulphates 24.679 8.608 11.770 48.280
Chlorides 25.226 7.461 11.520 51.000
Ammonia (NH3) 0.150 0.090 0.010 0.470
Nitrates (NO3) 0.336 0.311 0.010 1.220
Nitrites (NO2) 0.035 0.051 0.010 0.490
Iron 0.208 0.185 0.003 0.690
Manganese 0.016 0.017 0.002 0.064
Calcium 31.470 2.696 22.800 38.400
Magnesium 11.934 1.778 0.030 17.280
Aluminium 0.052 0.037 0.001 0.140
BOD 3.851 0.202 3.370 4.120
COD 17.013 0.177 16.580 17.470
DO 7.473 0.153 2.000 7.990
DOI: 10.4236/gep.2019.76003 34 Journal of Geoscience and Environment Protection Table 3. Principal component analysis after varimax rotation.
Variables PC1 PC2 PC3 PC4 PC5 PC6
PH 0.241 0.038 −0.085 −0.385 −0.054 0.701 Turbidity −0.124 0.455 −0.065 0.135 0.600 0.046
EC 0.902 0.134 −0.091 0.165 0.105 0.050
Total Hardness 0.887 0.149 0.046 −0.124 0.121 0.059
TDS 0.889 0.196 −0.082 0.154 0.131 0.059
Total Alkalinity 0.650 −0.529 −0.132 0.290 0.078 0.169 Sulfates 0.833 −0.115 −0.278 0.071 0.036 −0.016 Chlorides 0.818 −0.454 −0.106 0.147 0.038 −0.001 Ammonia (NH3) −0.137 −0.001 0.043 −0.130 0.853 −0.043
Nitrates (NO3) −0.674 −0.122 −0.083 0.170 −0.430 −0.205
Nitrites (NO2) −0.336 −0.183 −0.134 0.362 0.028 0.256
Iron −0.038 0.879 −0.075 −0.134 0.158 0.116 Manganese 0.088 0.819 0.007 0.090 0.038 −0.018
Calcium 0.726 0.536 0.003 −0.151 0.088 0.075 Magnesium 0.811 −0.240 0.087 −0.079 0.075 0.005 Aluminum −0.332 0.133 0.042 0.353 0.286 0.589
BOD 0.099 0.045 0.938 0.065 0.009 0.065
COD 0.096 −0.099 0.926 0.086 0.017 −0.144 DO 0.353 −0.002 0.025 −0.127 0.062 0.666
TC 0.066 0.003 −0.167 0.760 0.100 0.021
[image:9.595.206.539.96.704.2]% Variability 31.480 13.290 9.730 6.550 7.360 7.400 Cumulative percentage 31.480 44.780 54.510 61.060 68.420 75.820
DOI: 10.4236/gep.2019.76003 35 Journal of Geoscience and Environment Protection +0.99), so the study results were in accordance with Toufeek and Korium (2009).
The second principal component (PC2), accounts for 13.29%, is associated with strong loading on Iron (0.879) and Manganese (0.819), while moderate loading on Calcium (0.536). The concentration of iron and manganese recorded higher attribute due to the intense of human activities and industrial effluents from for iron and steel companies.
The third principal component (PC3) described 9.73% of the total variance had a strong positive loading on BOD (0.938) and COD (0.926). These factors loading explained the effects of organic pollution and reflect strong influence of anthropogenic activities in the area, probably from domestic waste and industrial waste. High BOD and COD levels in the study area are related to the existence of high bacterial load and organic matters as well as relative high temperatures which enhance the enumeration of bacteria. However all results of study area water sam-ples were higher than the permissible limit guidelines (COD should not exceed 10 mg/l) according to Egyptian National water quality standards, Egyptian Go-vernmental Law No. 48, 1982 regarding the protection of the River Nile and wa-terways from pollution.
Out of the total variance, 6.55% is explained by the fourth principal compo-nent (PC4), is mainly carried by TC with a positive strong correlation (0.76) that is indicators for water contamination. The high counts of total coliform might be due to pollution by industrial activities discharging their wastes to the Nile water in Cairo (Saleh, 2009). All results of Nile water samples were higher than the permissible limit guidelines (TC should not exceed 5000 cfu/100 ml) according to Tebbutt (1998).
Additionally, 7.36% of the total variance of water quality is exhibited by NH3 with a strong positive loading under the fifth principal component (PC5). NH3 is closely related to the organic matter contents of the sediment and this high amount of nutrients might also result from the application of manure in agri-cultural activities (Terceiro et al., 2008).
The six principal component (PC6), with 7.4% of the total variance, consists mainly of pH (0.701) and DO (0.701) with a moderate loading. This factor re-sulted due to the anaerobic conditions in the river from the strong loading of dissolved organic matter which leads in the formation of organic acids. pH value has an effect on the biological, chemical reactions, as well as it controls the metal ion solubility and thus it affects the natural aquatic life. The study results were in accordant with Toufeek and Korium (2009).
Based on the component loadings, the variables are grouped accordingly with their designated components as follows:
• Component 1: EC, TDS, Total Hardness, Sulfates, Chlorides, Magnesium, Calcium, Nitrates and Total Alkalinity.
DOI: 10.4236/gep.2019.76003 36 Journal of Geoscience and Environment Protection • Component 5: NH3.
• Component 6: pH and DO.
4.3. Dominant Water Quality Parameters
The dominant parameters identified by the PCA are: EC, Iron, BOD, TC, NH3 and pH (see Table 3). The previous discussion indicated that most of measured water quality parameters such as EC, TDS, Total Hardness, different major ions and Total Alkalinity, loaded with positive values, and they have strong effects on PC1. EC has the maximum strong loading value in PC1. Thus, EC is considered as a dominant parameter.
The Iron is considered as the next dominant water quality parameter as it is loaded strong in PC2 with the highest positive values. Also, the concentrations iron in the Nile water cause the exceedance of the drinking water guidelines, particularly at the anthropogenic impact points, where, iron is regulated by sec-ondary drinking water contaminant that may cause offensive taste, odor, color corrosion or staining problems (EWQS, 2007).
The BOD is considered as the third dominant water quality parameter as it is loaded strong in PC3 with highest value (0.938). These two parameters (BOD and COD) may have a strong relationship with each other, particularly the dis-charge of industrial and agricultural effluents containing a large amount of or-ganic matter (Goher et al., 2014).
The TC is considered as the fourth dominant water quality parameter as it is loaded strong in PC4 with highest value (0.760).
The Ammonia is considered as the fifth dominant water quality parameter as it is loaded strong in PC4 with highest value (0.853). Ammonia may result from fertilizers that are present in soil and it is relatively easily oxidized to nitrite and finally to nitrate (Karavoltsos et al., 2008) and it possesses a serious threat to public health.
The pH is considered as the third dominant water quality parameter as it is loaded strong in PC6 with highest value (0.701). pH value has an effect on the biological, chemical reactions, as well as it controls the metal ion solubility and thus it affects the natural aquatic life. Moreover pH could control the pathogenic microorganism growth (Zamxaka et al., 2004).
4.4. Cluster Analysis
4.4.1. Optimum Number of Clusters
FCM applied to determine the optimum number of clusters (k) that maximize the value of Fc(U) and minimizes Dc(U) (Kaufman & Rousseeuw, 1990). Table 4 illu-strates the values of Fc(U) and Dc(U) with the corresponding number of clusters.
FCM results illustrated in Table 4, it noticed that the optimum number of clusters for the study area is three clusters which satisfies the above conditions.
4.4.2. Clusters Characteristics
DOI: 10.4236/gep.2019.76003 37 Journal of Geoscience and Environment Protection in the previous step, K-means algorithm applied to produce the generalized clusters characteristics using the dominant parameters. After finding medians of clusters, the clusters are developed by assigning each object of dataset to the nearest medians of the clusters. The dissimilarities from each of the objects in the dataset from these centers of the clusters are determined using Euclidean distance. Cluster Centers are selected on the basis of the minimum distance. Sil-houette is used for interpretation and validation of clusters (Kaufman &
[image:12.595.207.540.221.352.2]Rous-seeuw, 1990). Table 5 and Figure 3 illustrate generalized characteristics mean
Table 4. Results of optimum number determination.
Number of clusters (K) F (U) Dc (U)
2 0.3333 0.9998
3 0.2500 1.0122
4 0.2000 1.0131
5 0.1667 1.0134
6 0.1429 1.0136
7 0.1250 1.0137
8 0.3333 0.9998
Table 5. Clusters centers mean values.
Dominant Parameter Cluster 1 Cluster 2 Cluster 3
PH 8.303 8.340 8.4010
Turbidity 8.052 8.5382 10.537
EC 414.611 502.888 539.111
Total Hardness 148.444 153.200 164.666
TDS 334.976 363.307 398.026
Total Alkalinity 143.222 150.622 163.777
Sulphates 23.484 25.683 27.358
Chlorides 19.777 20.300 24.777
Ammonia 0.225 0.120 0.228
Nitrates 0.497 0.531 0.684
Nitrites 0.118 0.126 0.217
Iron 0.120 0.155 0.617
Manganese 0.006 0.014 0.039
Calcium 34.022 34.302 34.666
Magnesium 10.854 11.141 11.300
Aluminium 0.069 0.043 0.068
BOD 3.792 3.852 3.944
COD 16.975 17.006 17.950
DO 7.219 7.402 7.563
[image:12.595.204.538.384.726.2]DOI: 10.4236/gep.2019.76003 38 Journal of Geoscience and Environment Protection values and the six dominant parameters mean values of the three clusters respec-tively.
It is obvious from Table 5 and Figure 3 for the K-means algorithm results, as the cluster number changed from 1 to 3, the value of the six dominant parame-ters and the water quality deterioration increased.
4.4.3. DWPs and Monitoring Stations Clusters Allocation
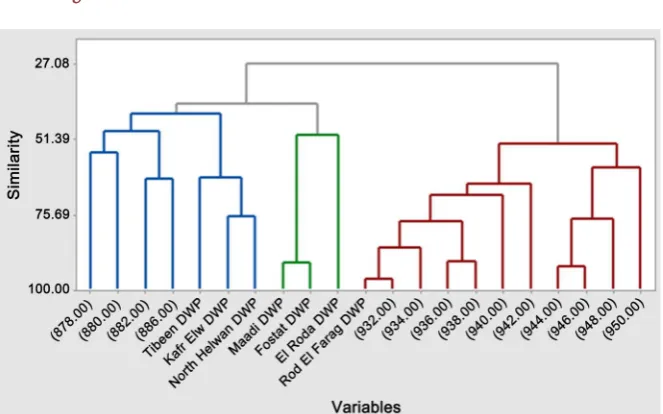
[image:13.595.232.515.234.478.2]According to the K-means algorithm generalized clusters characteristics results, the allocation for CDWPs and monitoring stations clusters were developed. The output of the cluster characteristics analysis is dispensed in dendogram, Figure 4.
Figure 3. Dominant Parameters mean values.
[image:13.595.209.541.495.702.2]DOI: 10.4236/gep.2019.76003 39 Journal of Geoscience and Environment Protection Dendogram gives the picture of the clusters describing the spatial variation in the water quality and the grouped monitoring stations, CDWPs of each cluster.
Based on the results of cluster analysis, stations and CDWPs grouped under each cluster in Figure 4, it was concluded that:
The first cluster, mainly located in the upstream of the study area with less polluted (LP) stations, included the stations from (878.00) to (868.00) and three DWPs (Tibeen, Kafr Elw and North Helwan). The changes in water quality in this cluster were mainly due to the agricultural drainage water mixed with par-tially treated or untreated domestic wastewater, industrial wastewater and waste-water from these three drinking waste-water plants sludge disposal. The second cluster, comprised only the three DWPs (Maadi, Fostat and El Roda) with moderate pollu-tion (MP), is mainly affected by the cumulative pollupollu-tion from the previous cluster in additional to the wastewater from the three mentioned drinking water plants sludge disposal. The common feature of these sites was relatively high dominant pa-rameters concentrations compared to the first cluster. The third cluster located in the downstream of the study area, included Rod El Farag DWP and the different stations from (932.00) to (950.00) along the river, had the highest pollution level (HP). These stations are distinguished from other stations concerning the level of pol-lution and have the most distance from other stations.
5. Conclusion
This study revealed the usefulness of multivariate statistical techniques for anal-ysis and interpretation of complex data sets, and in water quality assessment, understanding temporal variations in water quality management. The PCA re-vealed that six principal components (PCs) were able to explain ~75.82% of the variability and the dominant water quality parameters were total EC, Iron, BOD, TC, NH3 and pH.
In this study, a methodology for clustering twenty one locations along Nile Riv-er uses dominant watRiv-er quality parametRiv-ers. FCM indicated three as the most op-timum number of clusters. K-means clustering technique is used on the norma-lized data of the dominant parameters to obtain the generanorma-lized characteristics of three clusters. The water quality deteriorated as the cluster number increased from 1 to 3. Pattern-match using K-means clustering technique was applied to allocate clusters to all monitoring station including seven CDWPs along Nile River for two consecutive years (2017 and 2018). The Cluster analysis confirmed the existence of three types of clusters water quality (i.e. low-, medium-, and high-polluted). Ac-cording to the study methodology, the decision makers can develop optimal strat-egy in which sampling stations can be reduced, identifying the specific pollutants in source waters for designing economical, targeted and effective management for drinking water plants facilities.
Conflicts of Interest
DOI: 10.4236/gep.2019.76003 40 Journal of Geoscience and Environment Protection
References
Abd El-Daiem, S. (2011). Water Quality Management in Egypt. Journal of Water Re-sources Development, 27, 181-202.https://doi.org/10.1080/07900627.2010.531522
Adekunle, L., Adetunji, M., & Gbadebo, A. (2007). Assessment of Ground Water Quality in a Typical Rural Settlement in South Nigeria. International Journal of Environmental Research and Public Health, 4, 307-318.https://doi.org/10.3390/ijerph200704040007
Akume, D., & Weber, G.-W. (2002). Cluster Algorithms: Theory and Methods. Journal of Computational Technologies, 7, 15-27.
Cattel, R. D. (1966). The Scree Test for the Number of Factors. Multivariate Behavioral Research, 1, 245-276.https://doi.org/10.1207/s15327906mbr0102_10
CDWC (2018). Central Laboratory Annual Technical Report. Cairo Drinking Water Company.
Chatfield, C., & Collin, A. J. (1980). Introduction to Multivariate Analysis. New York: Chapman and Hall in Association with Methuen, Inc.
https://doi.org/10.1007/978-1-4899-3184-9
Davis, J. C. (2002). Statistics and Data Analysis in Geology (3rd ed.). New York: John Wiley and Sons, Inc.
Egyptian Governmental Law No. 48 (1982). The Implementer Regulations for Law 48/1982 Regarding the Protection of the River Nile and Water Ways from Pollution
(pp. 12-35). Map. Periodical Bulletin, 3-4 December.
EWQS (Egyptian Drinking Water Quality Standards) (2007). Ministry of Health, Popula-tion Decision Number 458.
Goher, M. E., Hassan, A. M., Abdel-Moniem, I. A., Fahmy, A. H., & El-Sayed, S. M. (2014). Evaluation of Surface Water Quality and Heavy Metal Indices of Ismailia Canal, Nile River, Egypt. Egyptian Journal of Aquatic Research, 40, 225-233.
https://doi.org/10.1016/j.ejar.2014.09.001
Jolliffe, I. T. (2002). Principal Component Analysis (2nd ed.). New York: Springer-Verlag. Karavoltsos, S., Sakellar, A., Mihopoulos, N., Dassenakis, M., & Scoullos, M. J. (2008). Evaluation of the Quality of Drinking Water in Regions of Greece. Desalination, 224,
317-329.https://doi.org/10.1016/j.desal.2007.06.013
Kaufman, L., & Rousseeuw, P. J. (1990). Finding Groups in Data—An Introduction to Cluster Analysis. New York: John Wiley & Sons Inc.
https://doi.org/10.1002/9780470316801
Panda, U. C., Sundaray, S. K., Rath, P., Nayak, B. B., & Bhatta, D. (2006). Application of Factor and Cluster Analysis for Characterization of River and Estuarine Water Sys-tems—A Case Study: Mahanadi River (India). Journal of Hydrology, 331, 434-445.
https://doi.org/10.1016/j.jhydrol.2006.05.029
Reghunath, R., Murthy, S. T. R., & Raghavan, B. R. (2002). The Utility of Multivariate Statistical Techniques in Hydrogeochemical Studies. An Example from Karnataka, In-dia. Water Research, 36, 2437-2442.https://doi.org/10.1016/S0043-1354(01)00490-0
Saleh, A. R. (2009). Bacteria and Viruses in the Nile. Monographiae Biologicae, 89,
407-429.https://doi.org/10.1007/978-1-4020-9726-3_20
Selim, S. Z. (1984). Soft Clustering of Multi-Dimensional Data: A Semi-Fuzzy Approach.
Pattern Recognition, 17, 559-568.https://doi.org/10.1016/0031-3203(84)90054-2
Suhr, D. (2005). Principal Component Analysis vs. Exploratory Factor Analysis. SUGI 30 Proceedings. http://www2.sas.com/proceedings/sugi30/Leadrs30.pdf
Uni-DOI: 10.4236/gep.2019.76003 41 Journal of Geoscience and Environment Protection
versity.
Terceiro, P., Lobo-Ferreira, J. P., & Leitão, T. E. (2008). Análise da qualidade da água e questões de governân-ciana Albufeirado Alqueva. Comunicaçãoapresen-tada no 9◦ Congresso da Água-Água: Desafios de hoje, exigências de amanhã. Cascais, Portugal. (In Portuguese)
http://www.aprh.pt/congressoagua2008/PDF/Lobo-FerreiraAlqueva.pdf
Toufeek, M. A., & Korium, M. A. (2009). Quality in Lake Nasser Water. Global Journal of Environmental Research, 3, 141-148.
Trauwaert, E., Kaufman, L., & Rousseeuw, P. (1991). Fuzzy Clustering Algorithms Based on the Maximum Likelihood Principle. Fuzzy Sets and Systems, 42, 213-227.
https://doi.org/10.1016/0165-0114(91)90147-I
Yu, S., Shang, J., Zhao, J., & Guo, H. (2003). Factor Analysis and Dynamics of Water Quality of the Songhua River Northeast China. Water, Air, & Soil Pollution, 144,
159-169.https://doi.org/10.1023/A:1022960300693
Zamxaka, M., Pironcheva, G., & Muyima, N. Y. O. (2004). Microbiological and Physi-co-Chemical Assessment of the Quality of Domestic Water Sources in Selected Rural Communities of the Eastern Cape Province, South Africa. Water SA, 30, 333-340.
https://doi.org/10.4314/wsa.v30i3.5081
Zeng, X., & Rasmussen, T. C. (2005). Multivariate Statistical Characterization of Water Quality in Lake Lanier, Georgia, USA. Journal of Environmental Quality, 34, 1980-1991.