Automatic Analysis of Plot for Story Rewriting
Harry HalpinSchool of Informatics University of Edinburgh
2 Buccleuch Place Edinburgh, EH8 9LW
Scotland, UK H.Halpin@ed.ac.uk
Johanna D. Moore School of Informatics University of Edinburgh
2 Buccleuch Place Edinburgh, EH8 9LW
Scotland, UK J.Moore@ed.ac.uk
Judy Robertson School of Informatics University of Edinburgh
2 Buccleuch Place Edinburgh EH8 9LW
Scotland, UK judyr@inf.ed.ac.uk
Abstract
A method for automatic plot analysis of narrative texts that uses components of both traditional sym-bolic analysis of natural language and statistical machine-learning is presented for the story rewrit-ing task. In the story rewritrewrit-ing task, an exemplar story is read to the pupils and the pupils rewrite the story in their own words. This allows them to prac-tice language skills such as spelling, diction, and grammar without being stymied by content creation. Often the pupil improperly recalls the story. Our method of automatic plot analysis enables the tu-toring system to automatically analyze the student’s story for both general coherence and specific miss-ing events.
1 Introduction
StoryStation is an intelligent tutoring system cre-ated to provide personalized attention and detailed feedback to children ages 10-12 on their writing (Roberston and Wiemar-Hastings, 2002). Writing is viewed as a skill-based task, with skills being elements of writing such as spelling, diction, and plot development. Each writing skill is associated with an animated agent that provides online help. Evaluations of StoryStation show that children en-joy the personalized encouragement and construc-tive comments that StoryStation provides (Robert-son and Cross, 2003). StoryStation was designed by researchers in conjunction with two teachers and a group of students. However, both students and teachers indicated StoryStation would be signifi-cantly improved if it were enhanced with an agent that could give feedback about the plot of a story. Here we describe how techniques from symbolic natural language processing and statistical machine-learning were used to tackle the problem of auto-mated plot analysis for StoryStation.
2 The Story Rewriting Task
In the story rewriting task, pupils rewrite a story in their own words, allowing them to focus on their writing ability instead of plot formulation. This task is currently used in Scottish schools and thus it was chosen to be the first feature of the plot analysis agent. We collected a corpus of 103 stories rewritten by children from classes at primary schools in Scot-land. Pupils were told a story, an exemplar story, by a storyteller and were asked to rewrite the story in their own words.1 The automated plot analysis program must be able to give a general rating of the quality of the rewritten story’s plot and be able to determine missing or incorrect events. The general rating can be used by the teacher to find out which pupils are in need of attention, while the more spe-cific details can be used by an animated agent in StoryStation to remind the student of specific events and characters they have forgotten or misused.
3 Plot Ratings
The stories were rated for plot by three different raters. A story-teller (RaterB) ranked all of the sto-ries. Two others (RaterA, a teacher, and RaterC) ranked the stories as well, although RaterAranked only half. The following scale, devised by a teacher with over forty years of experience, was used.
1. Excellent: An excellent story shows that the reader understands the “point” of the story and should demonstrate some deep understanding of the plot. The pupil should be able to retrieve all the important links and, not all the details, but the right details.
2. Good: A good story shows that the pupil was listening to the story, and can recall the main
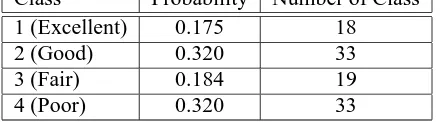
Class Probability Number of Class 1 (Excellent) 0.175 18
2 (Good) 0.320 33
3 (Fair) 0.184 19
[image:2.612.76.296.29.90.2]4 (Poor) 0.320 33
Table 1: Distribution of Story Ratings
events and links in the plot. However, the pupil shows no deeper understanding of the plot, which can often be detected by the pupil leaving out an important link or emphasizing the wrong details.
3. Fair: A fair story shows that the pupil is miss-ing more than one link or chunk of the story, and not only lacks an understanding of the “point” but also lacks recall of vital parts of the story. A fair story does not really flow.
4. Poor: A poor story has definite problems with recall of events, and is missing substantial amount of the plot. Characters will be misiden-tified and events confused. Often the child writes on the wrong subject or starts off recit-ing only the beginnrecit-ing of the story.
Rater B and RaterA had an agreement of 39% while Rater B and Rater C had an agreement of 77%. However, these numbers are misleading as the rating scale is ordinal and almost all the disagree-ments were the result of grading a story either one rank better or worse. In particular RaterAusually marked incomplete stories as poor while the other raters assigned partial credit. To evaluate the relia-bility of the grades both Cronbach’sαand Kendall’s
τbwere used, since these statistics take into account
ordinal scales and inter-rater reliability. Between Rater A and B there was a Cronbach’s α statistic of .86 and a Kendall’s τb statistic of .72. Between
Rater B and C there was a Cronbach’s α statistic of .93 and Kendall’sτbstatistic of .82. These
statis-tics show our rating scheme to be fairly reliable. As the most qualified expert to rate all the stories, Rater
B’s ratings were used as the gold standard. The dis-tribution of plot ratings are given in Table 1.
4 A Minimal Event Calculus
The most similar discourse analysis program to the one needed by StoryStation is the essay-grading component of “Criterion” by ETS technologies (Burstein et al., 2003), which is designed to anno-tate parts of an essay according to categories such as “Thesis, “Main Points,” “Support,” and “Con-clusion.” Burstein et. al. (2003) uses Rhetorical
Structure Theory to parse the text into discourse re-lations based on satellites and nuclei connected by rhetorical relations. Moore and Pollack (1992) note that Rhetorical Structure Theory conflates the infor-mational (the information being conveyed) and in-tentional (the effects on the reader’s beliefs or atti-tudes) levels of discourse. Narratives are primarily informational, and so tend to degenerate to long se-quences of elaboration or sequence relations. Since in the story rewriting task the students are attempt-ing to convey information about the narrative, un-like the primarily persuasive task of an essay, our system focuses on the informational level as embod-ied by a simplifembod-ied event calculus. Another tutoring system similar to ours is the WHY physics tutoring system (Rose et al., 2002).
We formulate only three categories to describe stories: events, event names, and entities. This for-mulation keeps the categories from being arbitrary or exploding in number. Entities are both animate characters, such as “elves” and “storks,” and inani-mate objects like “sand” and “weather.” Nouns are the most common type of entities. Events are com-posed of the relationships among entities, such as “the boy becomes an elf,” which is composed of a “boy” and “elf” interacting via “becoming,” which we call the event name. This is because the use of such verbs is an indicator of the presence of an event in the story. In this manner events are relation-ships labeled with an event name, and entities are arguments to these relationships as in propositional logic. Together these can form events such as be-come(boy,elf), and this formulation maps partially onto Shanahan’s event calculus which has been used in other story-understanding models (Mueller, 2003). The key difference between an event calcu-lus and a collection of propositions is that time is explicitly represented in the event calculus.
Each story consists of a group of events that are present in the story,e1...eh. Each event consists of
an event name, a time variablet, and a set of enti-ties arranged in an ordered set n1...na. An event
into an event, a superscript is used to keep the enti-ties distinct, asn13 is entity1in event 3. An entity
may appear in multiple events, such as entity 1 ap-pearing in event 3 (n1
3) and in event 5 (n 1
5). The plot
of a story can then be considered an event structure of the following form if it hashevents:
e1(t1,(n 1 1, n
2
1, ...na1)), ...., eh(th,(n
2
h, n
4
h...nch))
Where time t1 ≤ t2 ≤ ...th. An example from a
rewritten story is “Nils found a coin and he walked round a sandy beach. He talked to the stork. Asked a question.” This is represented by an event struc-ture as:
f ind(t= 1(N ils, coin)),
walk(t= 1,(N ils, sand, beach)), talk(t= 2,(stork, N ils)), ask(t= 3,(question))
Note that the rewritten stories are often ungram-matical. A sentence may map onto one, multiple, or no events. Two stories match if they are composed of the same ordering of events.
5 Extracting the Event Calculus
The event calculus can be extracted from raw text by layering NLP modules using an XML-based pipeline. Our main constraint was that the text of the pupil was rarely grammatical, restricting our choice of NLP components to those that did not require a correct parse or were in any other ways dependent on grammatical sentences. At each level of process-ing, an XML-enabled natural language processing component can add mark-up to the text, and use any mark-up that the previous components made. All layers in the pipeline are fully automatic. For our pipeline we used LT-TTT (Language Technology Text Tokenization Toolkit) (Grover et al., 2000). Once words are tokenized and sentence boundaries detected by LT-TTT, LT-POS tags the words using the Penn Treebank tag-set without parsing the sen-tences. While a full parse could be generated by a statistical parser, such parses would likely be incor-rect for the ungrammatical sentences often gener-ated by the pupils (Charniak, 2000). Pronouns are resolved using a cascading rule-based approach di-rectly inspired by the CogNIAC algorithm (Bald-win, 1997) with two variations. First, it resolves in distinct cascades for singular and then plural pro-nouns. Second, it resolves using only the Cog-NIAC rules that can be determined using Penn Tree-bank tags. The words are lemmatized using an aug-mented version of the SCOL Toolset and sentences are chunked using the Cass Chunker (Abney, 1995). There is a trade-off between this chunking approach that works on ungrammatical sentences and one that
requires a full parse such as those using dependency grammars. The Cass Chunker is highly precise, but often inaccurate and misses relations and enti-ties that are not in a chunk. In its favor, those tu-ples in chunks that it does identify are usually cor-rect. SCOL extracts tuples from the chunks to deter-mine the presence of events, and the remaining ele-ments in the chunk are inspected via rules for enti-ties. Time is explicitly identified using a variation of the “now point” algorithm (Allen, 1987). We map each event’s time variable to a time-line, assuming that events occur in the order in which they appear in the text. While temporal ordering of events is hard (Mani and Wilson, 2003), given that children of this age tend to use a single tense throughout the narrative and that in narratives events are presented in order (Hickmann, 2003), this simple algorithm should suffice for ordering in the domain of chil-dren’s stories.
6 Plot Comparison Algorithm
Since the story rewriting task involves imperfect re-call, story events will likely be changed or left out by the pupil. The story rewriting task involves the students choosing their own diction and expressing their own unique mastery of language, so variation in how the fundamental elements of the story are rewritten is to be expected. To deal with these is-sues, an algorithm had to be devised that takes the event structure of the rewritten story and compares it to the event structure of the exemplar story, while disregarding the particularities of diction and gram-mar. The problem is one of credit allocation for the similarity of rewritten events to the exemplar event. The words used in the events of the two story mod-els may differ. The exemplar story model might use the event see(Nils,stork), but a rewritten story may use the word “bird” instead of the more precise word “stork.” However, since the “bird” is refer-ring to the stork in the exemplar story, partial credit should be assigned. A plot comparison algorithm was created that uses abstract event calculus repre-sentations of plot and the text of the rewritten story, taking into account temporal order and word simi-larity. The exemplar story’s event structure is cre-ated by applying the event extraction pipeline to the storyteller’s transcript.
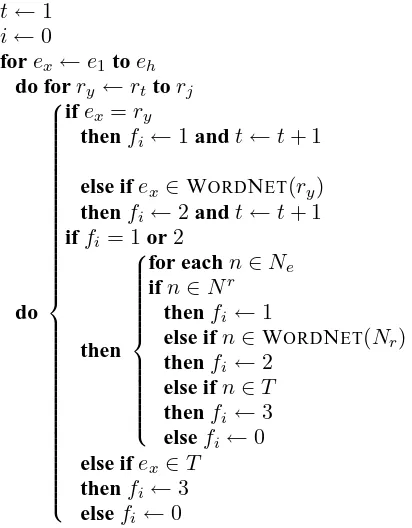
The Plot Comparison Algorithm is given in Fig-ure 1. In the pseudo-code,Eof sizehandRof size
j are the event structures of the exemplar story and rewritten story respectively, with the names of each of their events denoted aseandr. The set of entities of each event are denoted asNeandNrrespectively.
raw text.W ordN et(x) denotes the synset ofx. The “now point” of the rewritten story is t, and feature set is f, which has an index of i. The index i is incremented every timef is assigned a value. 1 de-notes an exact match, 2 a WordNet synset match, 3 a match in the text, and 0 a failure to find any match.
The Plot Comparison Algorithm essentially iter-ates through the exemplar story looking for matches of the events in the rewritten story. To find if two events are in or out of order the rewritten story has a “now point” that serves as the beginning of its it-eration. Each event of the event structure of the ex-emplar story is matched against each event of the rewritten story starting at the “now point” and us-ing the exact text of the event name. If that match fails a looser match is attempted by giving the event names of the rewritten story to WordNet and see-ing if a match to the resultant synset succeeds (Fell-baum, 1998). If either match attempt succeeds, the algorithm attempts to match entities in the same fashion and the “now point” of the rewritten story is incremented. Thus the algorithm does not looks back in the rewritten story for a match. If the event match fails, one last attempt is made by checking the event name or entity against every lemmatized token in the entire rewritten text. If this fails, a fail-ure is recorded. The results of the algorithm are can be used as a feature set for machine-learning. The event calculus extraction pipeline and the Plot Com-parison Algorithm can produce event calculus rep-resentations of any English text and compare them. They have been tested on other stories that do not have a significant corpus of rewritten stories. The number of events for an average rewritten story in our corpus was 26, with each event having an aver-age of 1 entity.
Included in Figure 2 is sample output from our algorithm given the exemplar story modeleaand a
rewritten storyrbwhose text is as follows: Nils took
the coin and tossed it away, cause it was worthless. A city appeared and so he walked in. Everywhere was gold and the merchant said Buy this Only one coin Nils has no coin. So he went to get the coin he threw away but the city vanished just like that right behind him. Nils asked the bird Hey where the city go? Let’s go home.
Due to space limitations, we only display selected events from the transcript and their most likely match from the rewritten story in Figure 2. The out-put of the feature set would be the concatenation in order of every value offe.
Algorithm
6.1: PLOTCOMPARE(E, R, T)
t←1
i←0
forex←e1toeh do forry ←rttorj
do
ifex =ry
thenfi ←1andt←t+ 1
else ifex ∈WORDNET(ry)
thenfi ←2andt←t+ 1
iffi= 1or2
then
for eachn∈Ne
ifn∈Nr
thenfi←1
else ifn∈WORDNET(Nr)
thenfi←2
else ifn∈T thenfi←3
elsefi ←0
else ifex ∈T
thenfi ←3
elsefi←0
Figure 1: Plot Comparison Algorithm
ea rb fe
[image:4.612.320.526.67.331.2]throw(Nils, coin) toss(coin) 2,3,1 see(Nils, city) appear(city) 0,3,3 enter(Nils, city) walk(Nils) 0,3,3 ask(Nils, merchant) say(merchant) 0,3,3 say(Nils) say(merchant) 1,3 leave(Nils) go(Nils) 2,1 disappear(city) vanish(city) 2,1 inquire(Nils, stork) ask(Nils, bird) 2,1,2 fly(stork) go(home) 0,3
Figure 2: Example of Plot Algorithm
7 Learning the Significance of Events
machine-learning algorithms with differing assump-tions were used. These are by no means exhaus-tive of the options, and extensive tests have been done with other algorithms. Further experiments are needed to understand the precise nature of the relations between the feature set and machine learn-ing algorithms. All results were created by ten-fold cross validation over the rated stories, which is es-pecially important given our small corpus size.
7.1 Nearest Neighbors using LSA
We can classify the stories without using the re-sults of the Plot Comparison Algorithm, and instead use only their statistical attributes. Latent Semantic Analysis (LSA) provides an approximation of “se-mantic” similarity based on the hypothesis that the semantics of a word can be deduced from its context in an entire document, leading to useful coherency scores when whole documents are compared (Foltz et al., 1998). LSA compares the text of each rewrit-ten story in the corpus for similarity to the transcript of the exemplar story in a subspace produced by reducing the dimensionality of the TASA 12 grade USA reading-level to 200. This dimensionality was discovered through experimentation to be our prob-lem’s optimal parameters for LSA given the range of choices originally used by Landauer (1997). The stories can be easily classified by grouping them to-gether based on LSA similarity scores alone, and this technique is embodied in the simpleK-Nearest Neighbors (K-NN) learner. K-NN makes no para-metric assumptions about the data and uses no for-mal symbolic features other than an LSA similarity score. ForK-NNk = 4gave the best results over a large range ofk, and we expect this kwould be ideal for stories of similar length.
As shown in Table 2, despite its simplicity this al-gorithm performs fairly well. It is not surprising that features based primarily on word distributions such as LSA could correctly discriminate the non-poor from the poor rewritten stories. Some good rewrit-ten stories closely resemble the exemplar story al-most word for word, and so share the same word distribution with the exemplar story. Poor rewritten stories usually have little resemblance to the exem-plar story, and so have a drastically different word distribution. The high spread of error in classifying stories is shown in the confusion matrix in Table 3. This leads to unacceptable errors such as excellent stories being classified as poor stories.
7.2 Hybrid Model with Naive Bayes
By using both LSA scores and event structures as features for a statistical machine learner, a hybrid model of plot rating can be created. In hybrid
mod-Class Precision Recall F-score 1 (Excellent) 0.11 0.17 0.13
2 (Good) 0.42 0.46 0.44
3 (Fair) 0.30 0.16 0.21
[image:5.612.323.532.30.88.2]4 (Poor) 0.83 0.76 0.79
Table 2:K-Nearest Neighbors Precision and Recall
Class 1 2 3 4
1 (Excellent) 3 10 4 1 2 (Good) 13 15 2 3
3 (Fair) 9 6 3 1
[image:5.612.352.504.119.189.2]4 (Poor) 2 5 1 25
Table 3:K-Nearest Neighbors: Confusion Matrix
els a formal symbolic model (the event calculus-based results of a Plot Comparison Algorithm) en-ters a mutually beneficial relationship with a statis-tical model of the data (LSA), mediated by a ma-chine learner (Naive Bayes). One way to combine LSA similarity scores and the results of the event structure is by using the Naive Bayes (NB) ma-chine learner. NB makes the assumptions of both parametrization and Conditional Independence.
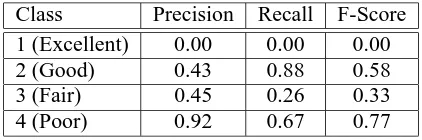
The recall and precision per rank is given in Ta-ble 4, and it is clear that while no stories are clas-sified as excellent at all, the majority of good and poor stories are identified correctly. As shown by the confusion matrix in Table 5, NB does not de-tect excellent stories and it collapses the distinction between good and excellent stories. Compared to
K-NN with LSA, NB shows less spread in its er-rors, although it does confuse some poor stories as good and one excellent story as fair. Even though it mistakenly classifies some poor stories as good, for many teachers this is better than misidentifying a good story as a poor story.
The raw accuracy results over all classes of the machine learning algorithms are summarized in Ta-ble 6. Note that average human rater agreement is the average agreement between Rater A and C
(whose agreement ranged from 39% to 77%), since Rater B’s ratings were used as the gold standard. This average also assumes RaterAwould have con-tinued marking at the same accuracy for the
com-Class Precision Recall F-Score 1 (Excellent) 0.00 0.00 0.00
2 (Good) 0.43 0.88 0.58
3 (Fair) 0.45 0.26 0.33
4 (Poor) 0.92 0.67 0.77
[image:5.612.322.533.617.687.2]Class 1 2 3 4 1 (Excellent) 0 17 1 0 2 (Good) 1 29 2 1 3 (Fair) 0 13 5 1 4 (Poor) 0 8 3 22
Table 5: Naive Bayes Confusion Matrix
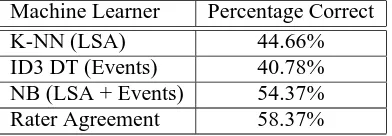
Machine Learner Percentage Correct
K-NN (LSA) 44.66%
ID3 DT (Events) 40.78% NB (LSA + Events) 54.37% Rater Agreement 58.37%
Table 6: Machine Learner Comparison
plete corpus. DT refers to an ID3 Decision Tree algorithm that creates a purely symbolic machine-learner whose feature set was only the results of the Plot Comparison Algorithm (Quinlan, 1986). It per-formed worse thanK-NN and thus the details are not reported any further. Using NB and combining the LSA scores with the results of the Plot Com-parison Algorithm produces better raw performance thanK-NN. Recall of 54% for NB may seem dis-appointing, but given that the raters only have an average agreement of 58%, the performance of the machine learner is reasonable. So if the machine-learner had a recall of 75% it would be suspect. Statistics to compare the results given the ordinal nature of our rating scheme are shown in Table 7.
8 Discussion
From these experiments as shown in Table 6 we see that the type of machine learner and the par-ticular features are important to correctly classify children’s stories. Inspection of the results shows that separating good and excellent stories from poor stories is best performed by Naive Bayes. For our application, teachers have indicated that the classi-fication of an excellent or good story as a poor one is considered worse than the classifying of a fair or even poor story as good. Moreover, it uses the event-based results of the Plot Comparison Algo-rithm so that the agent in StoryStation may use these results to inform the student what precise events and entities are missing or misused. NB is fast enough to provide possible feedback in real time and its abil-ity to separate poor stories from good and excellent stories would allow it to be used in classrooms. It also has comparable raw accuracy to average human agreement as shown in Table 6, although it makes more errors than humans in classifying a story off by more than one class off as shown by the statistics
Machine Learner Cronbach’sα Kendall’sτb
NB to RaterB .78 .59
RaterAto RaterB .86 .72 RaterCto RaterB .93 .82
Table 7: Statistical Comparison
in Table 7. The results most in its favor are shown highlighted in Table 5. It separates with few errors both excellent and good stories from the majority of poor stories.
While the event calculus captures some of the rel-evant defining characteristics of stories, it does not capture all of them. The types of stories that give the machine learners the most difficulty are those which are excellent and fair. One reason is that these sto-ries are less frequent in the training data than poor and good stories. Another reason is that there are features particular to these stories that are not ac-counted for by an event structure or LSA. Both ex-cellent stories and fair stories rely on very subtle features to distinguish them from good and poor sto-ries. Good stories were characterized in the rating criteria as “parroting off of the main events,” and the event calculus naturally is good at identifying this. Poor stories have “definite problems with the recall of events,” and so are also easily identified. However, fair stories show both a lack of “under-standing of the point” and “do not really flow” while the excellent story shows an “understanding of the point.” These characteristics involve relations such as the “point” of the story and connections between events. These ideas of “flow” and “point” are much more difficult to analyze automatically.
9 Conclusion
machine-learning unusable, the results shows that with careful feature selection and relatively simple algorithms empirical methods can be made to work. We expect that our technique can be generalized to larger corpora of diverse types.
Our hybrid system uses both LSA and event structures to classify plot quality. The use of event structures in classifying stories allows us to de-tect whether particular crucial characters and events have been left out of the rewritten story. Separating the students who have written good plots from those who have done so poorly is a boon to the teachers, since often it is the students who have the most dif-ficulty with plot that are least likely to ask a teacher for help. StoryStation is now being used in two schools as part of their classroom writing instruc-tion over the course of the next year. Results from this study will be instrumental in shaping the future of the plot analysis system in StoryStation and the expansion of the current system into a general pur-pose plot analysis system for other writing tasks.
References
Steven Abney. 1995. Chunks and dependencies: Bringing processing evidence to bear on syntax. In Jennifer Cole, Georgia Green, and Jerry Mor-gan, editors, Computational Linguistics and the Foundations of Linguistic Theory, pages 145– 164.
James Allen. 1987. Natural Language Understand-ing. Menlo Park, CA, Benjamin/Cummings Pub-lishing.
Breck Baldwin. 1997. CogNIAC : A High Preci-sion Pronoun Resolution Engine.
Jill Burstein, Daniel Marcu, and Kevin Knight. 2003. Finding the WRITE Stuff: Automatic Identification of Discourse Structure in Student Essays. IEEE Intelligent Systems, pages 32–39. Eugene Charniak. 2000. A Maximum-Entropy
In-spired Parser. In Proceedings of the North Amer-ican Association for Computational Linguistics. Christine Fellbaum. 1998. WordNet: An Electronic
Lexical Database. MIT Press, Cambridge, MA. Peter Foltz, Walter Kintsch, and Thomas Landauer.
1998. The measurement of textual coherence with Latent Semantic Analysis. Discourse Pro-cesses, 25(2&3):285–307.
Claire Grover, Colin Matheson, Andrei Mikheev, and Marc Moens. 2000. LT TTT - A Flexible Tokenisation Tool. In Proceedings of the Second Language Resources and Evaluation Conference. Maya Hickmann. 2003. Children’s Discourse: per-son, space and time across language. Cambridge University Press, Cambridge, UK.
Selma Lagerloff. 1907. The Wonderful Adventures of Nils. Doubleday, Page, and Company, Garden City, New York.
Thomas. Landauer and Susan Dumais. 1997. A so-lution to Plato’s problem: The Latent Semantic Analysis theory of the acquisition, induction, and representation of knowledge. Psychological Re-view.
I. Mani and G. Wilson. 2003. Robust temporal pro-cessing of the news. In In Proceedings of Associ-ation for ComputAssoci-ational Linguistics.
Johanna D. Moore and Martha Pollack. 1992. A problem for RST: The need for multi-level discourse analysis. Computational Linguistics, 18(4):537–544.
Erik T. Mueller. 2003. Story understanding through multi-representation model construction. In Graeme Hirst and Sergei Nirenburg, editors, Text Meaning: Proceedings of the HLT-NAACL 2003 Workshop, pages 46–53, East Stroudsburg, PA. Association for Computational Linguistics. Ross Quinlan. 1986. Induction of decision trees. In
Machine Learning, volume 1. Kluwer Academic Press.
Judy Roberston and Peter Wiemar-Hastings. 2002. Feedback on children’s stories via multiple inter-face agents. In International Conference on In-telligent Tutoring Systems, Biarritz, France. Judy Robertson and Beth Cross. 2003. Children’s
perceptions about writing with their teacher and the StoryStation learning environment. Narrative and Interactive Learning Environments: Special Issue of International Journal of Continuing En-gineering Education and Life-long Learning. C. Rose, D. Bhembe, A. Roque, S. Siler, R.
Srivas-tava, and K. VanLehn. 2002. A hybrid language understanding approach for robust selection of tu-toring goals. In International Conference on In-telligent Tutoring Systems, Biarritz, France. Murray Shanahan. 1997. Solving the Frame