Abstract—In 802.11 wireless infrastructure networks, as the mobile node moves from the current access point to another, the active connections will not be badly dropped if the hand off is smooth and if there are sufficient resources reserved in the target access point. In a 5x5 grid of access points, within a 6x6 grid of regions, by location tracking and data mining, we predict the mobility pattern of mobile node with good accuracy. The mobility prediction, active scanning of mobile nodes, along with pre-authenticating neighbouring access points is used to reduce the re-association delay, probe delay and authentication delay respectively. The model implements first stage reservation by examining packet content types and second stage reservation by using information from mobility prediction results, so that sufficient resources can be reserved when the mobile node does the handoff to the next access point. The overall mobility management scheme thus improves the quality of service and enables smooth hand off. The performance simulation is done to verify the proposed model.
Index Terms—delay management, mobility prediction, mobility management, resource reservation management.
I. INTRODUCTION
The mobility management in wireless networks is a challenging area of research as the moving node should enjoy seamless and lossless hand off in its traversal. It covers the options for storing and updating the location information of mobile users who are connected to the system and allocating the right amount of resources. Once an accurate mobile path predication can be done, the predicted path or movement can help increase the efficiency of wireless network, by effectively allocating resources to the most probable access point (that can be the next point of attachment) instead of blindly allocating excessive resources in the mobile nodes neighborhood of a mobile user [1], [2]. In this paper we want to come up with a adaptive mobility management system which could eventually make mobility on an 802.11 network more proactive with minimum loss and delay, when compared to existing schemes. This paper is organized as follows. Section 2 is the related works and technologies, section 3 is mobility management algorithm, section 4 is the mobility management process, section 5 is performance
Manuscript received January 7, 2008.
B. Issac is a PhD student with the Faculty of Engineering, University Malaysia Sarawak, 94300 Kota Samarahan, Sarawak, Malaysia (phone: +60-82-416353; fax: +60-82-423594; e-mail: [email protected]).
K. A. Hamid is with University Malaysia Sarawak, 94300 Kota Samarahan, Sarawak, Malaysia (e-mail: [email protected]).
C. E Tan is with the Faculty of Computer Science and Information Technology, University Malaysia Sarawak, 94300 Kota Samarahan, Sarawak, Malaysia (e-mail: [email protected]).
simulation results and section 6 is the conclusion. II. RELATED WORKS AND TECHNOLOGIES
Park and Dadej had proposed an Adaptive Handover Control Architecture (AHCA) in [3]. As a core part of the architecture proposed by Park, the Adaptive Handover
Engine takes inputs from several input pre-processing
modules (like network resource information from the
Network Resource Prober, traffic QoS attributes from the
Traffic Classifier, user preferences information from the
User Input Handler, and policy information from the Policy Input Handler). Then, it selects the best handover mechanism using a handover adaptation algorithm, so that the chosen handover strategy produces the best performance for the user. The architecture has been inspired by the related research in the field of Mobile IP handoff control, such as Programmable Handoffs [4], Policy-Enabled Handoffs [5], and many other adaptive or feedback-based control approaches [6], [7]. In another work, Pack has proposed a predictive authentication scheme by using a modified version of IEEE 802.1x key distribution model. Here a Frequent Handoff Region (FHR) is defined which is the adjacent APs around a mobile node.
There are two different approaches available for reducing the probe delay in 802.11 networks. They are – limiting the number of channels to be probed and reducing the waiting time for each channel to be probed. The tuning scheme is based on the latter approach and it attempts to find more appropriate or optimal MaxChannelTime and
MinChannelTime values to reduce the channel probing delay. The non-overlap graph in the NG-pruning scheme allows the channel waiting time to be shortened as the mobile node need not wait for further probe responses once it receives some probe responses from existing APs. The channel mask scheme and the NG-pruning scheme limit the number of channels to be probed by introducing the channel mask/cache and the NG, respectively. These two schemes utilize empirical handoff information to construct the cache and the NG. SyncScan and MultiScan also reduce the number of channels to be probed. But, they are not dependent on the empirical handoff information and collect information on nearby APs through continuous monitoring.
When IEEE 802.11 wireless networks are installed in public places, secure authentication becomes quite a critical issue. However, more secure authentication schemes will increase the overhead and results in longer authentication and/or re-association delays. So reducing the authentication and reassociation delay is as important as reducing the probe delay in such a case. For the schemes reducing the authentication/reassociation delay, how to propagate the
Adaptive Mobility Management in 802.11
Infrastructure Networks
mobile node context is a criterion for classification. The FHR and Proactive Neighbour Caching (PNC) Scheme schemes are based on a similar concept where there is proactive propagation of the mobile node’s context to the selected APs. But, these two approaches implement this idea in different ways. In the FHR scheme, the central node or server constructs the frequent handoff region by looking into the mobility history and profile of the mobile nodes. On the contrary, in the PNC scheme, each AP learns the mobility patterns of the mobile nodes and configures the neighbor graph in a de-centralized or distributed manner [8]-[9].
III. MOBILITY MANAGEMENT ALGORITHM
We would like to propose a micro mobility handoff mechanism that is fast and adaptive, which we call it as Adaptive Mobility Management Scheme (AMMS). The proposal in [3] was for IPv4 networks and did not use mobility prediction, delay management and pre-authentication. Here our focus is more on WLAN (802.11) installations within a restricted campus.
The mobility model used for Java simulation is a modified Random Waypoint model, where the probability of choosing a center AP in the 5 x 5 grid, is not that high. Consider the access points numbered 0 to 24, arranged in a 5 x 5 matrix form. Surrounding each access point (AP) there are four regions. These regions are numbered from R0 to R35 and is positioned around the 25 access points, as a 6 x 6 matrix as shown in the fig. 1. The mobile node can move around any AP in the surrounding four regions or can move to other adjacent regions of neighbouring AP.
A Mobile Path Prediction Server (MPPS) is connected to the Local Area Network where the access points are connected, to make the mobility prediction in a centralized way. At frequent intervals of time, the mobile node transmits the Received Signal Strength Indication (RSSI) of the surrounding APs to the MPPS.
We propose a centralized mobility prediction technique that is a hybrid version of location tracking without GPS and data mining technique. We call it Location Tracking with
Data mining Prediction Scheme (LTDPS) as in [10].
Location tracking is done through a central server that receives the data regarding neighbouring APs from the mobile node which does regular active scanning. Data mining is done by the same server by using the mobility path history of mobile node movements and by extracting mobility patterns from that. We have taken some ideas from [11], though implemented it differently. In location tracking, by seeing the details of communication of AP’s identity and RSSI value, the MPPS server can know which region the mobile node is located. All valid mobile paths by different users or mobile nodes are recorded (along with regions) in a central database in MPPS server. The Data mining approach consists of three phases: user mobility pattern mining, generation of mobility rules using the mined user mobility patterns, and the mobility prediction. The next inter-cell movement of mobile users is predicted based on the mobility rules in the last phase.
The overall mobility management algorithm is stated below that includes location tracking and data mining. 1. Initially the Mobile Node (MN) starts by associating
[image:2.595.314.540.60.285.2]with a random Access Point (AP).
Figure 1. Access Points and Mobile regions arranged in a matrix format.
2. The access points would be sending information about itself (identity, transmission channel etc) to the MPPS server. Once a MN attaches itself to the first AP, the server updates the MN about its neighbours, through the current AP. As an optional approach, the MN can have 2 wireless card interfaces –one for scanning and other for data or control transmission. If not, the MN needs to inform the current AP to buffer data, when it scans (for less than 30ms normally with optimized channel time values). The MN does frequent multi-channel active scanning (only on channels informed by the server) where it send probe requests with optimized values for
MinChannelTime and MaxChannelTime (for each
channel scanned) to locate the neighbour APs. As a response, the APs in a region would be transmitting RSSI value and other information to MN. The MN transmits the RSSI value received and the surrounding AP’s identity (maximum of 4) to MPPS Server. MN stays with that AP for t time units, where t is variable. To be precise, MN sends a packet with <RSSI_NextAP, NextAP identity, RSSI_CurrentAP, CurrentAP identity, CurrentAP Channel no., NextAP Channel no., MN identity, Packet INFO> value to MPPS Server for all the surrounding APs, where RSSI_NextAP and RSSI_CurrentAP is the RSSI values of neighbouring AP and currently attached AP to MN respectively. As each region can have maximum 4 APs and minimum 2 (or 1) APs, the right AP identity is ensured by checking the RSSI value. The channel numbers of the current and next APs are also sent (like CurrentAP Channel no. and NextAP Channel no.). Packet INFO refers to the type of packets with protocol details that is going through MN. This transmission from MN to MPPS server happens in regular intervals; say, ∆t seconds/time units.
RSSI value, RSSIregion_threshold), then the MN is in the inner region with four neighbouring APs, or if only two values are above the Next AP RSSI threshold value, then the MN is in the outer region with two neighbouring APs, or if only one value is above the Next AP RSSI threshold value, then the MN is in the corner region with only one neighbouring AP. Thus, analyzing the Next AP RSSI values by the Server would indicate to which AP the MN is getting closer. If one of the RSSI value is highest then the MN is closer to the corresponding AP, or if two of the highest RSSI values (or block values) are the same, then the MN is equally closer to those two APs, or if three or four of the RSSI values are the same, then the MN is in the center of a given region.
4. After t time units, the MN starts moving and it transmits RSSI sample to MPPS Server. Now the direction of movement of MN can be known to MPPS server, through the RSSI sample values that it receives after ∆t time units, as explained before. If n packets sent by MN are same (having RSSI values same or closer values), then the server knows that MN is stationary or moving closer to a specific AP for a period of time.
5. The MPPS server adopts data mining (that happens in parallel) to predict the next AP of MN attachment, when the RSSI sample values received in a set are similar (say, for two or more APs). Here it uses the mobile node’s past history to extract mobility patterns, where by it can come to a good judgment. Once the MN moves from one region (current region) to the other region (next region), we need to apply the formula: Current AP {all neighbor APs} ∩ Next Region {all APs} = {S}, where S is the set of probable next APs. If S contains only one element, then that is the next predicted AP or if it contains 2 or more elements, it adopts data mining to get the best possible path.
6. The MPPS server intimates n neighbouring APs (selected with high RSSI values or selected through data mining), that a particular MN may attach to it and informs about the resources needed to be reserved, which is the first-stage reservation. A copy of this notice can be sent to MN also, optionally. In the next ∆t time units, if the MN senses that the Next AP RSSI value is equal to or greater than the threshold RSSI value (RSSIregion_threshold), the MN sends a second-stage reservation to the AP, according to the type of traffic like data, voice and video. The voice and video would imply more buffer space in the second stage reservation request, unlike data that needs fewer buffers.
7. Hand off can be initiated through RSSI sample comparison or data mining. If the MN senses that the Next AP RSSI value is equal to or greater than the region threshold RSSI value (RSSIregion_threshold) and at the same time, the current AP RSSI value is diminishing, hand off can be initiated from Current AP to Next AP through MPPS server. During the hand-off, the current AP’s permission is sought to allow MN to get connected to Next AP.
8. Once the handoff is successful, the mobile node path is stored in the MPPS database or in a handoff cache.
Note: If the MN at any point is sensing that it is losing the network connection from the current AP, because of some
delay in the communication from MPPS server, the MN can initiate the handoff to the new AP, after a threshold delay. The mobile node travels in a 6 x 6 region matrix which contains 5 x 5 access point matrix. Thus the 36 regions have 25 access points placed in a matrix format as shown in figure 1. The simulation is run to create 10,000 mobile paths and this is stored in a central database of MPPS server. This data set is used for data mining and to create the mobility patterns. Later, a test set of 10 random mobile paths were created (with a maximum of six access points and a minimum of three access points) and tested for prediction accuracy. They are: Path 1: 7(8) →2(2) → 6(7) →1(1), Path 2: 13(15) →
7(8) → 1(1) → 0(0) → 6(7), Path 3: 23(27) → 17(20)
→16(19) →11(13) → 6(7), Path 4: 22(26) → 21(25) →
15(18) →16(19), Path 5: 11(13) → 5(6) → 0(0), Path 6: 14(16) → 9(10) → 8(9) → 2(2) →1(1) → 0(0), Path 7: 17(20) → 12(14) → 6(7) →11(13), Path 8: 12(14) →
11(13) → 5(6) →6(7), Path 9: 8(9) → 7(8) → 2(2) → 1(1)
→ 0(0), Path 10: 19(22) → 13(15) → 8(9) → 9(10) → 4(4)
→3(3). The values in the parenthesis are the region numbers. i.e. 7(8) means AP7 in region 8.
[image:3.595.316.539.442.560.2]The average accuracy of our mobility prediction scheme LTDPS was 76.4% as in fig. 2 [9]. We compared our prediction method with two other methods, as baseline schemes. The first prediction method is called Mobility Prediction based on Transition Matrix (TM). In this method, a cell-to-cell transition matrix is formed by considering the previous inter-cell movements of the mobile nodes or users [12]. The second prediction method is the Ignorant Prediction (IP) scheme. This approach disregards the information available from movement history [13].
Figure 2. Prediction accuracy graph for 10 random sample paths for LTDPS, TM and IP Schemes
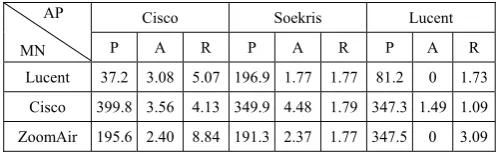
Handoff delay measured for different client wireless adapter and access points from different vendors as per [14] and [9] are as follows in table 1.
TABLE I: DELAYS IN DIFFERENT WIRELESS PRODUCTS
Cisco Soekris Lucent AP
MN P A R P A R P A R
Lucent 37.2 3.08 5.07 196.9 1.77 1.77 81.2 0 1.73
Cisco 399.8 3.56 4.13 349.9 4.48 1.79 347.3 1.49 1.09
ZoomAir 195.6 2.40 8.84 191.3 2.37 1.77 347.5 0 3.09
Legend (all in msec): P – Probe Delay; A – Authentication Delay; R – Reassociation Delay
[image:3.595.303.555.650.727.2]Authentication Delay = 2.12 ms; Average Reassociation Delay = 3.25 ms. It clearly shows that probe delay is the biggest of all delays. It is well known that for running multimedia applications in a wireless network effectively, the average handoff delay should be less than 50 ms.
[image:4.595.351.497.142.359.2]In table 2, the round trip delays between mobile node and access points are measured for different vendor products and the average round trip delay is found to be 3 ms. That means the one way delay for a normal traffic from mobile node to access point or vice versa is around 1.5 ms.
TABLE II: ROUND TRIP DELAY FROM MN TO AP Packet
send
Packet received
Min delay
Max delay
Average delay NetGear Client
adapter and D-Link AirPlus AP
1695 1449 1 ms 8 ms 2 ms
NetGear Client adapter and Linksys
AP 863 863 0 ms 1 ms 1 ms
Intel (R) Pro/Wireless 3945 ABG adapter and D-Link AirPlus AP
2847 2843 1 ms 116 ms 4 ms
Intel (R) Pro/Wireless 3945 ABG adapter
and Linksys AP 1373 1373 2 ms 40 ms 5 ms
Average round-trip delay = 3 ms
IV. MOBILITY MANAGEMENT PROCESS
Once the mobility prediction is done as section 3, there are two specific process to make the MN hand off smooth as much as possible. One is delay management and the other is the resource reservation management.
A. Delay Management
There are three delays that a mobile node faces as it moves around from one AP to another – Probe delay, Authentication and Reassociation delay as in fig. 3. These delays play an important role during the process of MN hand off to a new AP. Reducing these delays would hasten and smoothen the hand off process.
1. The access points would be sending information about itself (identity, transmission channel etc) to the MPPS server and updates the server if there is any change. Once a MN attaches itself to the first AP, the server updates the MN about its neighbours, through the AP of attachment. MN that is located in a region does active multi-channel scanning (based on information from server) where it send probe requests for each channel scanned to locate the neighbour APs and notes their AP’s RSSI values along with the channel of transmission. It sends this info to MPPS server. Once the MN moves, it already knows the channel where it located the next AP and avoids channel scans. The central MPPS server can also update the MN (in case of any change or lack of information), as the server is constantly updated of an AP’s channel of transmission. This would reduce the probe delay significantly.
2. When the MN gets connected to any AP, it would initiate authentication with all the neighbouring APs,
horizontally, vertically and diagonally. Later when it moves to another AP there would be no authentication delay, as the MN is already authenticated. Once connected to the new AP, the MN again initiates authentication with all the neighbouring APs, if it’s not pre-authenticated with that. This would reduce the authentication delay greatly.
Figure 3. 802.11 handoff process and the delays involved when a mobile node moves across access points [15].
3. Once the next AP prediction is known (based on the prediction algorithm discussed as in [10]), the process of reassociation is initiated with the confirm flag signal as FALSE. This will initiate the process but will not confirm it. Once the MN or MPPS server knows that the prediction is true, the flag signal is sent to the new AP as TRUE, only then the reassociation is confirmed. The confirm flag signal if not communicated as TRUE (within a time duration) will ensure that the prediction is wrong and that would cancel the reassociation done. Some timer can be set for the cancellation purposes. This would reduce the re-association delay.
B. Resource Reservation Management
Using the mobility prediction scheme, once the next AP is predicted, steps for resource reservation management can be done. There can be two stages in the reservation process – first stage reservation and second stage reservation.
First Stage Reservation: Based on the Type of Service or ToS field (in IPv4 packets) or Traffic Class field in combination with Flow Label field (in IPv6 packets) the packets in a network can be classified. The ToS field helps the host to specify a preference for how the datagram would be handled as it goes through the network. Some specific application protocols for audio and video can be assigned higher priority than the other protocols/applications.
[image:4.595.48.294.193.387.2]can be released for other emergencies, if any. Some fine tuning can be done here, by choosing the next AP with n
higher ranks. The actual reservation will only be done when a confirmation is given later, through a confirm flag signal.
Second Stage Reservation: In the second stage reservation, once the next AP prediction is done, the buffers are reserved (y %) on it explicitly through the MPPS server. The prediction can happen through RSSI sampling (where RSSI values are checked to be greater than a threshold value) or through data mining (especially when there are two possible paths). RSSI sampling is a confirmed process and hence in that case the reservations could be confirmed. If it’s done through data mining, the reservation can be done without confirmation, where only a blocking is done. Later as the MN moves toward a particular AP and when RSSI value is greater than the threshold RSSI value (RSSIregion_threshold), the reservation confirmation can be given through a confirm flag signal.
V. PERFORMANCE SIMULATION RESULTS
Empirical values are used as a standard to compare against the delay from simulation. The performance graphs shown are based on the estimates from existing real world models that were compared with the proposed mobility management solution through Java and OPNET simulation [16] and shows the anticipated results. For simulation, a modified version of random waypoint mobility model is used, where nodes moves equally to the sides and center.
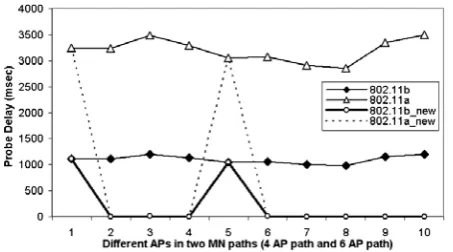
If the beacon interval is 100ms, the average probe delay of IEEE 802.11b with 11 channels is 1100 ms and 802.11a with 32 channels is 3200ms. That indicates that to probe one channel it is taking around 100ms. Fig. 4 shows the probe delays with two random mobile node paths of 4 APs and 6 APs (17→12→6→11 and 19→13→8→9→4→3). For the 2nd AP (in 4 AP path) and 5th AP (in the 6 AP path) the mobility prediction is wrong.
Figure 4. Probe delay comparison in 802.11a and 802.11b with the proposed mobility management architecture (shown as 802.11a_new/b_new) for 2 different MN paths containing 4 APs and 6APs.
The curve for the normal case is shown as the worst case, where all the channels are probed for 802.11b and 802.11a. This can be lesser when only few channels are probed (like channel 1, 6 and 11) or if configured that way. For the new proposal, the line is high initially because for the first node, the probing needs to be done for all existing channels (assuming the worst case). Later the MN gets to know all its neighbour AP (in a given region) and the channel they are transmitting, which enables it to cut down the probe delay
completely as the AP identity and channel number is already known. A normal ping or probe request from mobile node would confirm the AP’s presence and that would take on the average 3 ms to 5 ms. Except for the initial scan when a mobile node enters the wireless network, the probe delay later can be minimized to less than 10 ms. The probe delay (Tpd) of mobile node’s active scan can be expressed as, N ×
MinChannelTime≤ Tpd ≤ N × MaxChannelTime,where N is
the number of channels scanned. The optimal value of
MinChannelTime (if no response by this time, MN scan next
channel) can be around 2 to 4 ms and that of
MaxChannelTime (MN stops probing by this time, if
responses received) can be 6 to 8 ms for the multi-channel active scanning. This can speed things up.
[image:5.595.323.528.307.453.2]Since the mobile node authenticates itself with all the neighbouring access points, the authentication delay is applicable only when the MN enters the wireless network. After that there would be negligible authentication delay, as it is already authenticated to the possible next AP that it is moving to.
Figure 5. Authentication delay comparison in 802.11b and 802.11i with the proposed mobility management architecture (indicated as 802.11b_new/i_new) for 2 MN paths containing 4 APs and 6APs.
Fig. 5 shows the authentication delay comparisons for 2 MN paths of 4 access points and 6 access points. For the 2nd AP (in 4 AP path) and 5th AP (in the 6 AP path) in our proposal, the authentication delay is slightly higher than what it should be, because of wrong prediction. The curve can be seen to be rising on the initial node as normal steps of authentication need to be done. Once the MN gets connected to an AP, all the neighbouring APs are pre-authenticated. So for the next move, there is no need for authentication. The reassociation delay would follow the authentication delay that would be around 4 ms for two re-association frame (reassociation request and response) exchanges and around 10 to 12 ms when IAPP is implemented, where there would be around six frames (reassociation request and response, IAPP frames like – send security block, ACK security block, Move request, Move response) exchanged.
[image:5.595.56.283.499.625.2]first stage reservation is done based on traffic flow and type within a mobile node.
Figure 6. Resource allocation comparison in 802.11 networks (normal) and 802.11 with the proposed mobility management architecture for 2 MN paths containing 4 APs and 6APs.
[image:6.595.58.280.367.506.2]
As shown in fig. 7, the hand off is more smooth with the new proposal, as the overall delay is less than 50 ms, which is good enough for VoIP communications. The delays are obviously high for the first AP in a mobile path, as it has to scan all channels initially. Wireless packets dropped in handoff are a function of handoff delay and the amount of resources/buffers available.
Figure 7. Handoff delay comparison in 802.11 networks (normal) and 802.11 with the proposed mobility management architecture for 2 MN paths containing 4 APs and 6APs.
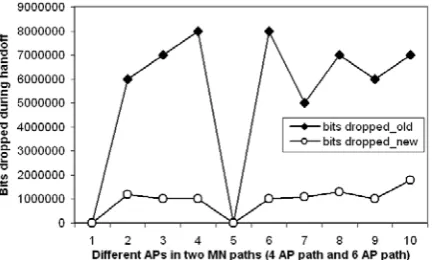
Figure 8. Comparison of bits dropped during handoff in 802.11 networks (normal) and 802.11 with the proposed mobility management architecture for 2 MN paths containing 4 APs and 6APs.
Thus the packets dropped during handoff can be reduced if the handoff delay is reduced and the available buffer size in next AP is more; i.e. bits dropped α buffer size/handoff delay. Considering a data rate of 11Mbps for 802.11b networks, the data traffic dropped is shown as in fig. 8, where there is a
great reduction in bit dropped in the new approach (which can be arranged to be buffered in current AP during handoff).
VI. CONCLUSION
We have proposed an adaptive IP mobility management scheme (AMMS) which uses mobility prediction through location tracking and data mining. It also uses fast handoff through pre-authentication, delay management and resource reservation. The architecture can be easily extended to IPv6 environment. The simulation performance graphs indicate that the approach can significantly smoothen the hand off through mobility prediction, cutting off various delays and using prior resource reservation in access points.
REFERENCES
[1] Y. Saygin, O. Ulusoy, “Exploiting data mining techniques for broadcasting data in mobile computing environments”, IEEE Transactions on Knowledge Data Engineering, 2002, pp.1387–1399.
[2] G. Gok, O. Ulusoy, “Transmission of continuous query results in mobile computing systems”, Information. Science, 2000, pp.37–63.
[3] T. Park and A. Dadej, “Adaptive Handover Control in IP-based mobility networks”, 2002.
[4] T. Park and A. Dadej, “Adaptive Handover between Terrestrial and Satellite Wireless Networks”, Proceedings of the CRCSS Conference 2002, Canberra, Australia, pp.46, February 2002. [5] H. J. Wang, R. H. Katz, and J. Giese, “Policy- Enabled Handoffs
Across Heterogeneous Wireless Networks”, Proceedings of the WMCSA’99, New Orleans, Louisiana, February 1999.
[6] C. Perkins, Editor, “IP Mobility Support for IPv4”, RFC 3344, August 2002.
[7] M. Stemm and R. H. Katz, “Vertical handoffs in wireless overlay networks”, Mobile Networks and Applications, 3(4):335-350, 1998.
[8] S. Pack and Y. Choi, “Fast Inter-AP Handoff using predictive authentication scheme in public wireless LAN”, World Scientific, July 2002.
[9] S. Pack, J. Choi, T. Kwon and Y. Choi, “Fast handoff support in IEEE 802.11 Wireless networks”, IEEE Communications Surveys and Tutorials, 2007.
[10] B. Issac, K. A. Hamid and C. E. Tan, “A Novel Mobility Prediction in 802.11 Infrastructure Networks by Location Tracking and Data Mining”, Proceedings of the 5th International Conference of Information Technology in Asia (CITA 2007), Kuching, Malaysia, 2007, pp.43-50.
[11] Yavas, G., Katsaros, D., Ulusoy, O and Manolopoulos, Y., “A data mining approach for location prediction in mobile environments”,
Data & Knowledge Engineering, 2005, pp. 121–146.
[12] S. Rajagopal, R.B. Srinivasan, R.B. Narayan, X.B.C. Petit, “GPS-based predictive resource allocation in cellural networks”, Proceedings of the IEEE International Conference on Networks (IEEE ICON’02), 2002, pp. 229–234.
[13] A. Bhattacharya, S.K. Das, “LeZi—Update: an information-theoretic approach to track mobile users in PCS networks”, ACM Wireless Networks, 2002, pp. 121-135.
[14] A. Mishra, M. Shin and W. Arbaugh, “An empirical analysis of the IEEE 802.11 MAC layer hand off process”, ACM Sigcomm Computer Communication Review, 2003, pp.93-102.
[15] H. Ping-Jung, T. Yu-Chee and T. Kun-Cheng, A Fast Handoff Mechanism for IEEE 802.11 and IAPP Networks, 63rd IEEE Vehicular Technology Conference, 2006, pp.966-970.
[image:6.595.62.281.559.689.2]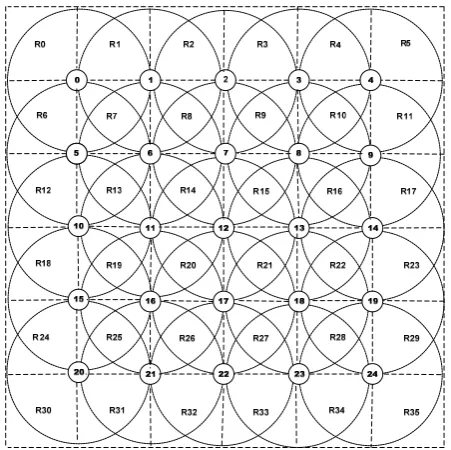
![Figure 3. 802.11 handoff process and the delays involved when a mobile node moves across access points [15]](https://thumb-us.123doks.com/thumbv2/123dok_us/1329220.663824/4.595.351.497.142.359/figure-handoff-process-delays-involved-mobile-access-points.webp)