Abstract—It is well known that multi-antenna-based
multi-input multi-output (MIMO) communications become the next revolution in wireless data communications. MIMO has gone through the adoption curve for commercial wireless systems to the today’s situation, all high throughput commercial standards, i.e. WiMax, Wi-Fi, cellular, etc., have adopted MIMO as part of the optional. This paper is to present our investigations of the behaviors of the MIMO Ultra-Wide-Band-Impulse Radio (UWB-IR) systems, which will contribute to optimal designs for the low-power high-speed data communication over unlicensed bandwidth spanning several GHz, such as IEEE 802.15 families. We have developed and analyzed three no coherent transceiver models without requiring any channel estimation procedure. The massive simulations are made based on the established models. Our investigations show that the Poisson distribution of the path arriving will affect the signal-noise ratio (SNR) and that for the Nakagami distributed multipath fading channel the “m” factor, together with receiver number, will impact on the SNR of the MIMO UWB-IR systems.
Index Terms— MIMO, WiMax, UWB-IR, Poisson distribution,
Nakagami distribution.
I. INTRODUCTION
It is recalled that multi-antenna-based multi-input multi-output (MIMO) communications first occurred in the mid-1990s when researchers at Bell Labs and Stanford were looking for ways to increase system throughput without increasing bandwidth. After that thousands of research papers have been written on the topic dealing with both physical layer and network layer ramifications of the technology. In fact all high throughput commercial standards, such as WiMax, Wi-Fi, cellular, etc., have adopted MIMO as part of the optional. The adoption of MIMO into military wireless communications systems has played important role as well as in the commercial arena.
Ultra Wide Band Impulse Radio (UWB-IR) is an emerging wireless technology, proposed for low power high speed data communication over unlicensed bandwidth. This technology has been drawing great attentions from the researchers [1-9]. Currently the transceiver architectures have been showing the tendency of extending this technology to next generation WLAN compliant operating scenarios. Therefore, exploiting both spatial and temporal diversity and combing the MIMO technology with the UWB-IR become inevitable, which becomes our motivation to this current paper.
Xu Huang is with the Faculty of Information Sciences and Engineering, University of Canberra, Australia (e-mail: [email protected]).
Dharmendra Sharma is with the Faculty of Information Sciences and Engineering, University of Canberra, Australia (e-mail: [email protected]).
It is well known that the design of a MIMO communication system depends on the degree of knowledge of the channel state information (CSI), which is normally very expensive. In this paper, as normal way did, it is based on the UWB-IR statistical channel models. We take the noncoherent transceiver [7, 16-18] and focus on wireless three models, namely Gaussian, Nakagami and log-normal distribution channels. We, in particularly, extended the previous research results [13-15] to investigate how the Nakagami m factor
impacts on the signal to noise ratio (S/N) in the statistical channel model.
The simulations under various conditions have been done in this paper, our simulations presented the following suggestions: (a) if we take so called single-cluster Poisson model [7], namely the random integer valued number, then the mean of this random integer valued number will impact on the MIMO S/N regardless which of three models (Gaussian, Nakagami and log-normal distribution channels) and (b) for the Nakagami distribution channel, as we expected that the “m” factor will impact on the MIMO S/N.
In the next section the MIMO UWB-IR statistical channels are to be investigated. Then, the models for those discussed statistical channel will be established in section 3. In section 4 simulations will be given for the investigated models in section 3. In the final section the conclusions are presented.
To insert images in Word, position the cursor at the
insertion point and either use Insert | Picture | From File or copy the image to the Windows clipboard and then Edit | Paste Special | Picture (with “Float over text” unchecked).
IMECS 2006 reserves the right to do the final formatting of your paper.
II. MIMO UWB-IR STATISTICAL CHANNELS
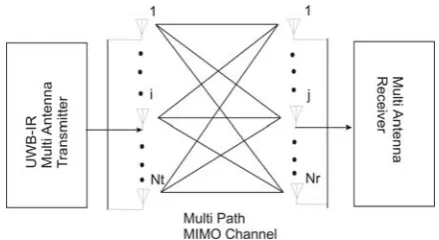
The baseband point to point (P2P), shown in Figure 1, is composed by Nt transmit and Nr receive antennas working on
an UWB-IR MIMO channel.
At the signaling period Ts second the source of Figure 1
generates an L-ary (L≥ 2) information symbol b, i.e. b∈ {0,
1, …, L -1}. The multi-antenna transmitter maps b onto Nt
M-ary baseband signals of time duration limited by Ts. It is
noted that the USB baseband pulse is limited to pulse time,
Tp, and repeated Nf times over each signaling period, Ts, here Nf is the number of frames and the time for frames of duration
denoted by Tf. In order to avoid inter-frame interference
(IFI), we must have Tf > Tμ, where Tμ is the UWB channel delay spread time.
Behaviors of MIMO UWB-IR Transceiver with
Statistical Models
Figure 1: The MIMO point to point UWB-IR system with Nt
transmit and Nr receive antennas. The MIMO UWB-IR
channel is affected by multipath fading that is described by
Nt×Nr baseband impulse channel responses.
It is well known that we have single input single output (SISO) UWB-IR channel by IEEE 802.14. If we take the impulse channel responses in Figure 1 as hji(t), 0 ≤j ≤ Nt, 0 ≤ j ≤ Nr), we may collect these impulse responses into the
corresponding (Nt× Nr) matrix H(t) [2]. Therefore, as IEEE
802.15 recommend that each SISO impulse response hji(t) in
Figure 1 is modeled as the superposition of several path clusters, with both inter-cluster and intra-cluster inter-arrival times being exponentially distributed. Hence, we have [1, 7]: 1 , 1 , here ) ) ) , ( ) , ( ) ( ) , ( 0 0 r t V n n n n V n n n ji N j N i t i j i j t i j h h ≤ ≤ ≤ ≤ − = − =
∑
∑
= = τ δ α β τ δ (1)It is noted the integer valued number V of received paths
over a signaling period Ts is a Poisson distributed random
variable with mean value E{V} = λTs, where λ is rate in
(ns)-1, τ
n is the non-negative arrival time of the nth path, in ns.
We use hn(j,i) for the nth path gain of SISO link going from
the ith transmit antenna to the jth receive one. The random
variable (r.v.) βn(j,i) ∈ {-1,1} and the non-negative r.v. αn(j,i)
are the corresponding phase and amplitude, respectively. As the previous references [1, 7, 13. 14, 15 19] show that the statistic of the fading affecting rich-scattered medium-range quasi-LOS UWB-IR links may be well modeled by resorting to the Nakagami distribution, long-normal distributed channel amplitudes, αn(j,i) may be suitable for less scattered
LOS short-range indoor propagation environments and the log-normal distribution is recommended by IEEE 802.15 workgroups for WPAN and sensor applications [1-2]. The central limit theorem [2, 20] underpin the fact that zero-mean Gaussian distributed channel coefficients well model highly scattered outdoor NLOS propagation environments.
For the space-time orthogonal PPM (OPPM) modulated the size M of the employed OPPM format equates LNt and Nt
columns of the l-th matrix codeword Φl are constituted by the Nt unit-vectors of RM with index i ranging from i = lNt to
((l+1)Nt)-1, i.e.
1
0
)],
1
)
1
((
)...
(
[
Φ
l=
e
lN
te
l
+
N
t−
≤
l
≤
L
−
(2)Because of orthogonal and unitary we have:
l
m
l
Nt l T l m T lany
for
,
I
for
,
0
=
Φ
Φ
≠
=
Φ
Φ
(3)We also have the relation between Bit-Error-Probability PE(b) and the corresponding Word Error Probability PE [7] as
shown below: E b E
P
L
L
P
)
)
1
(
2
(
) (−
=
(3)As the general equation we have the decision statistics set {zl} can be expressed by
1 0
}
max{
arg
− ≤ ≤=
Φ
L l lML
z
(4)Now we can take zl as different statistics for the three
channels we discussed above, namely Nakagami distribution, log-normal distribution and Gaussian distribution. The models for those channels will be investigated in the next section.
III. MODELS OF MIMO UWB-IR OF DIFFERENT STATISTIC
CHANNELS
We first investigate how does the r.v. parameter, V, impact
on the S/N in the above three different statistic channels? For the Nakagami distribution multipath fading channel, we have [7]:
1
0
0 1 1
−
=
=
∑∑∑
= = −L
l
,
where
l
e
n
y
z
V n N j N i i T j l r t....,
))]}
(
)
(
(
ln{cosh[
φ
(5)and φn is defended as
i)}.
(j,
E{
ln(10),
20
1
c
and
V
n
e
n n c n nα
μ
β
ϕ
μ=
=
=
=
,
0
,...,
Also as the Appendix of [7] mentioned, we have the word error probability (WEP):
∏
= ++
+
Γ
Γ
−
≤
V n N mN n n V N N E r t r tm
m
m
m
e
L
P
0 2 2
2 2 ) 1 ( 2
]
)
2
1
(
)
1
(
[
.
)
)
(
)
2
(
4
)(
1
(
β
σ
β
σ
(6)Here G(.) is the Gamma function [11, 13-15], it is noted that if r.v. V is large enough equation (5) can be simplified further
format.
We now consider the situation of log-normal distributed multipath fading, i.e. the fading amplitudes {αn(j,i)} is
log-normal distribution with m≥ 0.5, we have[16]:
(7)
Finally let’s have a closer look at the Gaussian distribution, we have [16]:
∏
=
+
+
−
≤
Vn
N N
n n E
r t
L
P
0
2 /
2 2 2
2 2
]
)
2
1
1
(
)
1
(
[
)
1
(
β
σ
β
σ
(8)
It is noted that the situation similar to equation (6) and that when r.v. V is larger than unit we can simplify equation (8).
The following section we shall present a number of simulations under different conditions to explore the behaviors of MIMO UWB-IR of different statistic channels.
IV. SIMULATIONS OF MIMO UWB-IR OF DIFFERENT
STATISTIC CHANNELS
Our target is, based above induced results, to investigate two situations that lead the optimal designs for MIMO UWB-IR communications, namely (a) because we don’t want to have expensive channel state information (CSI), we take the “single cluster Poisson Model” for capturing the behavior of each hji(t). Therefore, question occurs: how does
the r.v. V impact on the S/N of the MIMO UWB-IR
transceiver channels? (b) As Nakagami distribution is of important wireless communication distributions and the major parameter, m, will impact on the Nakagami
distributions. Hence, the second question occurs: how does the factor m of the Nakagami distribution impact on the S/N
of the MIMO UWB-IR transceiver channels?
In the following section, the massive simulations, based on above theories, are made for those two questions.
For the first question without loss generality we take simple case, L = 2, and the corresponding SISO impulse
responses {hj,i(t)}in equation (1) have been generated
according to the CM 6 UWB-IR channel model, i.e. IEEE 802.15.4 with λ = 1.13 (1/ns), Tμ = 15.9 (ns), γ = 9.3 (ns), Nf
= 8, and the spectral efficiency of 1/200 (bit/sec/Hz). The simulations first take Nr = 1 and then let Nt = 1, 2, 3 ,4, namely
investigating the MISO situations.
Under the above conditions, Figures 2, and 3 show the V =
5, 15 with Nakagami distribution multipath channels. It is clearly to show that under the same statistic distribution the random variable V has impacted on the S/N under the same
BER. For example, for the targeted BER, 10-5, when the Nt =
2 there are 1.6 dB draped and in general case it is obviously that with V increasing the S/N will significantly dropped
(Figures 2 and 3).
[image:3.595.312.527.115.248.2]Figures 4 and 5 presented the almost similar situations as that in Figures 2 and 3 except for the distribution changed from Nakagami distribution to log-normal distribution. Even though the distributions are changed from the Nakagami- to log-normal- distributions, the simulation conclusions are highly similar, which can be evidenced by the observations from Figures 4 and 5. However, it is noted that under the similar conditions log-normal distribution will cause more S/N drops if we compare the simulation results obtained from Figure 2 with that from Figure 4.
This is not surprised
as the samples increased those two distributions
approach the common nature.
Let’s have a look at Figures 6 and 7, which show the different distributions. The distribution becomes zero mean Gaussian distribution, which models highly-scattered outdoor NLOS propagation environments. It is indeed, as we observed, the more drops under the same conditions.
2 4 6 8 10 12 14 16
10−40 10−30 10−20 10−10
100
S/N
BER
V = 5
nt = 4
nt = 1 nt = 2
nt = 3
Figure 2: Nakagami distribution multipath channel with Nr
=1 and Nt = 1, 2, 3, and 4 the S/N is in “dB”.
2 4 6 8 10 12
10−50 10−40 10−30 10−20 10−10 100
S/N
BER
V=15
nt = 4
nt = 1
nt = 2
[image:3.595.308.530.273.413.2]nt = 3
Figure 3: Nakagami distribution multipath channel with Nr
=1 and Nt = 1, 2, 3, and 4 the S/N is in “dB”.
2 4 6 8 10 12 14 16
10−40 10−30
10−20
10−10 100
S/N
BER
V = 5.0
nt = 4
nt = 1
nt = 2 nt = 3
Figure 4: Log-normal distribution multipath channel with
Nr =1 and Nt = 1, 2, 3, and 4 the S/N is in “dB”.
2 4 6 8 10 12 14 16
10−40
10−30 10−20
10−10
100
S/N
BER
V = 15
nt = 1
nt = 4
nt = 3 nt = 2
Figure 5: Log-normal distribution multipath channel with
[image:3.595.315.533.458.579.2] [image:3.595.315.543.623.741.2]2 4 6 8 10 12 14 16 10−40
10−30 10−20
10−10
100
S/N
BER
V = 5
nt = 1 nt = 2
nt = 4
[image:4.595.49.283.44.486.2]nt = 3
Figure 6: Gaussian distribution multipath channel with Nr
=1 and Nt = 1, 2, 3, and 4 the S/N is in “dB”
.
2 4 6 8 10 12 14 16
10−40
10−30
10−20
10−10
100
S/N
BER
V = 15
nt = 4
nt = 1
nt = 2
nt = 3
Figure 7: Gaussian distribution multipath channel with Nr =1
and Nt = 1, 2, 3, and 4 the S/N is in “dB”.
2 4 6 8 10 12 14 16
10−40
10−30
10−20
10−10
100
S/N
BER
V = 5 & m = 0.6
nt = 4
nt = 1 nt = 2
[image:4.595.316.534.51.159.2]nt = 3
Figure 8: Nakagami distribution with m =0.6 V = 5 the rest
parameters are the same as that in previous figures.
2 4 6 8 10 12 14 16
10−40
10−30
10−20
10−10
100
S/N
BER
V = 15 & m = 0.6
nt = 4
nt = 1
nt = 2
nt = 3
Figure 9: Nakagami distribution with m =0.6 V = 15 the rest
parameters are the same as that in previous figures.
2 4 6 8 10 12 14 16
10−40
10−30
10−20
10−10
100
S/N
BER
V = 5 & m = 0.9
nt = 4
nt = 1 nt = 2
[image:4.595.313.535.199.287.2]nt = 3
Figure 10: Nakagami distribution with m =0.9 V = 5 the rest
parameters are the same as that in previous figures.
2 4 6 8 10 12 14 16
10−40
10−30
10−20
10−10
100
S/N
BER
V = 15 & m = 0.9
nt = 4
nt = 1
nt = 2
nt = 3
Figure 11: Nakagami distribution with m =0.9 V = 15 the rest
parameters are the same as that in previous figures.
2 4 6 8 10 12 14 16
10−40
10−30
10−20
10−10
100
S/N
BER
V=15 &m = 0.6 & nr = 1
nt = 4
nt = 1
nt = 2
[image:4.595.311.535.233.602.2]nt = 3
Figure 12: BER vs. S/N with the same condition as
mentioned above and Nr =1, m =0.6, V=15 for the Nakagami
distributions.
2 4 6 8 10 12 14 16
10−40
10−30
10−20
10−10
100
S/N
BER
V = 15 & m = 0.6 & nr =2
nt =1
nt =4 nt =3 nt =2
Figure 13: BER vs. S/N with the same condition as mentioned above and Nr =2, m =0.6 and V = 15 Nakagami
distributions.
2 4 6 8 10 12 14 16
10−40 10−30 10−20 10−10 100
S/N
BER
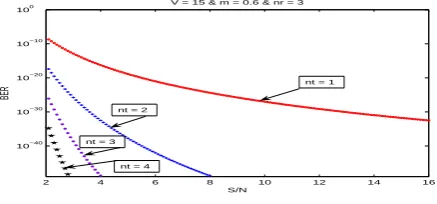
V = 15 & m = 0.6 & nr = 3
nt = 1
nt = 3
nt = 4 nt = 2
Figure 14: BER vs. S/N with the same condition as mentioned above and Nr =3, m =0.6 and V = 15 Nakagami
distributions
The observations from Figures 6 and 7 presented that as the communications is modeling for the out door the environmental situations are completed in terms of noises the impacts on the SNR would be stronger as expected.
In order to investigate how does the m factor affect the
Nakagami distribution as the above second question described, we have taken the factor m = 0.6 and 0.9 and the
random variable V = 5 and 15 and the simulations are shown
in figures 8, 9 10 and 11.
For example, for the targeted 10-5 when
Nt =2 under the
same conditions except for m = 0.6 and m = 0.9 the former
[image:4.595.315.532.338.443.2] [image:4.595.314.533.484.586.2] [image:4.595.49.285.519.736.2]the targeted 10-5, we have S/N dropped about 2 dB from m =
0.6 to m = 0.9 with the same r.v. V values.
Figures 12, 13 and 14 show the same BER vs. S/N with the comparable parameters but for receiver number, Nr = 1, 2 and
3. From those simulations we can observe that as the receiver number increasing, for the Nakagami distribution multipath communication channels, the S/N will drop because of this model (Nakagami distribution) focus on the case that the communication channel approaches to quasi-LOS, which is now deviating from the assumptions when the Nr becomes
lager.
If you are using Word, use either the Microsoft Equation
Editor or the MathType add-on (http://www.mathtype.com)
for equations in your paper (Insert | Object | Create New | Microsoft Equation or MathType Equation). “Float over
text” should not be selected.
V. CONCLUSIONS
In this paper, in order to have optimal designs for MIMO UWB-IR transceiver multipath communication channels, in particularly, under the condition of that there is no expensive CSI we have established statistic models for three major situations in MIMO UWB-IR communications. They are Nakagami distribution, log-normal distribution, and Gaussian distribution. Our paper focuses on (a) how does the random variable V affect MIMO UWB-IR multipath
communication channels? (b) If we stick with general LOS case, Nakagami fading channel, how does the major “m”
factor affect the MIMO UWB-IR communication channels? Our have presented massive simulations, based on theoretically investing, which show the answers for above questions we concerned. The simulation results also offer better information for the optimal designs for MIMO UWB-IR transceiver multipath communication channels. Finally we also investigate how the receiver number affects the MIMO UWB-IR S/N. All those results will give the optimal designs for MIMO UWB-IR transceiver multipath communication channels.
VI. REFERENCES
[1] Jeffrey Hugh Reed, “An Introduction to Ultra Wideband Communication Systems,” Prentice Hall PTR, 2005.
[2] A. F. Molishch, D. Cassion, et Alii, “A Comprehensive Standardized Model for Ultrawideband Propagation Channels,” IEEE Tr. On Antennas and Propagation, vol. 54, no. 11, pp3151 – 3166, 2006. [3] T. Ohtsuki, “Space-time Trellis Coding for UWB-IR,” Vehicular
Technology Conference, VTC 2004, Spring 2004 IEEE 59th Vol. 2,
pp1054-1058.
[4] Takahiro Ezaki and Tomoaki Ohtsuki, “Rake Performance for UWB-IR System with SISO and MISO,” IEICE Transactions on Communications 2005 E88-B(10) pp.4112-4116.
[5] Richard J. Barton and Divya Rao, “Performance Capabilities of Long-Range UWB-IR TDOA Localization Systems,” EURASIP Journal on Advances in Signal Processing Vol.2008, pp1-17.
[6] Sang-Heon Lee, Nam-Sung Kim, Heau-Jo Kang and Soon-Gohn Kim, “performance Improrement of Intelligent UWB-IR Communication System in Multipath Channel,” ICIC 2006, Spring-Verlag Berlin Heidelberg 2006, pp1103-1108.
[7] J. H. Reed, Enzo Baccarelli, Mauro Biagi, Cristian Pelizzoni, and Nicola Cordeschi, “Optimal MIMO UWB-IR Transceiver for Nakagami-fading and Poisson-Arrivals,” Journal of Communications, Vol. 3, No. 1, January 2008 pp27- 40.
[8] Sathaporn Promwong, Wataru Hanitach, Jun-ichi Takada, Pichaya Supana Koon and Prakit Tangtisanon, “Measurement and Analysis of UWB-IR Antenna Performance for WPANs,” Thammasat Int. J. Sc. Tech. Vol. 8, No.4, Oct-Dec 2003, pp56-62.
[9] Saul Rodriguez Duenas, Xinzhong Dno, Sezi Yamac, Mohammed Lsmail and Li-Rong Zheng, “ CMOS UWB IR Non-Coherent Receiver for RF-ID Applications,” Applications, Circuits and Systems, 2006 IEEE pp213-216.
[10] Xu He, Xiaoyong Peng, Yue Xiao, and Shaoqian Li, “A Novel Time and Frequency Synchronization Technique for MIMO-OFDM,” the fourth advanced international conference on telecommunications 2008, pp360- 363.
[11] J. Proakis, “Digital Communications,” Ed. 4 McGrawHill, 2001. [12] L. Yang, G. B. Giannakis, “Analog Space-Time Coding for
Multiantenna Ultra-Wideband Transmissions,” IEEE Trans. On Comm. Voil.52, no.3 , 2004 pp507-517.
[13] X. Huang and A. C. Madoc, “Image Multi-Noise Removal via Levy Process Analysis,” Lecture Notes in Coimputer Science. Spring Berlin/ Heideberg, vol 3684/2005, pp22-25.
[14] Xu Huang, “Noise Removal for Image in Nakagami Fading Channels by Wavelet-based Bayesian Estimator,” IEEE International Conference on Multimedia & Expo 2008, June 23-26, 2008 Germany , pp21-24. [15] X. Huang and A. C. Madoc, “Image and Its Noise removal in Nakagamni
Fading Channels,” IEEE 8th International Conference on Advanced
Communication Technology, Phoenix Park, Republic of Korea, Proceeding Part I, pp570 – 574.
[16] E. Baccarelli, M. Biagi, C. Pelizzoni, and N. Cordeschi, “ Non-coherent Transceiverrs for Multipath-affected MIMO UWB-IR Communications for multipath affected MIMO UWB-IR Communications,” http://infocom.uniroma1.it/~pelcris/tech.1.pdf
[17] V.V.S Nagesh Polu, B. G. Colpits, B. R. Peterson, “Symbol-wavelength MMSE gain in a multi-antenna UWB system,” IEEE Proc. Of the 4-th Annual Communication Networks ans Service Research Conference (CNSR’06), pp. 1-5.
[18] T. Ezaki, T. Ohtsuki, “ Performance Evaluation of Space Hopping Ultra Wideband Impulse Radio (SH-UWB-IR) System,” IEEE Intern. Conf. on Comm. 2004 (ICC’04), vol.6, pp3591-3595.
[19] H. Liu, C. Qiu, and Z. Tian, “Error Performance of Paulse-Based Ultra-Wideband MIMO Systems Over Indoor Wireless Channels,” IEEE Trans. On Wireless Comm., vol.4 no.6, pp2939-2944, Nov.2005. [20] C. Prettie, D. Cheung, L. Rusch, and M. Ho, “Spatial Correlation in a