Original Article
Qualitative and quantitative analysis of shear-wave
elastography in small (≤20 mm) breast masses
combined with BI-RADS category
Ming Liang1,2, Jia-Yi Wu2, Bing Ou2, Jing-Liang Ruan2, Xiao-Lin Xu2, Hai-Yun Yang2, Bao-Ming Luo2
1Guangdong Provincial Key Laboratory of Malignant Tumor Epigenetics and Gene Regulation, Guangzhou, China; 2Department of Ultrasound, Sun Yat-sen Memorial Hospital, Sun Yat-sen University, Guangzhou, China
Received March 25, 2018; Accepted July 14, 2018; Epub December 15, 2018; Published December 30, 2018
Abstract: Objective: The aim of this study was to compare grayscale ultrasound (US), shear wave elastography (SWE), and combination of US and SWE for differentiating small (≤20 mm) breast masses, and to investigate factors related to false-finding SWE result for small breast masses. Methods: The US and SWE images of 141 pathologically proven breast lesions in 122 patients were assessed. Both Breast Imaging Reporting and Data System (BI-RADS) final assessment, and qualitative and quantitative SWE measurements were assessed. US and SWE were combined according to the cutoff value. The diagnostic performance of US, SWE, and the combination of two modalities were compared using receiver-operating characteristic curve (ROC) analysis. Results: The false finding of the pattern classification and Emax only showed significant differences in mass size. The area under the curve (AUC) of ROC was 0.795 for US alone, 0.878 for US combined with pattern classification, 0.873 for US combined with Emax, and 0.918 for US combined with both pattern classification and Emax. The specificities of US alone, US combined with pattern classification, US combined with Emax, and US combined with both pattern classification and Emax were 53.1%, 77.1%, 76.0%, and 89.6% respectively (p < 0.05); and the sensitivities were 95.6%, 93.3%, 93.3% and 88.9% respectively (p>0.05). Conclusions: Mass size is the cause of false SWE in small breast masses. The combination of US and SWE has a better diagnostic performance than US alone. US combined with both pattern classification and Emax may have a higher specificity.
Keywords: Breast masses, breast imaging reporting and data system, shear wave elastography, ultrasonography, diagnosis, receiver-operating characteristic curve
Introduction
Breast cancer is currently the most common cancer in Chinese women. It is important to diagnose and treat it early [1]. Early-stage breast cancer is defined on the basis of clinical mass size of 20 mm or less without lymph node metastasis [2]. Patients with early-stage breast cancer have excellent disease-specific survival time [3, 4]. Grayscale ultrasound (US) is a use-ful tool in evaluating masses detected by mam-mography or clinical examination. A Breast Imaging Reporting and Data System (BI-RADS) lexicon for US is commonly used to describe breast masses and to differentiate benign from malignant masses, including descriptors of fea-tures such as mass shape, margin, orientation, echogenicity, and posterior acoustic features
[5]. However, substantial overlap between the sonographic features of benign and malignant masses is observed, especially in small breast masses[6, 7].
whether it was lymph node metastasis or not could affect the stiffness value [13-15]. So Jung Kim reported that when combining SWE quantitative elasticity (KPa) with US, specificity increased and sensitivity decreased (100% vs 77.3%) significantly in small (≤2 cm) breast can-cer [16]. But the author evaluated only the quantitative maximum elasticity (Emax) for SWE, in a lack of qualitative SWE analysis, and the author didn’t analyze possible clinical fac-tors of the stiffness value. Lee reported that the diagnostic performance combining the use of US, strain elasticity score, and strain ratio could increase specificity (46.4% vs 27.3%) under relatively the same sensitivity (95.8% vs 93.8%) in small breast mass [17]. Actually, little research deals with the combination of both SWE quantitative value and qualitative pattern classification to US at the same time.
Therefore, we analyzed related clinical charac-teristics of the false-negative and false-positive masses diagnosed by SWE, and evaluated the diagnostic performance of qualitative and quantitative SWE for differentiation between benign and malignant small (≤20 mm) breast masses. We also compared the diagnostic per-formance of small breast masses in using US alone, SWE alone, and the combination of the two modalities.
Material and methods
Patients
This study was reviewed and approved by the Sun Yat-sen Memorial Hospital Institutional Review Board, Sun Yat-sen University (approval number, SYSEC-KY-KS-032), and neither pa- tient approval nor informed consent was required for the review of medical records or US images. Signed informed consent was obtained from all patients prior to biopsy or surgical procedures.
Between August 2014 and June 2015, a total of 256 patients with 305 solid breast masses underwent SWE examinations. Patients were excluded as follows: mass size more than 20 mm, pregnancy, breast implants, any radiother-apy, chemotherapy or biopsy before ultrasound examinations. Finally, 122 women (mean ± SD: 43.1±13.2 y, range 18-74 y) with 141 breast masses constituted our study. The maximum
diameter of masses ranged from 3.7 to 20.0 mm (12.4±4.3 mm).
Conventional US and SWE examinations and analysis
US and SWE examinations were performed using a 4-15 MHz linear transducer (SuperSonic Imagine, Aix-en-Provence, France) by either one of the two radiologists (O.B and W.J.Y) with 13 and 4 years of experience, especially in breast elastography. At least two orthogonal gray-scale images were obtained from each breast mass. The radiologists who performed the ultrasound examinations recorded convention-al ultrasound features of the mass and made the assessment according to the BI-RADS. SWE imaging was then obtained by the same radiologist. Three separate SWE acquisitions were performed for each mass to provide assessments of elastic values. The probe was applied as lightly as possible so as not to place pressure to the mass. The probe was kept still for a few seconds until the images were stabi-lized, and meanwhile participants were asked to hold their breath to prevent motion artifacts. A square region-of-interest (ROI) box was set at the SWE color image to sufficiently include the breast mass and its surrounding breast paren-chyma. After that, tissue elasticity of ROI was obtained and saved as a color-coded map rep-resenting Young’s modulus in KPa at each pixel, with a color ranging from dark blue (soft) to red (hard; 0-180 KPa by default).
For SWE color pattern classification, two radi-ologists reviewed the images, on the basis of the four-scale classification proposed by Tozaki [18]. Disagreements on interpretation were resolved by consensus. Images were classified as: ‘pattern 1’ (if no color difference from the color around the mass was seen at the margin or in its interior, showing a homogeneously blue pattern), ‘pattern 2’ (if a color differed from the color around the mass and extended beyond it, indicating continuous vertical stripes on the cutaneous or thoracic wall side), ‘pattern 3’ (if a localized colored area was present at the mar-gin of the mass), and ‘pattern 4’ (if colored areas were present in the interior of the mass heterogeneously).
Quantitative SWE parameters were measured in each picture by using two 2-mm round. One
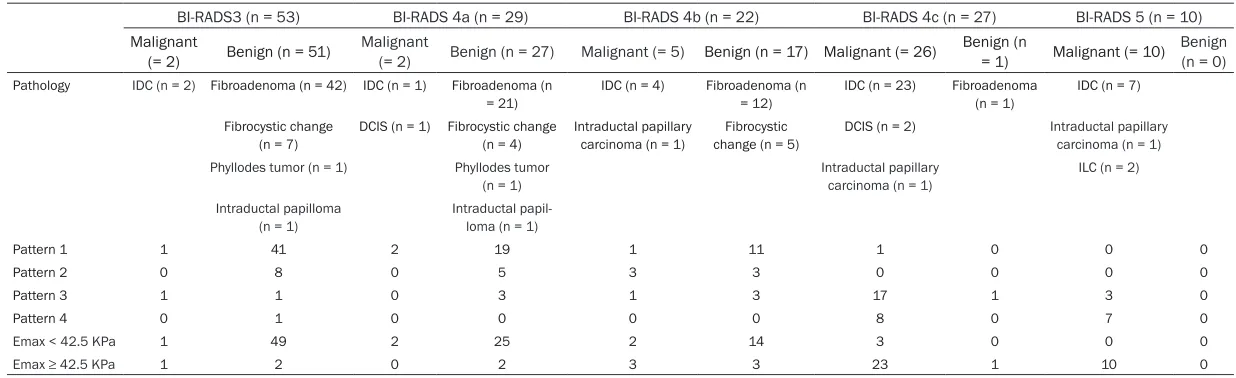
Table 1. Pathology diagnosis and SWE pattern classification and Emax in 141 breast masses according to BI-RADS category
BI-RADS3 (n = 53) BI-RADS 4a (n = 29) BI-RADS 4b (n = 22) BI-RADS 4c (n = 27) BI-RADS 5 (n = 10) Malignant
(= 2) Benign (n = 51) Malignant (= 2) Benign (n = 27) Malignant (= 5) Benign (n = 17) Malignant (= 26) Benign (n = 1) Malignant (= 10) Benign (n = 0) Pathology IDC (n = 2) Fibroadenoma (n = 42) IDC (n = 1) Fibroadenoma (n
= 21) IDC (n = 4) Fibroadenoma (n = 12) IDC (n = 23) Fibroadenoma (n = 1) IDC (n = 7) Fibrocystic change
(n = 7) DCIS (n = 1) Fibrocystic change (n = 4) Intraductal papillary carcinoma (n = 1) change (n = 5)Fibrocystic DCIS (n = 2) Intraductal papillary carcinoma (n = 1) Phyllodes tumor (n = 1) Phyllodes tumor
(n = 1)
Intraductal papillary carcinoma (n = 1)
ILC (n = 2)
Intraductal papilloma (n = 1)
Intraductal papil-loma (n = 1)
Pattern 1 1 41 2 19 1 11 1 0 0 0
Pattern 2 0 8 0 5 3 3 0 0 0 0
Pattern 3 1 1 0 3 1 3 17 1 3 0
Pattern 4 0 1 0 0 0 0 8 0 7 0
Emax < 42.5 KPa 1 49 2 25 2 14 3 0 0 0
Emax ≥ 42.5 KPa 1 2 0 2 3 3 23 1 10 0
was placed at the stiffest area of the mass including the adjacent stiff tissue and the other one at the normal fatty tissue within the ROI box. The system automatically calculated and visualized the mean elasticity (Emean), maxi-mum elasticity (Emax), and elasticity ratio (Eratio), which is the ratio of the Emean in the stiffest portion of the mass to the Emean in a similar region of interest in fat. A round ROI adjusted to the mass contours to encompass the maximum mass area was placed in the mass on the US image, and elastic modulus standard deviation (ESD) was automatically cal-culated by the system. The maximum of the three-maximum elasticity (Emax) was chosen; each median of the three Emean, Eratio and ESD for analysis.
Of the BI-RADS categories discussed, category 3 was considered negative while categories 4a and higher than 4a were considered positive. As for the qualitative SWE pattern classifica-tions, patterns 1 and 2 were considered nega-tive, while patterns 3 and 4 were considered positive according to Tozaki [18]. For quantita-tive SWE parameters, analysis of ROC curves was applied, and the area under the ROC curve (Az) employing the calculated optimal cut-off value was obtained for each SWE parameter. The best performing parameter that had the highest Az value was chosen for inclusion in this study.
Statistical analysis
An independent two-sample t-test or non-para-metric Mann-Whitney U test was used in a com-parison of continuous variables of the true and false groups. Pearson χ2 test or Fisher’s exact
test was performed to analyze group differenc-es from dichotomous variabldifferenc-es. To summarize
the overall diagnostic performance of each method, ROC curves were constructed and compared. SPSS 16.0 software (SPSS, Chicago, IL, USA) and Medcalc software version 9.6.4.0 (Medcalc Software, Mariakerke, Belgium) were used for statistical analysis, in which p < 0.05 was considered statistically significant.
Results
Pathologic diagnosis and general features
In the case of 141 small breast masses, sur-gery was performed. Forty five of 141 (32.0%) were malignant and 96 (68.0%) were benign (Table 1). The average size was 13.7 mm (range 3.7-20.0 mm) for the malignant masses and 11.8 mm (range 4.4-20.0 mm) for benign mass-es. The mean age of patients with malignant and benign masses was 52.0±10.8 years and 37.8±11.5 years, respectively, with a signifi-cant difference (p < 0.01).
Diagnostic performance of US characteristics
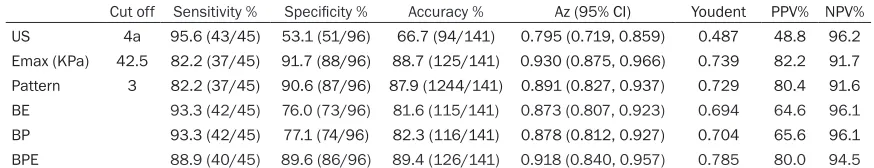
The optimal cutoff was between category 3 and category 4a, which yielded an Az of 0.795 (95% CI: 0.719-0.859). The B-mode US categories are shown in Table 1. The false-negative rate of B-mode US was 4.4% (2/45), and the false-pos-itive rate was 46.9% (45/96).
Diagnostic performance of quantitative and qualitative SWE characteristics
The Emax value with an optimal cut-off of 42.5 KPa had the highest Az value of all quantitative SWE parameters (the Az value: Emax = 0.930, ESD = 0.913, Emean = 0.913, Eratio = 0.865). The 141 breast masses consisted of 76 cases (53.9%) as pattern 1, of 19 cases (13.4%) as
Table 1. Pathology diagnosis and SWE pattern classification and Emax in 141 breast masses according to BI-RADS category
BI-RADS3 (n = 53) BI-RADS 4a (n = 29) BI-RADS 4b (n = 22) BI-RADS 4c (n = 27) BI-RADS 5 (n = 10) Malignant
(= 2) Benign (n = 51) Malignant (= 2) Benign (n = 27) Malignant (= 5) Benign (n = 17) Malignant (= 26) Benign (n = 1) Malignant (= 10) Benign (n = 0) Pathology IDC (n = 2) Fibroadenoma (n = 42) IDC (n = 1) Fibroadenoma (n
= 21) IDC (n = 4) Fibroadenoma (n = 12) IDC (n = 23) Fibroadenoma (n = 1) IDC (n = 7) Fibrocystic change
(n = 7) DCIS (n = 1) Fibrocystic change (n = 4) Intraductal papillary carcinoma (n = 1) change (n = 5)Fibrocystic DCIS (n = 2) Intraductal papillary carcinoma (n = 1) Phyllodes tumor (n = 1) Phyllodes tumor
(n = 1)
Intraductal papillary carcinoma (n = 1)
ILC (n = 2)
Intraductal papilloma (n = 1)
Intraductal papil-loma (n = 1)
Pattern 1 1 41 2 19 1 11 1 0 0 0
Pattern 2 0 8 0 5 3 3 0 0 0 0
Pattern 3 1 1 0 3 1 3 17 1 3 0
Pattern 4 0 1 0 0 0 0 8 0 7 0
Emax < 42.5 KPa 1 49 2 25 2 14 3 0 0 0
Emax ≥ 42.5 KPa 1 2 0 2 3 3 23 1 10 0
[image:4.612.88.525.99.183.2]Note: BI-RADS = breast imaging reporting and data system, IDC = invasive ductal carcinoma, DCIS = ductal carcinoma in suite, IDL = invasive lobular carcinoma, Emax = elastic modulus maximum.
Table 2. Diagnostic performance of US, pattern classification, Emax value and combined US and pat-tern classification and Emax
Cut off Sensitivity % Specificity % Accuracy % Az (95% CI) Youdent PPV% NPV% US 4a 95.6 (43/45) 53.1 (51/96) 66.7 (94/141) 0.795 (0.719, 0.859) 0.487 48.8 96.2 Emax (KPa) 42.5 82.2 (37/45) 91.7 (88/96) 88.7 (125/141) 0.930 (0.875, 0.966) 0.739 82.2 91.7 Pattern 3 82.2 (37/45) 90.6 (87/96) 87.9 (1244/141) 0.891 (0.827, 0.937) 0.729 80.4 91.6 BE 93.3 (42/45) 76.0 (73/96) 81.6 (115/141) 0.873 (0.807, 0.923) 0.694 64.6 96.1 BP 93.3 (42/45) 77.1 (74/96) 82.3 (116/141) 0.878 (0.812, 0.927) 0.704 65.6 96.1 BPE 88.9 (40/45) 89.6 (86/96) 89.4 (126/141) 0.918 (0.840, 0.957) 0.785 80.0 94.5 Note: Emax = elastic modulus maximum, BP = the combined use of US and pattern classification, BE = the combined use of US and Emax, BPE = the combined use of US and both pattern classification and Emax, AZ =UC (Az) area under the ROC curve, 95% CI 95% confidence interval. PPV
pattern 2, of 30 cases (21.3%) as pattern 3, and of 16 cases (11.3%) as pattern 4. The malignancy rate of each pattern was 6.8% (5/76) for pattern 1, 15.8% (3/19) for pattern 2, 73.3% (22/30) for pattern 3, and 93.7% (15/16) for pattern 4. The pattern classification is summarized in Table 1 and the SWE qualita-tive optimal cut-off value is shown between pat-tern 2 and 3. The sensitivity, specificity, accu-racy, Az, youdent index, PPV, and NPV of both Emax and pattern classification are shown in
Table 2. Compared to performing US alone, the specificity and the Az value of both Emax and pattern classification were significantly higher (p < 0.01), but the sensitivity decreased signifi-cantly (p < 0.01).
False-positive and false-negative lesions of SWE
When applying Emax with a cut-off level of 42.5 KPa, the false positive rate of benign breast masses was 8.3% (8/96), and the false nega-tive rate of malignant masses was 17.8% (8/45). With optimal cut-off value of pattern classification between pattern 2 and 3, the false-negative rate was 17.8% (8/45), and the false-positive rate was 9.4% (9/96). The study found that false-positive and false-negative lesions of SWE only showed a significant diff-erence in mass size: pattern classification 11.3±4.0 mm vs 16.8±1.4 mm, Emax 11.4±4.0 mm vs 16.5±1.8 mm (true-negative vs false-positive); pattern classification 14.6±4.3 mm vs 9.6±2.9 mm, Emax 14.4±4.2 mm vs 10.3± 4.4 mm (true-positive vs false-negative) (p < 0.01), regardless of patient’s age, palpability, distance to nipple or distance between mass’s surface and skin, because they were of no sta-tistical significance (p>0.05, Tables 3, 4). Table 5 listed false-negative masses. Both methods (the pattern classification and Emax.) failed to
Diagnostic performance of combined US char-acteristic and SWE charchar-acteristic
Treatment decision changes were made in accordance with the combination of US and SWE (Figure 1) where the two radiologists were asked to upgrade the BI-RADS category when the pattern was 3, 4 and/or Emax was ≥ 42.5 KPa. (i.e. to upgrade BI-RADS-US category 3 to 4a, 4a to 4b, 4b to 4c or 4c to 5). When the pat-tern was 1, 2 and/or Emax was < 42.5 KPa, the two radiologists were asked to downgrade the final BI-RADS assessment category (i.e. 5 to 4c, 4c to 4b, 4b to 4a, or 4a to 3). When a mass was downgraded from BI-RADS 4 to 3 or a mass was upgraded from BI-RADS 3 to 4, the treatment decision (follow-up or biopsy) changed accordingly. “BP combination” denot-ed the combindenot-ed use of US and pattern classifi-cation. “BE combination” indicated the com-bined use of US and Emax, whereas “BPE combination” represented the combined use of US, pattern classification and Emax (Figures 2,
3).
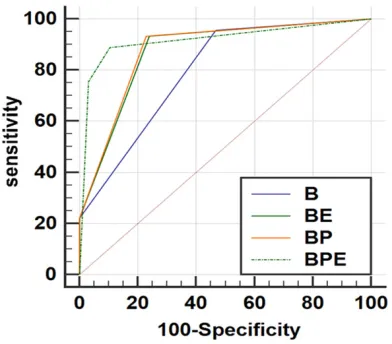
The sensitivity, specificity, accuracy, Az, Youdent index, PPV, and NPV for the BP, BE, and BPE combination are shown in Table 2. Compared to the results of using US alone, the BP, BE, and BPE combination showed higher specificity (76.0%-89.6% vs 53.1%) and higher Az (0.873-0.918 vs 0.795) (p < 0.05) (Figure 4). In addition, sensitivity (88.9%-93.3% vs 95.6%) decreased without showing a statistically sig-nificant difference (p>0.05).
[image:5.612.89.527.85.201.2]The specificity was 77.1%, 76.0%, and 89.6% for BP, BE, and BPE combination. The specifici-ty of BPE was significantly higher than BP and BE (p < 0.01). The ROC curves (0.878, 0.873, 0.918) and sensitivity (93.3%, 93.3%, 88.9%) of BP, BE, BPE were not significantly different
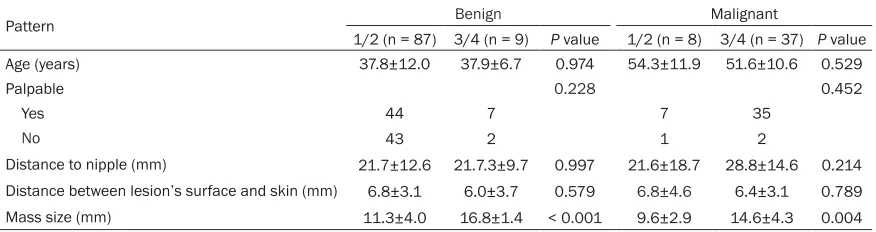
Table 3. Correlation of patient clinical factors of the masses with pattern classification findings
Pattern Benign Malignant
1/2 (n = 87) 3/4 (n = 9) P value 1/2 (n = 8) 3/4 (n = 37) P value
Age (years) 37.8±12.0 37.9±6.7 0.974 54.3±11.9 51.6±10.6 0.529
Palpable 0.228 0.452
Yes 44 7 7 35
No 43 2 1 2
Discussion
In our study, when the pattern classification optimal cutoff was between patterns 2 and 3, the false-negative rate was 17.8% and the false-positive rate was 9.4%. These results were somewhat different from many studies. For instance, Tozaki [18] et al. showed a false-negative rate of 8.7%, a false-positive rate of 19.4% and Jung Hyun Yoon et al. [19] showed a false-negative rate and a false-positive rate at 10.2% and 35.6% respectively. Their different size of masses enrolled in study may account for the varied results. The false-finding masses
[image:6.612.89.527.85.208.2]small malignant masses, necrosis did not appear in the internal component, and the hardness of the masses was relatively homoge-neous. Elseedawy found that larger fibroadeno-mas might be stiffer than smaller ones due to compression of adjacent normal tissue. Furthermore, Evans showed that smaller mass-es had higher ratmass-es of false negative Emax find-ings [21, 22]. The two studies above might sug-gest that the bigger the benign nodule was, the higher possibility of false-positive rate research-ers would receive whereas the smaller the malignant nodule was, the higher possibility of false-negative result we would find.
Table 4. Correlation of patient clinical factors of the masses with Emax findings
Emax (KPa)
Benign Malignant
< 42.5
(n = 88) ≥ 42.5 (n = 8) P value < 42.5 (n = 8) (n = 37)≥ 42.5 P value
Age (years) 37.9±11.9 37.4±7.6 0.912 54.0±11.8 51.6±10.7 0.610
Palpable 0.096 0.452
Yes 44 7 7 35
No 44 1 1 2
Distance to nipple (mm) 21.6±12.8 22.5±10.0 0.815 21.3±14.3 28.5±15.1 0.323 Distance between lesion’s surface and skin (mm) 6.7±3.1 6.1±4.0 0.596 7.8±4.8 6.2±3.0 0.225 Mass size (mm) 11.4±4.0 16.5±1.8 0.010 10.3±4.4 14.4±4.2 0.017
Table 5. False negative cases of malignant masses both pattern classification and Emax
Age (y) BI-RADS Size (mm) Pattern Emax (KPa) Pathology
1 47 4c 8.7 1 26.9 Invasive ductal carcinoma grade 1
2 47 4b 11.8 1 35.6 Invasive ductal carcinoma grade 1
3 68 4a 8.9 1 24.2 Invasive ductal carcinoma grade 3
4 39 3 5.9 1 29.0 Invasive ductal carcinoma grade 1
5 69 4a 6.4 1 29.7 Ductal carcinoma in suite
[image:6.612.91.527.250.548.2]6 62 4b 8.9 2 28.4 Invasive ductal carcinoma grade 2
Figure 1. Rules for combining US with SWE. RADS category 3, n = 1; BI-RADS category 4a, n = 2; BI-BI-RADS category 4b, n = 3, BI-BI-RADS category 4c, n = 4; BIRADS category 5, n = 5. For example, a mass was originally catego-rized as BI-RADS 3; when pattern = 3, it was categocatego-rized as BIRADS 4a by the BP combination; when Emax < 42.5 KPa, it was categorized as BI-RADS-US 3 by the BPE combination.
After adding either SWE pattern classification or Emax to US for changing BI-RADS categories. The AUC for the combined sets (0.878 for BP combination and 0.873 for BE combination) was significantly higher than that for US alone (0.795) (p < 0.05). There was no significant dif-ference in the AUC between the BP and BD
(p>0.05). This result was concordant with find-ings in previous studies demonstrating the combination of SWE and US led to a better diagnostic performance [8, 12, 23], especially in improving specificity of US. Our study shows similar results, specificity of US was significant-ly improved from 53.1% to 76.0-77.1% (p < 0.01), with a slight trade-off in terms of a decrease in sensitivity from 95.6% to 93.2% (p>0.05). Our study also showed that SWE pat-tern classification had similar diagnostic per-formance to quantitative SWE value, similar to previous reports [11, 24].
[image:7.612.90.526.73.182.2] [image:7.612.95.521.245.349.2]However, these results conflict with similar studies showing that combining SWE Emax to US, results in an Az value of combined data that is significantly lower than that of conven-tional US alone (p = 0.02) [16]. Interestingly, similar controversy has also been found in strain elastography in small breast masses: Xiao-yun Xiao showed that the diagnostic value of BI-RADS-US combining SE did not statisti-cally differ from BI-RADS-US in sub-centimeter breast masses [25], Ji Hye Lee showed that a combination of B-mode US and elasticity score Figure 2. A hypoechoic breast mass categorized as BI-RADS 3. The mass was assigned to pattern 3. The Emax was 64.4 KPa. Therefore, the mass was categorized as BIRADS 4B combining US with pattern classification and Emax. The pathology was IDC.
Figure 3. A hypoechoic breast mass categorized as BI-RADS 4B. The mass was assigned to pattern 1. The Emax was 14.1 KPa. Therefore, the mass was categorized as BIRADS 3 combining US with pattern classification and Emax. The pathology was fibroadenoma.
[image:7.612.91.287.410.582.2]have a better diagnosis than US alone in sub-centimeter breast masses [17]. Different BI-RADS interpretation and pathological type distribution may contribute to the divergent results, which require further investigation in the literature.
The SWE system could provide quantitative elastography properties, such as Emax or ESD elasticity and the qualitative SWE pattern clas-sifications of the targeted breast mass for researchers. To our knowledge, this study is the first to try to combine US with both quantitative and pattern classification in SWE at the same time. The specificity of BPE (89.6%) was signifi-cantly higher than BP (77.1%) and BD (76.0%) (p < 0.01). The application of BPE combination could ensure category 3 masses, which both pattern classification and Emax showed hard-ness, could change to biopsy; while category 4b masses, which both pattern classification and Emax showed softness, could change to follow-up. Despite the decreased sensitivity from 93.3% to 88.9%, the difference was not statis-tically significant (p>0.05). Six malignant mass-es were missed by both SWE pattern classifica-tion and Emax, including ductal carcinoma in situ (DCIS) (n = 1), IDC (n = 5) shown in Table 5. Among 5 IDCs, 4 were minimally invasive can-cers. The average size of these masses was 8.4 mm. All but one was smaller than 1 cm. Early stage of breast cancers and specific mass types such as DCIS, were reported to be the causes of false-negative elastography [14, 26]. Further studies with large population should be performed to confirm BPE combination.
The limitations of our study are as follows. First, its design is retrospective. The study is also constrained by the small number of malignant masses, and the inadequate false negative SWE pattern or Emax value. Second, in our study, two radiologists reached a consensus on various imaging features of small breast mass-es. Thus, no inter- and intra-observer bias of SWE pattern classification can be calculated. Third, we did not assess breast thickness or density, and failed to consider other factors of affecting stiffness.
Conclusion
SWE is a valuable tool for early diagnosis of small breast masses. Mass size is the cause of false SWE in small breast masses. For small
breast masses, combining US with both pattern classification and Emax has a higher specificity than US alone, BP, and BE.
Acknowledgements
This study was supported in part by grant 2017A030313727 from the Science Foundation of Guangdong Province.
Disclosure of conflict of interest
None.
Address correspondence to: Bao-Ming Luo, Depart- ment of Ultrasound, Sun Yat-sen Memorial Hospital, Sun Yat-sen University, Guangzhou 510120, China. Tel: +86 18922182861; Fax: +86-20-81332496; E-mail: [email protected]
References
[1] Fan L, Strasser-Weippl K, Li JJ, St Louis J, Fin-kelstein DM, Yu KD, Chen WQ, Shao ZM, Goss PE. Breast cancer in China. Lancet Oncol 2014; 15: e279-89.
[2] Suzuki T, Toi M, Saji S, Horiguchi K, Aruga T, Suzuki E, Horiguchi S, Funata N, Karasawa K, Kamata N. Early breast cancer. Int J Clin Oncol 2006; 11: 108-19.
[3] Tabar L, Tony Chen HH, Amy Yen MF, Tot T, Tung TH, Chen LS, Chiu YH, Duffy SW, Smith RA. Mammographic tumor features can predict long-term outcomes reliably in women with 1-14-mm invasive breast carcinoma. Cancer 2004; 101: 1745-59.
[4] Tabár L, Chen HH, Duffy SW, Yen MF, Chiang CF, Dean PB, Smith RA. A novel method for pre-diction of long-term outcome of women with T1a, T1b, and 10-14 mm invasive breast can-cers: a prospective study. Lancet 2000; 355: 429-33
[5] Radiology ACo Committee B-R. ACR BI-RADS breast imaging and reporting data system: breast imaging atlas, American college of radi-ology, 2013.
[6] Korpraphong P, Tritanon O, Tangcharoensath-ien W, Angsusinha T, Chuthapisith S. Ultraso-nographic characteristics of mammographi-cally occult small breast cancer. J Breast Cancer 2012; 15: 344-9.
[7] Cha JH, Moon WK, Cho N, Chung SY, Park SH, Park JM, Han BK, Choe YH, Cho G, Im JG. Dif-ferentiation of benign from malignant solid breast masses: conventional US versus spatial compound imaging. Radiology 2005; 237: 841-46.
Mendel-son EB, Balu-Maestro C, Locatelli M, Tourasse C, Cavanaugh BC, Juhan V, Stavros AT, Tardivon A, Gay J, Henry JP, Cohen-Bacrie C; BE1 Inves-tigators. Shear-wave elastography improves the specificity of breast US: the BE1 multina -tional study of 939 masses. Radiology 2012; 262: 435-49.
[9] Shi XQ, Li JL, Wan WB, Huang Y. A set of shear wave elastography quantitative parameters combined with ultrasound BI-RADS to assess benign and malignant breast lesions. Ultra-sound Med Biol 2015; 41: 960-6.
[10] Youk JH, Son EJ, Gweon HM, Kim H, Park YJ, Kim JA. Comparison of strain and shear wave elastography for the differentiation of benign from malignant breast lesions, combined with B-mode ultrasonography: qualitative and qu-antitative assessments. Ultrasound Med Biol 2014; 40: 2336-44.
[11] Gweon HM, Youk JH, Son EJ, Kim JA. Visually assessed color overlay features in shear-wave elastography for breast masses: quantification and diagnostic performance. Eur Radiol 2013; 23: 658-63.
[12] Youk JH, Gweon HM, Son EJ, Han KH, Kim JA. Diagnostic value of commercially available shear-wave elastography for breast cancers: integration into BI-RADS classification with subcategories of category 4. Eur Radiol 2013; 23: 2695-704.
[13] Chang JM, Park IA, Lee SH, Kim WH, Bae MS, Koo HR, Yi A, Kim SJ, Cho N, Moon WK. Stiff-ness of tumours measured by shear-wave elas-tography correlated with subtypes of breast cancer. Eur Radiol 2013; 23: 2450-8.
[14] Evans A, Whelehan P, Thomson K, McLean D, Brauer K, Purdie C, Baker L, Jordan L, Rauch-haus P, Thompson A. Invasive breast cancer: relationship between shear-wave elastograph-ic findings and histologelastograph-ic prognostelastograph-ic factors. Radiology 2012; 263: 673-7.
[15] Athanasiou A, Tardivon A, Tanter M, Sigal-Zaf -rani B, Bercoff J, Deffieux T, Gennisson JL, Fink M, Neuenschwander S. Breast lesions: quanti -tative elastography with supersonic shear im-aging--preliminary results. Radiology 2010; 256: 297-303.
[16] Kim SJ, Ko KH, Jung HK, Kim H. Shear wave elastography: is it a valuable additive method to conventional ultrasound for the diagnosis of small (≤2 cm) breast cancer? Medicine (Balti -more) 2015; 9: e1540.
[17] Lee JH, Kim SH, Kang BJ, Choi JJ, Jeong SH, Yim HW, Song BJ. Role and clinical usefulness of elastography in small breast masses. Acad Radiol 2011; 18: 74-80.
[18] Tozaki M, Fukuma E. Pattern classification of shear wave elastography images for differen-tial diagnosis between benign and malignant solid breast masses. Acta Radiol 2011; 52: 1069-75.
[19] Yoon JH, Ko KH, Jung HK, Lee JT. Qualitative pattern classification of shear wave elastogra -phy for breast masses: how it correlates to quantitative measurements. Eur J Radiol 2013; 82: 2199-204.
[20] Kim MY, Choi N, Yang JH, Yoo YB, Park KS. False positive or negative results of shear-wave elastography in differentiating benign from malignant breast masses: analysis of clinical and ultrasonographic characteristics. Acta Radiol 2015; 56: 1155-62.
[21] Elseedawy M, Whelehan P, Vinnicombe S, Thomson K, Evans A. Factors influencing the stiffness of fibroadenomas at shear wave elas -tography. Clin Radiol 2016; 71: 92-5.
[22] Evans A, Sim YT, Thomson K, Jordan L, Purdie C, Vinnicombe SJ. Shear wave elastography of breast cancer: sensitivity according to histo-logical type in a large cohort. Breast 2016; 26: 115-8.
[23] Evans A, Whelehan P, Thomson K, Brauer K, Jordan L, Purdie C, McLean D, Baker L, Vinni-combe S, Thompson A. Differentiating benign from malignant solid breast masses: value of shear wave elastography according to lesion stiffness combined with greyscale ultrasound according to BI-RADS classification. Br J Can -cer 2012; 107: 224-9.
[24] Park J, Woo OH, Shin HS, Cho KR, Seo BK, Kang EY. Diagnostic performance and color overlay pattern in shear wave elastography (SWE) for palpable breast mass. Eur J Radiol 2015; 84: 1943-8.
[25] Xiao X, Jiang Q, Wu H, Guan X, Qin W, Luo B. Diagnosis of sub-centimetre breast lesions: combining BI-RADS-US with strain elastogra-phy and contrast-enhanced ultrasound-a pre-liminary study in China. Eur Radiol 2016; 27: 2443-2450.