30
An Interactive Web-Interface for Visualizing the Inner Workings of the
Question Answering LSTM
Ekaterina Loginova
DFKI / Saarbr¨ucken, Germany [email protected]
G ¨unter Neumann
DFKI / Saarbr¨ucken, Germany [email protected]
Abstract
Deep learning models for NLP are potent but not readily interpretable. It prevents re-searchers from improving a model’s perfor-mance efficiently and users from applying it for a task which requires a high level of trust in the system. We present a visualisation tool which aims to illuminate the inner workings of a specific LSTM model for question answer-ing. It plots heatmaps of neurons’ firings and allows a user to check the dependency between neurons and manual features. The system pos-sesses an interactive web-interface and can be adapted to other models and domains.
1 Introduction
Deep learning models have gained popularity in the last years due to their state-of-the-art per-formance combined with an end-to-end pipeline. However, even though these models do not require manual feature engineering, this advantage turns into a shortcoming when it comes to the interpre-tation of the model. Neural networks are consid-ered black boxes by the majority of their users. Such low interpretability leads to a low level of trust in the system’s decisions. Therefore, meth-ods for interpreting neural networks are attracting increasing interest due to their need for practical applications.
Existing visualisation methods mainly focus on computer vision tasks. It raises the issue that not all of them can be easily adapted to the NLP do-main since text preprocessing operates with no-ticeably different units. Furthermore, while some neural architectures such as CNNs, provide rela-tively clear feature illustrations, this is not the case for RNNs, which are dominant for many text pro-cessing tasks. Few researchers have addressed the issue of visualising the inner workings of RNNs, especially in an interactive way.
Our ultimate goal is to allow a researcher to check how interpretable the features in an RNN are automatically. The first step would be to check the dependency between a given manual feature and the features produced by the deep learning model. The next one is to develop a method to ex-tract structural patterns from uninterpretable fea-tures. The last step would be to generate sugges-tions that would explain such patterns automati-cally. In this work, we address the first step and supply a visualisation tool for manually carrying out the second step.
This paper is a report on the visualisation sys-tem for LSTMs in the area of question answering. We present a new interactive web-interface which currently focuses on a specific system but can po-tentially be adapted to other models and domains. The proposed system aims to aid the development of deep learning models in NLP by providing a tool for data visualisation.
The paper is divided into three sections. The first section provides a brief overview of the re-lated work. The system is described in the second section, and our conclusions are drawn in the final section.
2 Related work
A considerable amount of literature has been pub-lished on neural attention models (Vaswani et al.,
2017; Li et al., 2015b). Most of them contain heat maps to illustrate the work of the attention mechanism. These plots provide insight into what the model sees as the more important parts of the sentence when making a prediction. For in-stance, self-attention might learn patterns related to syntactical properties of the text (Vaswani et al.,
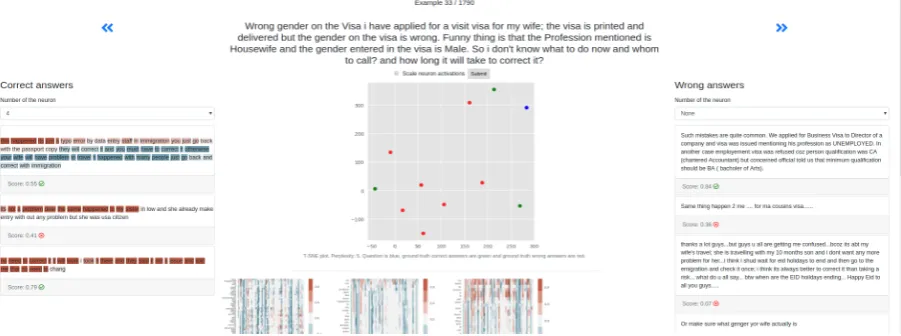
sequence-to-Figure 1: The second part of the interface. Left and right columns contain the ground truth correct and wrong answers respectively, highlighted according to a chosen neuron. The question is stated in the middle, a t-SNE plot is given under it. The heatmaps of neuron activations are placed below.
sequence architectures (Lee et al., 2017). Such systems include visualisations of the search tree for the beam search along with attention.
More recent research by (Karpathy et al.,2015) reveals that a small percentage of cells in LSTM learns interpretable patterns. For instance, a cell might correspond to the position in the line, indi-cate the depth of the nested structure or turn on inside quotes. Our system is greatly inspired by this research.
In (Li et al., 2015a) authors investigate vi-sualisations of compositionality in NLP, basing their work on computer vision approaches. They provide t-SNE (van der Maaten and Hinton,
2008) plots for clause compositions and introduce saliency heatmaps. The latter indicates how neu-rons contribute to the final decision based on the first order derivatives.
Moreover, (Strobelt et al.,2016) demonstrated a system for visual analysis of hidden state dy-namics in recurrent neural networks. The system, called LSTMVis, allows the researcher to check the hypothesis about local state changes against a similar pattern in the entire dataset, and align it with the textual annotations.
Finally, (Jia and Liang,2017) show that a ques-tion answering system can be surprisingly unreli-able when presented with artificial adversarial ex-amples. They suggest that this can happen be-cause a neural network learns heuristics, which are easy to fool. Hence, we hypothesise that a system which uses meaningful (from a human perspec-tive) features might not only be more user-friendly but also demonstrate higher robustness.
3 System
Our system consists of two different interfaces. The first one visualises the scores and attention distribution produced by the model on answers to a user-defined question. The second one allows a user to iterate through fixed question-answer pairs to investigate the inner workings of a model. These inner workings are displayed in three sepa-rate views: General, Neuron and Correlation. In the General one, a user can observe t-SNE plots and heat maps for all neurons on the texts of the current question-answer pair from the dataset (see Figure1for the layout demonstration). In the Neu-ron view, the user can investigate the behaviour of one particular neuron further. Finally, in the Cor-relation part, the user can see the statistical mea-sures for the dependency between a chosen man-ual feature and all neurons.
3.1 Deep learning model
[image:2.595.74.525.66.234.2](Nakov et al., 2017). The word embeddings are word2vec (Mikolov et al.,2013) of dimension 300 pre-trained on Google News. The texts are lower-cased and tokenised using built-in Keras functions. Generally speaking, any pre-trained Keras model involving an attention mechanism and an LSTM can be loaded into the interface. The only requirement would be to provide the layer names to retrieve softmax attention scores and LSTM weights.
3.2 Key features
A pre-trained model is loaded from a Keras check-point: the weights are obtained from a .h5 file and the architecture from a .json. In case of an error, a message is shown to the user with the description. The dataset with the texts of question-answer pairs is loaded in either of two ways (denoted as D-I and D-II). It can be preloaded from a custom pickle file containing a pandas data frame. This method is suitable if the candidate answers are known at the test phase. Otherwise, the dataset can be saved into an index schema of documents which is com-patible with the Whoosh (Chaput,2007) library. This will allow the system to retrieve candidate answers based on a keyword match. It should be noted that it is relatively easy to modify the code to load other datasets as long as they have the fields pool (array of incorrect answer ids), answer ids (array of correct answer ids), question (question text) and answer (candidate answer text). Lastly, pre-trained word embeddings and the tokeniser are loaded from pickled Keras objects.
[image:3.595.307.523.69.251.2]Candidate answer retrieval and scoring. To begin with, the system receives a question from the user via a text field input. The question is filtered by length: too long or empty questions are dis-carded. Then, it is preprocessed to exclude out-of-vocabulary (OOV) words. In addition, it is spell-checked by the Whoosh library. If the question contains words which lemmata are not in the vo-cabulary of the system, a warning is displayed. As mentioned at the beginning of this section, our sys-tem is separated into two interfaces depending on whether the question can be formulated by the user or it is fixed in advance. The answers in the first part are sorted by their score. In case the question was present in the dataset, and we know the cor-rect answer, we mark its text with a star icon for a quicker performance assessment by the user. The second interface allows the user to iterate through
Figure 2: The heatmap of attention scores.
the fixed question-answer pairs to investigate the inner workings of the model. The answers in this part are separated into columns, where the left col-umn contains the ground truth correct answers and the right one the ground truth incorrect answers. The prediction of the model is illustrated with an icon (cross mark for predicting the answer as in-correct, checkmark for the correct), and the origi-nal score is also displayed. This leads to a clearer picture of the mistakes the model makes, which will hopefully help researchers in eliminating pos-sible sources of errors.
In D-II setting, after that, Whoosh’s Multifield-Parser processes the question and attempts to re-trieve candidate answers. If no candidates are found at this step, it extends the search by also checking the answer texts corresponding to the questions in the index. In other words, it checks not only the question-question similarity but also answer-question. If still no results are retrieved, the user receives an appropriate error message with a prompt to reformulate his question. If can-didate answers were found, they are preprocessed. At this step, custom modifications, such as remov-ing punctuation, can be added. In D-I settremov-ing, the candidate answers are provided and thus retrieved directly.
After that, the pre-trained deep learning model is applied to the texts of the question and the can-didate answers to receive their scores. In our case, those are cosine similarities between LSTMs em-beddings of the question and the candidate answer.
atten-tion mechanism. In this part, we follow a tradi-tional approach of using a heat map on the text. Words are highlighted in red based on their atten-tion scores: the higher the score, the more intense the colour. The attention scores used in deciding the opacity of the colour are scaled to make them more visible. A user can still see the exact score of the word in a tooltip by hovering over it. Op-tionally, the user can adjust the attention threshold
Ato only highlight words with an attention score higher thanA. Figure2shows an example of the attention visualisation.
t-SNE. Another part of the visualisations is spe-cific to the model we currently use. The objective of this model is to learn a mapping to a new em-bedding space where the question has a smaller cosine distance to its correct answers than to the incorrect ones. In order to investigate the resulting space, we plot a t-SNE projection of the LSTM output embeddings on each QA-pair. The red dots correspond to the wrong answers, green - the cor-rect ones and blue - the question. The perplexity parameter, which is known to affect the meaning-fulness of t-SNE plots greatly, can be adjusted by the user with a corresponding text field input. The default value is 5.
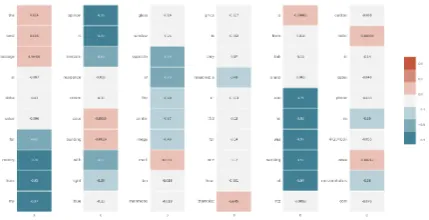
Weights visualisation. Besides visualising at-tention, we develop an idea proposed by ( Karpa-thy et al., 2015), as we suggest that the neuron behaviour in a question answering system might differ across the answers categories. The illus-tration is generated in two modes: heatmaps and highlighting the text. Figure 1 demonstrates the highlighted text mode and figure 3 - the corre-sponding heatmaps. The red colour corresponds to positive values and the blue to the negative ones. The brighter the colour, the larger the absolute value of the neuron output. The current model works on a word level as opposed to character level in (Karpathy et al., 2015). A researcher is encouraged to manually analyse whether the neu-rons align with easily interpretable patterns in the text. If a particular neuron is of interest, the user may see heatmaps in detail by navigating to the Neuron view. There the heatmaps spanning only this particular neuron on a subset of texts are plot-ted. Figure4illustrates this mode. The user can generate more heatmaps on random texts to check for the consistency of a pattern. It should be noted that for large systems or long texts the plots can
become difficult to analyse. We attempt to allevi-ate this by splitting the heatmaps into chunks by ten words and 32 neurons.
Correlation coefficients. We hypothesise that there is a dependency between a manual feature and a neuron. However, manually checking the heatmaps over a corpus for each neuron is time-consuming. Hence, we provide the researchers with additional information that might indicate promising pairs of features and neurons. The addi-tional information consists of three statistical mea-sures: the Pearson and the Spearman rank cor-relation coefficients and the Mutual Information score. As nature (discrete or continuous) of a user-defined manual feature is not known in ad-vance, we provide all three scores by default. If the value of the coefficient is higher than a thresh-old of T, the text of the indicator will be high-lighted in green. If the value is lower than −T, it will be highlighted in red. The user can ad-just this threshold value with a corresponding text field input. The default value of T is 0.5. The user can input their own features. The format is a nested Python list of the features values for words in texts. Alternatively, the user can choose from one of the suggested features. The suggested fea-tures include the following: is the token a stop-word? Does the token consist of alphabetic char-acter? The length of the token in characters? Is the token a noun/a verb/an adjective? Is the to-ken a named entity? Is the toto-ken a question word (what, how)?
The values for these features are computed with the SpaCy (Honnibal and Johnson,2015) library. Besides, the user can see some numerical charac-teristics of neuron values: maximum, minimum, median and mean values. He can also choose the number of texts to use, and whether they are sam-pled randomly or sequentially from the dataset. In case the user would like to check the depen-dency on a particular subset, he may input the ex-act indices for the question-answer pairs from the dataset. By default, the first ten instances in the dataset are used to speed up the computation pro-cess.
3.3 Technical implementation
Figure 3: A heatmap of all the neuron’s firings on a given text.
Figure 4: A heatmap of the given neuron’s firings on a given text. Each cell corresponds to a word (in left to right order). The red colour corresponds to positive val-ues and the blue to the negative ones. The more intense the colour, the larger the absolute value of the neuron output.
framework. For text preprocessing we use SpaCy (Honnibal and Johnson,2015) and NLTK (Loper and Bird,2002). Heatmaps and t-SNE results are plotted with the matplotlib (Hunter,2007) library and sklearn (Pedregosa et al., 2011). The main deep learning framework is Keras (Chollet,2015), but there is also a preliminary attempt to include PyTorch (Paszke et al., 2017) models. Statisti-cal measures were Statisti-calculated using scipy (Jones et al.,2001–).
3.4 Use cases
Regarding possible use cases, we can suggest at least five possible scenarios.
The first is to investigate possible sources of er-ror by analysing the model’s hidden vectors and attention scores.
The second promising application is to illus-trate the difference between models. This can be done by loading two different models and compar-ing their heatmaps and attention distributions. For
example, if two models with similar performance are given, the preference might go to the one with more explainable features.
The third scenario is a simplification of a model into a rule-based or machine learning approach. It can be seen as a compromise where we use a deep learning approach to extract features that might not be obvious for a human, and then transfer them to other models.
The fourth way to use the system is to try to terpret the features learnt by the network. For in-stance, while exploring the heatmaps, we noticed that the model seems to highlight words in the an-swers which are semantically relevant to the ques-tion (i.e., ”money” when a person asks for a bank recommendation). It also often reacts to the ques-tion phrases (”how much”, and so on).
Finally, we believe that interactive visualisa-tions of LSTM hidden vectors might be enticing and helpful in education for students and beginner level practitioners.
4 Conclusion
Deep learning models for text processing are pow-erful, but not easily interpretable. This low inter-pretability leads to low trust in the systems deci-sion and difficulties in improving its performance. Thus, there is a need for efficient visualisation tools that will illuminate the details of a neural net-work’s decision making.
We have presented a prototype of a visualisation system for the RNN model in the question answer-ing domain. This paper outlines the key features and structure of the system, along with the de-tails of the technical implementation. The system displays heat maps for attention scores and firings of neurons and outputs correlation coefficients be-tween the neurons and manual features. The ap-proach we develop would lend itself well for use by machine comprehension researchers and devel-opers.
[image:5.595.74.289.261.371.2]anal-ysis. The fourth possible improvement is the in-corporation of a direct comparison of two models in an interactive mode. Finally, the system can be extended to character-based models.
Future work will concentrate on extending the system to support other frameworks and visualisa-tion techniques, such as saliency heatmaps. We also plan to include use cases for different do-mains, e.g. machine translation.
5 Acknowledgements
This work was partially supported by the Ger-man Federal Ministry of Education and Re-search (BMBF) through the project DEEPLEE (01IW17001).
References
Dzmitry Bahdanau, Kyunghyun Cho, and Yoshua Ben-gio. 2014. Neural machine translation by jointly learning to align and translate. arXiv preprint arXiv:1409.0473.
Matt Chaput. 2007. Whoosh. https://
bitbucket.org/mchaput/whoosh.
Franois Chollet. 2015. keras. https://github.
com/fchollet/keras.
Matthew Honnibal and Mark Johnson. 2015. An im-proved non-monotonic transition system for depen-dency parsing. In Proceedings of the 2015 Con-ference on Empirical Methods in Natural Language Processing, pages 1373–1378, Lisbon, Portugal. As-sociation for Computational Linguistics.
J. D. Hunter. 2007. Matplotlib: A 2d graphics en-vironment. Computing In Science & Engineering, 9(3):90–95.
Robin Jia and Percy Liang. 2017. Adversarial exam-ples for evaluating reading comprehension systems. CoRR, abs/1707.07328.
Eric Jones, Travis Oliphant, Pearu Peterson, et al. 2001–. SciPy: Open source scientific tools for Python. [Online; accessed 29 May 2018].
Andrej Karpathy, Justin Johnson, and Li Fei-Fei. 2015. Visualizing and understanding recurrent networks. arXiv preprint arXiv:1506.02078.
Diederik P Kingma and Jimmy Ba. 2014. Adam: A method for stochastic optimization. arXiv preprint arXiv:1412.6980.
Jaesong Lee, Joong-Hwi Shin, and Jun-Seok Kim. 2017. Interactive visualization and manipulation of attention-based neural machine translation. In
Proceedings of the 2017 Conference on Empiri-cal Methods in Natural Language Processing: Sys-tem Demonstrations, pages 121–126. Association for Computational Linguistics.
Jiwei Li, Xinlei Chen, Eduard Hovy, and Dan Jurafsky. 2015a. Visualizing and understanding neural mod-els in nlp.arXiv preprint arXiv:1506.01066.
Jiwei Li, Xinlei Chen, Eduard H. Hovy, and Dan Juraf-sky. 2015b. Visualizing and understanding neural models in NLP. CoRR, abs/1506.01066.
Edward Loper and Steven Bird. 2002. Nltk: The natu-ral language toolkit. InProceedings of the ACL-02 Workshop on Effective Tools and Methodologies for Teaching Natural Language Processing and Com-putational Linguistics - Volume 1, ETMTNLP ’02, pages 63–70, Stroudsburg, PA, USA. Association for Computational Linguistics.
L.J.P. van der Maaten and G.E. Hinton. 2008. Visual-izing high-dimensional data using t-sne.
Tomas Mikolov, Kai Chen, Greg Corrado, and Jeffrey Dean. 2013. Efficient estimation of word represen-tations in vector space.CoRR, abs/1301.3781.
Preslav Nakov, Doris Hoogeveen, Llu´ıs M`arquez, Alessandro Moschitti, Hamdy Mubarak, Timothy Baldwin, and Karin Verspoor. 2017. Semeval-2017 task 3: Community question answering. In Proceed-ings of the 11th International Workshop on Semantic Evaluation (SemEval-2017), pages 27–48.
Adam Paszke, Sam Gross, Soumith Chintala, Gre-gory Chanan, Edward Yang, Zachary DeVito, Zem-ing Lin, Alban Desmaison, Luca Antiga, and Adam Lerer. 2017. Automatic differentiation in pytorch.
F. Pedregosa, G. Varoquaux, A. Gramfort, V. Michel, B. Thirion, O. Grisel, M. Blondel, P. Pretten-hofer, R. Weiss, V. Dubourg, J. Vanderplas, A. Pas-sos, D. Cournapeau, M. Brucher, M. Perrot, and E. Duchesnay. 2011. Scikit-learn: Machine learning in Python. Journal of Machine Learning Research, 12:2825–2830.
Armin Ronacher. 2018. Flask. https://github.
com/pallets/flask.
Hendrik Strobelt, Sebastian Gehrmann, Bernd Huber, Hanspeter Pfister, and Alexander M Rush. 2016. Vi-sual analysis of hidden state dynamics in recurrent neural networks. arXiv preprint arXiv:1606.07461.
Ming Tan, Cicero dos Santos, Bing Xiang, and Bowen Zhou. 2016. Improved representation learning for question answer matching. In Proceedings of the 54th Annual Meeting of the Association for Compu-tational Linguistics (Volume 1: Long Papers), vol-ume 1, pages 464–473.