Does relative efficiency matter? An analysis of market
uncertainty
LIM, Hyoung-joo and MALI, Dafydd
Available from Sheffield Hallam University Research Archive (SHURA) at:
http://shura.shu.ac.uk/21413/
This document is the author deposited version. You are advised to consult the
publisher's version if you wish to cite from it.
Published version
LIM, Hyoung-joo and MALI, Dafydd (2018). Does relative efficiency matter? An
analysis of market uncertainty. Investment Analysts Journal, 47 (2), 127-148.
Copyright and re-use policy
See
http://shura.shu.ac.uk/information.html
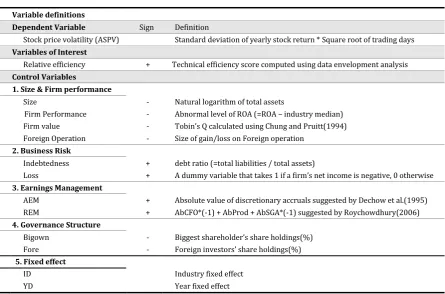
Table 1 Model Selection Process
Variable definitions
Dependent Variable Sign Definition
Stock price volatility (ASPV) Standard deviation of yearly stock return * Square root of trading days
Variables of Interest
Relative efficiency + Technical efficiency score computed using data envelopment analysis
Control Variables
1. Size & Firm performance
Size - Natural logarithm of total assets
Firm Performance - Abnormal level of ROA (=ROA – industry median) Firm value - Tobin’s Q calculated using Chung and Pruitt(1994) Foreign Operation - Size of gain/loss on Foreign operation
2. Business Risk
Indebtedness + debt ratio (=total liabilities / total assets)
Loss + A dummy variable that takes 1 if a firm’s net income is negative, 0 otherwise
3. Earnings Management
AEM + Absolute value of discretionary accruals suggested by Dechow et al.(1995) REM + AbCFO*(-1) + AbProd + AbSGA*(-1) suggested by Roychowdhury(2006)
4. Governance Structure
Bigown - Biggest shareholder’s share holdings(%)
Fore - Foreign investors’ share holdings(%)
5. Fixed effect
ID Industry fixed effect
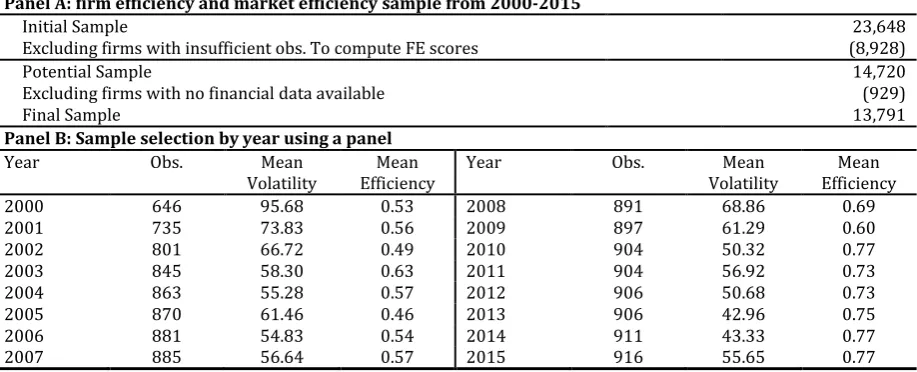
Table 2 Sample selection
Panel A: firm efficiency and market efficiency sample from 2000-2015
Initial Sample 23,648
Excluding firms with insufficient obs. To compute FE scores (8,928)
Potential Sample 14,720
Excluding firms with no financial data available (929)
Final Sample 13,791
Panel B: Sample selection by year using a panel
Year Obs. Mean
Volatility Efficiency Mean Year Obs. Volatility Mean Efficiency Mean
2000 646 95.68 0.53 2008 891 68.86 0.69
2001 735 73.83 0.56 2009 897 61.29 0.60
2002 801 66.72 0.49 2010 904 50.32 0.77
2003 845 58.30 0.63 2011 904 56.92 0.73
2004 863 55.28 0.57 2012 906 50.68 0.73
2005 870 61.46 0.46 2013 906 42.96 0.75
2006 881 54.83 0.54 2014 911 43.33 0.77
Note: t indicates t value for mean-difference test.
[image:4.842.69.773.104.431.2]z indicates wilcoxon z value for median-difference test. *, **, *** indicate significance level at 10%, 5%, 1% respectively. See Table 1 for variable definitions.
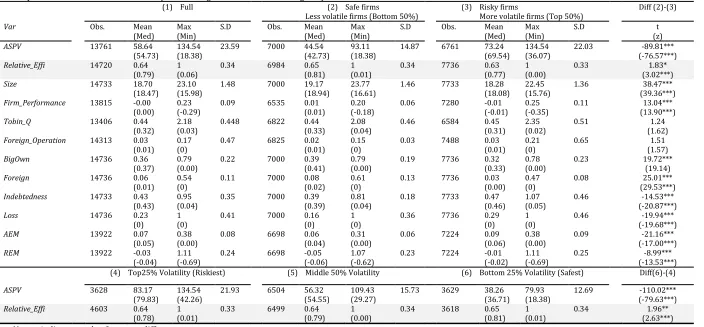
Table 3 Univariate Analysis
Descriptive Statistics and Difference Tests (Investment grade vs Non-investment grade)
(1) Full (2) Safe firms
Less volatile firms (Bottom 50%) (3) Risky firms More volatile firms (Top 50%) Diff (2)-(3)
Var Obs. Mean
(Med) Max (Min) S.D Obs. Mean (Med) Max (Min) S.D Obs. Mean (Med) Max (Min) S.D (z) t
ASPV 13761 58.64
(54.73) 134.54 (18.38) 23.59 7000 44.54 (42.73) (18.38) 93.11 14.87 6761 73.24 (69.54) 134.54 (36.07) 22.03 (-76.57***) -89.81*** Relative_Effi 14720 0.64
(0.79) 1 (0.06)
0.34 6984 0.65 (0.81)
1 (0.01)
0.34 7736 0.63 (0.77)
1 (0.00)
0.33 1.83*
(3.02***)
Size 14733 18.70
(18.47) 23.10 (15.98) 1.48 7000 19.17 (18.94) 23.77 (16.61) 1.46 7733 18.28 (18.08) 22.45 (15.76) 1.36 (39.36***) 38.47*** Firm_Performance 13815 -0.00
(0.00) 0.23 (-0.29) 0.09 6535 0.01 (0.01) 0.20 (-0.18) 0.06 7280 -0.01 (-0.01) 0.25 (-0.35) 0.11 (13.90***) 13.04***
Tobin_Q 13406 0.44
(0.32) 2.18 (0.03) 0.448 6822 0.44 (0.33) 2.08 (0.04) 0.46 6584 0.45 (0.31) 2.35 (0.02) 0.51 (1.62) 1.24 Foreign_Operation 14313 0.03
(0.01) 0.17 (0) 0.47 6825 0.02 (0.01) 0.15 (0) 0.03 7488 0.03 (0.01) 0.21 (0) 0.65 (1.57) 1.51
BigOwn 14736 0.36
(0.37) 0.79 (0.00) 0.22 7000 0.39 (0.41) 0.79 (0.00) 0.19 7736 0.32 (0.33) 0.78 (0.00) 0.23 19.72*** (19.14)
Foreign 14736 0.06
(0.01) 0.54 (0) 0.11 7000 0.08 (0.02) 0.61 (0) 0.13 7736 0.03 (0.00) 0.47 (0) 0.08 (29.53***) 25.01*** Indebtedness 14733 0.43
(0.43) 0.95 (0.04) 0.35 7000 0.39 (0.39) 0.81 (0.04) 0.18 7733 0.47 (0.46) 1.07 (0.05) 0.46 (-20.87***) -14.53***
Loss 14736 0.23
(0) 1 (0) 0.41 7000 0.16 (0) 1 (0) 0.36 7736 0.29 (0) 1 (0) 0.46 (-19.68***) -19.94***
AEM 13922 0.07
(0.05) 0.38 (0.00) 0.08 6698 0.06 (0.04) 0.31 (0.00) 0.06 7224 0.09 (0.06) 0.38 (0.00) 0.09 (-17.00***) -21.16***
REM 13922 -0.03
(-0.04) 1.11 (-0.69) 0.24 6698 -0.05 (-0.06) 1.07 (-0.62) 0.23 7224 -0.01 (-0.02) 1.11 (-0.69) 0.25 (-13.53***) -8.99*** (4) Top25% Volatility (Riskiest) (5) Middle 50% Volatility (6) Bottom 25% Volatility (Safest) Diff(6)-(4)
ASPV 3628 83.17
(79.83) 134.54 (42.26) 21.93 6504 56.32 (54.55) (29.27) 109.43 15.73 3629 38.26 (36.71) 79.93 (18.38) 12.69 (-79.63***) -110.02*** Relative_Effi 4603 0.64
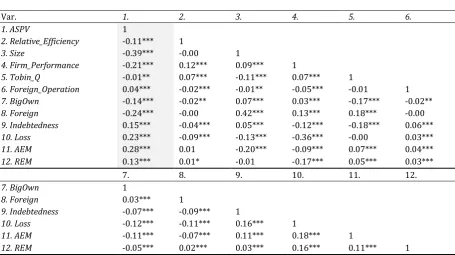
Table 4 Pearson Correlation
Var. 1. 2. 3. 4. 5. 6.
1. ASPV 1
2. Relative_Efficiency -0.11*** 1
3. Size -0.39*** -0.00 1
4. Firm_Performance -0.21*** 0.12*** 0.09*** 1
5. Tobin_Q -0.01** 0.07*** -0.11*** 0.07*** 1
6. Foreign_Operation 0.04*** -0.02*** -0.01** -0.05*** -0.01 1
7. BigOwn -0.14*** -0.02** 0.07*** 0.03*** -0.17*** -0.02**
8. Foreign -0.24*** -0.00 0.42*** 0.13*** 0.18*** -0.00
9. Indebtedness 0.15*** -0.04*** 0.05*** -0.12*** -0.18*** 0.06***
10. Loss 0.23*** -0.09*** -0.13*** -0.36*** -0.00 0.03***
11. AEM 0.28*** 0.01 -0.20*** -0.09*** 0.07*** 0.04***
12. REM 0.13*** 0.01* -0.01 -0.17*** 0.05*** 0.03***
7. 8. 9. 10. 11. 12.
7. BigOwn 1
8. Foreign 0.03*** 1
9. Indebtedness -0.07*** -0.09*** 1
10. Loss -0.12*** -0.11*** 0.16*** 1
11. AEM -0.11*** -0.07*** 0.11*** 0.18*** 1
12. REM -0.05*** 0.02*** 0.03*** 0.16*** 0.11*** 1 Note: *, **, *** indicate significance level at 10%, 5%, 1% respectively.
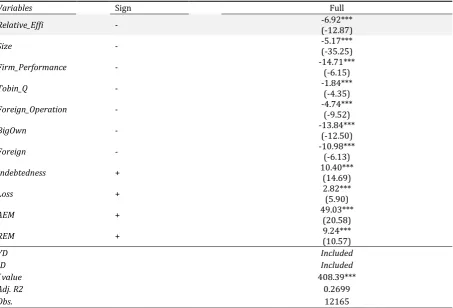
Table 5 Influence of firm efficiency on ASPV using efficiency score
Results of multivariate regression analysis
Model:
𝐴𝑆𝑃𝑉 = 𝛽1𝑅𝑒𝑙𝑎𝑡𝑖𝑣𝑒_𝐸𝑓𝑓𝑖𝑖,𝑡+ 𝛽2𝑆𝑖𝑧𝑒𝑖,𝑡+ 𝛽3𝐹𝑖𝑟𝑚_𝑃𝑒𝑟𝑓𝑜𝑟𝑚𝑎𝑛𝑐𝑒𝑖,𝑡+ 𝛽4𝑇𝑜𝑏𝑖𝑛_𝑄𝑖,𝑡+ 𝛽5𝐹𝑜𝑟𝑒𝑖𝑔𝑛_𝑂𝑝𝑒𝑟𝑎𝑡𝑖𝑜𝑛𝑖,𝑡
+ 𝛽6𝐵𝑖𝑔𝑂𝑤𝑛𝑖,𝑡+ 𝛽7𝐹𝑜𝑟𝑒𝑖𝑔𝑛𝑖,𝑡+ 𝛽8𝐼𝑛𝑑𝑒𝑏𝑡𝑒𝑑𝑛𝑒𝑠𝑠𝑖,𝑡+ 𝛽9𝐿𝑜𝑠𝑠𝑖,𝑡+ 𝛽10𝐴𝐸𝑀𝑖,𝑡+ 𝛽11𝑅𝐸𝑀𝑖,𝑡
+ 𝐼𝐷 + 𝑌𝐷 + 𝜀𝑖,𝑡
Variables Sign Full
Relative_Effi - -6.92*** (-12.87)
Size - -5.17*** (-35.25)
Firm_Performance - -14.71*** (-6.15)
Tobin_Q - -1.84*** (-4.35)
Foreign_Operation - -4.74*** (-9.52)
BigOwn - -13.84*** (-12.50)
Foreign - -10.98*** (-6.13)
Indebtedness + 10.40*** (14.69)
Loss + 2.82*** (5.90)
AEM + 49.03*** (20.58)
REM + (10.57) 9.24***
YD Included
ID Included
f value 408.39***
Adj. R2 0.2699
Obs. 12165
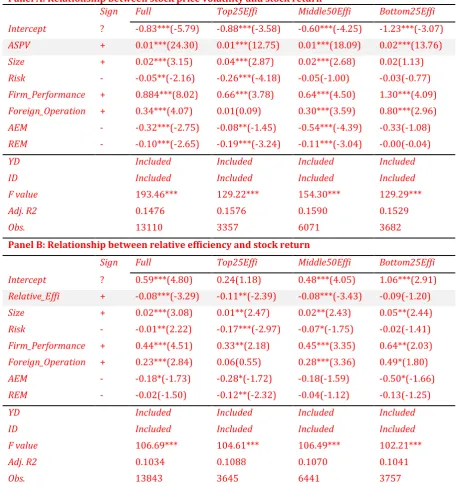
Table 6 Verification tests
Model:
𝑅𝑒𝑡𝑢𝑟𝑛𝑖,𝑡= 𝛽1𝐴𝑆𝑃𝑉/𝑅𝑒𝑙𝑎𝑡𝑖𝑣𝑒_𝐸𝑓𝑓𝑖𝑖𝑖,𝑡+ 𝛽2𝑆𝑖𝑧𝑒𝑖,𝑡+ 𝛽3𝑅𝑖𝑠𝑘𝑖,𝑡+ 𝛽4𝐹𝑖𝑟𝑚_𝑃𝑒𝑟𝑓𝑜𝑟𝑚𝑎𝑛𝑐𝑒𝑖,𝑡
+ 𝛽5𝐹𝑜𝑟𝑒𝑖𝑔𝑛_𝑂𝑝𝑒𝑟𝑎𝑡𝑖𝑜𝑛𝑖,𝑡+ 𝛽6𝐴𝐸𝑀𝑖,𝑡+ 𝛽7𝑅𝐸𝑀𝑖,𝑡+ 𝐼𝐷 + 𝑌𝐷 + 𝜀𝑖,𝑡 Panel A: Relationship between stock price volatility and stock return
Sign Full Top25Effi Middle50Effi Bottom25Effi
Intercept ? -0.83***(-5.79) -0.88***(-3.58) -0.60***(-4.25) -1.23***(-3.07)
ASPV + 0.01***(24.30) 0.01***(12.75) 0.01***(18.09) 0.02***(13.76)
Size + 0.02***(3.15) 0.04***(2.87) 0.02***(2.68) 0.02(1.13)
Risk - -0.05**(-2.16) -0.26***(-4.18) -0.05(-1.00) -0.03(-0.77)
Firm_Performance + 0.884***(8.02) 0.66***(3.78) 0.64***(4.50) 1.30***(4.09)
Foreign_Operation + 0.34***(4.07) 0.01(0.09) 0.30***(3.59) 0.80***(2.96)
AEM - -0.32***(-2.75) -0.08**(-1.45) -0.54***(-4.39) -0.33(-1.08)
REM - -0.10***(-2.65) -0.19***(-3.24) -0.11***(-3.04) -0.00(-0.04)
YD Included Included Included Included
ID Included Included Included Included
F value 193.46*** 129.22*** 154.30*** 129.29***
Adj. R2 0.1476 0.1576 0.1590 0.1529
Obs. 13110 3357 6071 3682
Panel B: Relationship between relative efficiency and stock return
Sign Full Top25Effi Middle50Effi Bottom25Effi
Intercept ? 0.59***(4.80) 0.24(1.18) 0.48***(4.05) 1.06***(2.91)
Relative_Effi + -0.08***(-3.29) -0.11**(-2.39) -0.08***(-3.43) -0.09(-1.20)
Size + 0.02***(3.08) 0.01**(2.47) 0.02**(2.43) 0.05**(2.44)
Risk - -0.01**(2.22) -0.17***(-2.97) -0.07*(-1.75) -0.02(-1.41)
Firm_Performance + 0.44***(4.51) 0.33**(2.18) 0.45***(3.35) 0.64**(2.03)
Foreign_Operation + 0.23***(2.84) 0.06(0.55) 0.28***(3.36) 0.49*(1.80)
AEM - -0.18*(-1.73) -0.28*(-1.72) -0.18(-1.59) -0.50*(-1.66)
REM - -0.02(-1.50) -0.12**(-2.32) -0.04(-1.12) -0.13(-1.25)
YD Included Included Included Included
ID Included Included Included Included
F value 106.69*** 104.61*** 106.49*** 102.21***
Adj. R2 0.1034 0.1088 0.1070 0.1041
Obs. 13843 3645 6441 3757
Variable Definition: Return: 12months cumulative monthly stock return, ASPV: Stock Price Volatility, Relative_Effi: Technical efficiency score computed using data envelopment analysis , Size: Natural logarithm of total assets, Risk : debt ratio (=total liabilities / total assets), Firm_Performance: Abnormal level of ROA (=ROA – industry median),
Foreign_Operation: Size of gain/loss on foreign operation AEM: Absolute value of discretionary accruals suggested by
Note: *, **, *** indicate significance level at 10%, 5%, 1% respectively. Figures in parenthesis indicate t value
𝐴𝑆𝑃𝑉𝑖,𝑡= 𝛽1𝑅𝑒𝑙𝑎𝑡𝑖𝑣𝑒_𝐸𝑓𝑓𝑖𝑖,𝑡+ 𝛽2𝑆𝑖𝑧𝑒𝑖,𝑡+ 𝛽3𝐹𝑖𝑟𝑚_𝑃𝑒𝑟𝑓𝑜𝑟𝑚𝑎𝑛𝑐𝑒𝑖,𝑡+ 𝛽4𝑇𝑜𝑏𝑖𝑛_𝑄𝑖,𝑡+ 𝛽5𝐹𝑜𝑟𝑒𝑖𝑔𝑛_𝑂𝑝𝑒𝑟𝑎𝑡𝑖𝑜𝑛𝑖,𝑡+ 𝛽6𝐵𝑖𝑔𝑂𝑤𝑛𝑖,𝑡+ 𝛽7𝐹𝑜𝑟𝑒𝑖𝑔𝑛𝑖,𝑡+ 𝛽8𝐼𝑛𝑑𝑒𝑏𝑡𝑒𝑑𝑛𝑒𝑠𝑠𝑖,𝑡
+ 𝛽9𝐿𝑜𝑠𝑠𝑖,𝑡+ 𝛽10𝐴𝐸𝑀𝑖,𝑡+ 𝛽11𝑅𝐸𝑀𝑖,𝑡+ 𝐼𝐷 + 𝑌𝐷 + 𝜀𝑖,𝑡
𝐴𝑆𝑃𝑉𝑖,𝑡= 𝛽1𝑅𝑒𝑙𝑎𝑡𝑖𝑣𝑒_𝐸𝑓𝑓𝑖𝑖,𝑡+ 𝛽2𝐷_𝑇𝑂𝑃25𝑖,𝑡+ 𝛽3𝑇𝑜𝑝25_𝐸𝑓𝑓𝑖𝑖,𝑡+ 𝛽4𝑆𝑖𝑧𝑒𝑖,𝑡+ 𝛽5𝐹𝑖𝑟𝑚_𝑃𝑒𝑟𝑓𝑜𝑟𝑚𝑎𝑛𝑐𝑒𝑖,𝑡+ 𝛽6𝑇𝑜𝑏𝑖𝑛_𝑄𝑖,𝑡+ 𝛽7𝐹𝑜𝑟𝑒𝑖𝑔𝑛_𝑂𝑝𝑒𝑟𝑎𝑡𝑖𝑜𝑛𝑖,𝑡+ 𝛽8𝐵𝑖𝑔𝑂𝑤𝑛𝑖,𝑡
[image:8.842.69.764.196.478.2]+ 𝛽9𝐹𝑜𝑟𝑒𝑖𝑔𝑛𝑖,𝑡+ 𝛽10𝐼𝑛𝑑𝑒𝑏𝑡𝑒𝑑𝑛𝑒𝑠𝑠𝑖,𝑡+ 𝛽11𝐿𝑜𝑠𝑠𝑖,𝑡+ 𝛽12𝐴𝐸𝑀𝑖,𝑡+ 𝛽13𝑅𝐸𝑀𝑖,𝑡+ 𝐼𝐷 + 𝑌𝐷 + 𝜀𝑖,𝑡
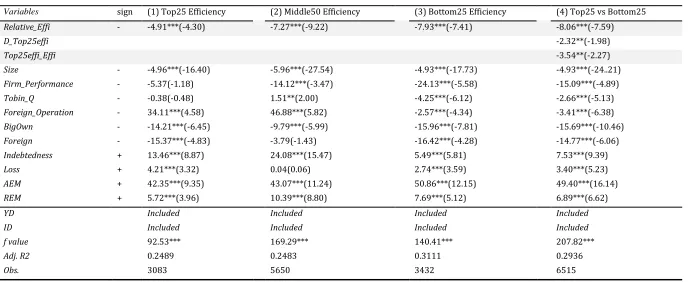
Table 7 Most efficient group vs Most inefficient group analysis
Model:
Variables sign (1) Top25 Efficiency (2) Middle50 Efficiency (3) Bottom25 Efficiency (4) Top25 vs Bottom25
Relative_Effi - -4.91***(-4.30) -7.27***(-9.22) -7.93***(-7.41) -8.06***(-7.59)
D_Top25effi -2.32**(-1.98)
Top25effi_Effi -3.54**(-2.27)
Size - -4.96***(-16.40) -5.96***(-27.54) -4.93***(-17.73) -4.93***(-24..21)
Firm_Performance - -5.37(-1.18) -14.12***(-3.47) -24.13***(-5.58) -15.09***(-4.89)
Tobin_Q - -0.38(-0.48) 1.51**(2.00) -4.25***(-6.12) -2.66***(-5.13)
Foreign_Operation - 34.11***(4.58) 46.88***(5.82) -2.57***(-4.34) -3.41***(-6.38)
BigOwn - -14.21***(-6.45) -9.79***(-5.99) -15.96***(-7.81) -15.69***(-10.46)
Foreign - -15.37***(-4.83) -3.79(-1.43) -16.42***(-4.28) -14.77***(-6.06)
Indebtedness + 13.46***(8.87) 24.08***(15.47) 5.49***(5.81) 7.53***(9.39)
Loss + 4.21***(3.32) 0.04(0.06) 2.74***(3.59) 3.40***(5.23)
AEM + 42.35***(9.35) 43.07***(11.24) 50.86***(12.15) 49.40***(16.14)
REM + 5.72***(3.96) 10.39***(8.80) 7.69***(5.12) 6.89***(6.62)
YD Included Included Included Included
ID Included Included Included Included
f value 92.53*** 169.29*** 140.41*** 207.82***
Adj. R2 0.2489 0.2483 0.3111 0.2936
D_TOP25: A dummy variable that takes a value of 1 if the most efficient group (top25 efficiency), 0 if most inefficient group (bottom 25% efficiency), Top25_Effi: Interaction term between relative efficiency score and D_TOP25 dummy. See Table 1 for variable definitions.
Table 8 High risk-High return (Most news sensitive) group vs Low risk-Low return (Least news sensitive) group
Model:
𝐴𝑆𝑃𝑉𝑖,𝑡= 𝛽1𝑅𝑒𝑙𝑎𝑡𝑖𝑣𝑒_𝐸𝑓𝑓𝑖𝑖,𝑡+ 𝛽2𝑆𝑖𝑧𝑒𝑖,𝑡+ 𝛽3𝐹𝑖𝑟𝑚_𝑃𝑒𝑟𝑓𝑜𝑟𝑚𝑎𝑛𝑐𝑒𝑖,𝑡+ 𝛽4𝑇𝑜𝑏𝑖𝑛_𝑄𝑖,𝑡+ 𝛽5𝐹𝑜𝑟𝑒𝑖𝑔𝑛_𝑂𝑝𝑒𝑟𝑎𝑡𝑖𝑜𝑛𝑖,𝑡+ 𝛽6𝐵𝑖𝑔𝑂𝑤𝑛𝑖,𝑡+ 𝛽7𝐹𝑜𝑟𝑒𝑖𝑔𝑛𝑖,𝑡+ 𝛽8𝐼𝑛𝑑𝑒𝑏𝑡𝑒𝑑𝑛𝑒𝑠𝑠𝑖,𝑡
+ 𝛽9𝐿𝑜𝑠𝑠𝑖,𝑡+ 𝛽10𝐴𝐸𝑀𝑖,𝑡+ 𝛽11𝑅𝐸𝑀𝑖,𝑡+ 𝐼𝐷 + 𝑌𝐷 + 𝜀𝑖,𝑡
𝐴𝑆𝑃𝑉𝑖,𝑡= 𝛽1𝑅𝑒𝑙𝑎𝑡𝑖𝑣𝑒_𝐸𝑓𝑓𝑖𝑖,𝑡+ 𝛽2𝐷_𝑇𝑜𝑝𝑉𝑜𝑙𝑎𝑖,𝑡+ 𝛽3𝑇𝑜𝑝𝑉𝑜𝑙𝑎_𝐸𝑓𝑓𝑖𝑖,𝑡+ 𝛽4𝑆𝑖𝑧𝑒𝑖,𝑡+ 𝛽5𝐹𝑖𝑟𝑚_𝑃𝑒𝑟𝑓𝑜𝑟𝑚𝑎𝑛𝑐𝑒𝑖,𝑡+ 𝛽6𝑇𝑜𝑏𝑖𝑛_𝑄𝑖,𝑡+ 𝛽7𝐹𝑜𝑟𝑒𝑖𝑔𝑛_𝑂𝑝𝑒𝑟𝑎𝑡𝑖𝑜𝑛𝑖,𝑡+ 𝛽8𝐵𝑖𝑔𝑂𝑤𝑛𝑖,𝑡
+ 𝛽9𝐹𝑜𝑟𝑒𝑖𝑔𝑛𝑖,𝑡+ 𝛽10𝐼𝑛𝑑𝑒𝑏𝑡𝑒𝑑𝑛𝑒𝑠𝑠𝑖,𝑡+ 𝛽11𝐿𝑜𝑠𝑠𝑖,𝑡+ 𝛽12𝐴𝐸𝑀𝑖,𝑡+ 𝛽13𝑅𝐸𝑀𝑖,𝑡+ 𝐼𝐷 + 𝑌𝐷 + 𝜀𝑖,𝑡
Variables sign (1) Top25 Volatility (2) Middle50 Volatility (3) Bottom25 Volatility (4) Top25 vs Bottom25
Relative_Effi - -8.92***(-8.34) -6.42***(-11.78) -3.72***(-5.87) -4.75***(-5.50)
D_TopVola 40.92***(43.73)
TopVola_Effi -4.22***(-3.41)
Size - -5.41***(-17.07) -3.62***(-23.34) -1.26***(-7.08) -2.84***(-16.31)
Firm_Performance - 1.67(0.45) -8.42***(-3.21) -2.31(-0.62) -2.10(-0.81)
Tobin_Q - -3.30***(-4.91) -1.88***(-3.99) -1.23**(-1.99) -2.23***(-4.84)
Foreign_Operation - -0.99*(-1.79) 35.31***(7.82) 51.47***(6.69) -1.31***(-2.94)
BigOwn - -3.16(-1.56) -8.85***(-7.60) -9.83***(-7.16) -8.04***(-6.41)
Foreign - -13.52***(-2.71) -5.02***(-2.69) -1.92(-1.07) -1.121(-0.55)
Indebtedness + 2.53***(2.94) 10.53***(9.89) 10.15***(7.47) 3.38***(4.99)
Loss + -0.01(-0.01) 1.40***(2.82) 0.07(0.11) 0.18(0.33)
AEM + 35.50***(9.83) 28.07***(10.53) 22.15***(5.96) 32.75***(12.58)
REM + 2.77**(2.03) 3.66***(4.15) 1.60*(1.72) 4.69***(5.57)
YD Included Included Included Included
ID Included Included Included Included
f value 64.23*** 134.24*** 32.54*** 936.55***
Adj. R2 0.1825 0.2040 0.1006 0.6563
Obs. 3176 5775 3214 6390
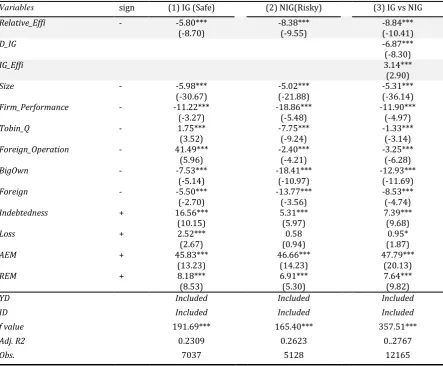
Table 9 Safe vs Risky group analysis based on credit risk
Model:
𝐴𝑆𝑃𝑉𝑖,𝑡= 𝛽1𝑅𝑒𝑙𝑎𝑡𝑖𝑣𝑒_𝐸𝑓𝑓𝑖𝑖,𝑡+ 𝛽2𝑆𝑖𝑧𝑒𝑖,𝑡+ 𝛽3𝐹𝑖𝑟𝑚_𝑃𝑒𝑟𝑓𝑜𝑟𝑚𝑎𝑛𝑐𝑒𝑖,𝑡+ 𝛽4𝑇𝑜𝑏𝑖𝑛_𝑄𝑖,𝑡
+ 𝛽5𝐹𝑜𝑟𝑒𝑖𝑔𝑛_𝑂𝑝𝑒𝑟𝑎𝑡𝑖𝑜𝑛𝑖,𝑡+ 𝛽6𝐵𝑖𝑔𝑂𝑤𝑛𝑖,𝑡+ 𝛽7𝐹𝑜𝑟𝑒𝑖𝑔𝑛𝑖,𝑡+ 𝛽8𝐼𝑛𝑑𝑒𝑏𝑡𝑒𝑑𝑛𝑒𝑠𝑠𝑖,𝑡
+ 𝛽9𝐿𝑜𝑠𝑠𝑖,𝑡+ 𝛽10𝐴𝐸𝑀𝑖,𝑡+ 𝛽11𝑅𝐸𝑀𝑖,𝑡+ 𝐼𝐷 + 𝑌𝐷 + 𝜀𝑖,𝑡
𝐴𝑆𝑃𝑉𝑖,𝑡= 𝛽1𝑅𝑒𝑙𝑎𝑡𝑖𝑣𝑒_𝐸𝑓𝑓𝑖𝑖,𝑡+ 𝛽2𝐷_𝐼𝐺𝑖,𝑡+ 𝛽3𝐼𝐺_𝐸𝑓𝑓𝑖𝑖,𝑡+ 𝛽4𝑆𝑖𝑧𝑒𝑖,𝑡+ 𝛽5𝐹𝑖𝑟𝑚_𝑃𝑒𝑟𝑓𝑜𝑟𝑚𝑎𝑛𝑐𝑒𝑖,𝑡
+ 𝛽6𝑇𝑜𝑏𝑖𝑛_𝑄𝑖,𝑡+ 𝛽7𝐹𝑜𝑟𝑒𝑖𝑔𝑛_𝑂𝑝𝑒𝑟𝑎𝑡𝑖𝑜𝑛𝑖,𝑡+ 𝛽8𝐵𝑖𝑔𝑂𝑤𝑛𝑖,𝑡+ 𝛽9𝐹𝑜𝑟𝑒𝑖𝑔𝑛𝑖,𝑡
+ 𝛽10𝐼𝑛𝑑𝑒𝑏𝑡𝑒𝑑𝑛𝑒𝑠𝑠𝑖,𝑡+ 𝛽11𝐿𝑜𝑠𝑠𝑖,𝑡+ 𝛽12𝐴𝐸𝑀𝑖,𝑡+ 𝛽13𝑅𝐸𝑀𝑖,𝑡+ 𝐼𝐷 + 𝑌𝐷 + 𝜀𝑖,𝑡
Variables sign (1) IG (Safe) (2) NIG(Risky) (3) IG vs NIG
Relative_Effi - -5.80***
(-8.70) -8.38*** (-9.55) -8.84*** (-10.41)
D_IG -6.87***
(-8.30)
IG_Effi 3.14***
(2.90)
Size - -5.98***
(-30.67) (-21.88) -5.02*** -5.31*** (-36.14)
Firm_Performance - -11.22***
(-3.27) -18.86*** (-5.48) -11.90*** (-4.97)
Tobin_Q - 1.75***
(3.52) -7.75*** (-9.24) -1.33*** (-3.14)
Foreign_Operation - 41.49***
(5.96) -2.40*** (-4.21) -3.25*** (-6.28)
BigOwn - -7.53***
(-5.14) -18.41*** (-10.97) -12.93*** (-11.69)
Foreign - -5.50***
(-2.70) -13.77*** (-3.56) -8.53*** (-4.74)
Indebtedness + 16.56***
(10.15) 5.31*** (5.97) 7.39*** (9.68)
Loss + 2.52***
(2.67) (0.94) 0.58 (1.87) 0.95*
AEM + 45.83***
(13.23) 46.66*** (14.23) 47.79*** (20.13)
REM + 8.18***
(8.53) 6.91*** (5.30) 7.64*** (9.82)
YD Included Included Included
ID Included Included Included
f value 191.69*** 165.40*** 357.51***
Adj. R2 0.2309 0.2623 0..2767
Obs. 7037 5128 12165
Note: *, **, *** indicate significance level at 10%, 5%, 1% respectively. Figures in parenthesis indicate t value
D_IG: A dummy variable that takes a value of 1 if a firm is investment grade (CR score above 6 where 10 is the highest) ,0 if non-investment grade, IG_Effi: Interaction term between relative efficiency score and D_IG dummy.
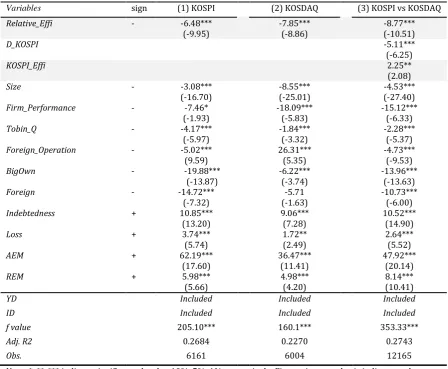
Table 10 Safe vs Risky group analysis based on market size
Model:
𝐴𝑆𝑃𝑉𝑖,𝑡= 𝛽1𝑅𝑒𝑙𝑎𝑡𝑖𝑣𝑒_𝐸𝑓𝑓𝑖𝑖,𝑡+ 𝛽2𝑆𝑖𝑧𝑒𝑖,𝑡+ 𝛽3𝐹𝑖𝑟𝑚_𝑃𝑒𝑟𝑓𝑜𝑟𝑚𝑎𝑛𝑐𝑒𝑖,𝑡+ 𝛽4𝑇𝑜𝑏𝑖𝑛_𝑄𝑖,𝑡
+ 𝛽5𝐹𝑜𝑟𝑒𝑖𝑔𝑛_𝑂𝑝𝑒𝑟𝑎𝑡𝑖𝑜𝑛𝑖,𝑡+ 𝛽6𝐵𝑖𝑔𝑂𝑤𝑛𝑖,𝑡+ 𝛽7𝐹𝑜𝑟𝑒𝑖𝑔𝑛𝑖,𝑡+ 𝛽8𝐼𝑛𝑑𝑒𝑏𝑡𝑒𝑑𝑛𝑒𝑠𝑠𝑖,𝑡
+ 𝛽9𝐿𝑜𝑠𝑠𝑖,𝑡+ 𝛽10𝐴𝐸𝑀𝑖,𝑡+ 𝛽11𝑅𝐸𝑀𝑖,𝑡+ 𝐼𝐷 + 𝑌𝐷 + 𝜀𝑖,𝑡
𝐴𝑆𝑃𝑉𝑖,𝑡= 𝛽1𝑅𝑒𝑙𝑎𝑡𝑖𝑣𝑒_𝐸𝑓𝑓𝑖𝑖,𝑡+ 𝛽2𝐷_𝐾𝑂𝑆𝑃𝐼𝑖,𝑡+ 𝛽3𝐾𝑂𝑆𝑃𝐼_𝐸𝑓𝑓𝑖𝑖,𝑡+ 𝛽4𝑆𝑖𝑧𝑒𝑖,𝑡+ 𝛽5𝐹𝑖𝑟𝑚_𝑃𝑒𝑟𝑓𝑜𝑟𝑚𝑎𝑛𝑐𝑒𝑖,𝑡
+ 𝛽6𝑇𝑜𝑏𝑖𝑛_𝑄𝑖,𝑡+ 𝛽7𝐹𝑜𝑟𝑒𝑖𝑔𝑛_𝑂𝑝𝑒𝑟𝑎𝑡𝑖𝑜𝑛𝑖,𝑡+ 𝛽8𝐵𝑖𝑔𝑂𝑤𝑛𝑖,𝑡+ 𝛽9𝐹𝑜𝑟𝑒𝑖𝑔𝑛𝑖,𝑡
+ 𝛽10𝐼𝑛𝑑𝑒𝑏𝑡𝑒𝑑𝑛𝑒𝑠𝑠𝑖,𝑡+ 𝛽11𝐿𝑜𝑠𝑠𝑖,𝑡+ 𝛽12𝐴𝐸𝑀𝑖,𝑡+ 𝛽13𝑅𝐸𝑀𝑖,𝑡+ 𝐼𝐷 + 𝑌𝐷 + 𝜀𝑖,𝑡
Variables sign (1) KOSPI (2) KOSDAQ (3) KOSPI vs KOSDAQ
Relative_Effi - -6.48***
(-9.95) -7.85*** (-8.86) (-10.51) -8.77***
D_KOSPI -5.11***
(-6.25)
KOSPI_Effi 2.25**
(2.08)
Size - -3.08***
(-16.70) -8.55*** (-25.01) (-27.40) -4.53***
Firm_Performance - -7.46*
(-1.93) -18.09*** (-5.83) -15.12*** (-6.33)
Tobin_Q - -4.17***
(-5.97) -1.84*** (-3.32) -2.28*** (-5.37)
Foreign_Operation - -5.02***
(9.59) 26.31*** (5.35) -4.73*** (-9.53)
BigOwn - -19.88***
(-13.87) -6.22*** (-3.74) -13.96*** (-13.63)
Foreign - -14.72***
(-7.32) (-1.63) -5.71 -10.73*** (-6.00)
Indebtedness + 10.85***
(13.20) 9.06*** (7.28) 10.52*** (14.90)
Loss + 3.74***
(5.74) 1.72** (2.49) 2.64*** (5.52)
AEM + 62.19***
(17.60) 36.47*** (11.41) 47.92*** (20.14)
REM + 5.98***
(5.66) 4.98*** (4.20) 8.14*** (10.41)
YD Included Included Included
ID Included Included Included
f value 205.10*** 160.1*** 353.33***
Adj. R2 0.2684 0.2270 0.2743
Obs. 6161 6004 12165
Note: *, **, *** indicate significance level at 10%, 5%, 1% respectively. Figures in parenthesis indicate t value
D_KOSPI: A dummy variable that takes a value of 1 if a firm is listed on KOSPI market ,0 if a firm listed on KOSDAQ market, KOSPI_Effi: Interaction term between relative efficiency score and D_KOSPI dummy.
Table 11 Sensitivity analysis based on 1) efficiency, 2) volatility decile rank
Model:
𝐴𝑆𝑃𝑉𝑖,𝑡= 𝛽1𝑅𝑒𝑙𝑎𝑡𝑖𝑣𝑒_𝐸𝑓𝑓𝑖𝑖,𝑡+ 𝛽2𝑆𝑖𝑧𝑒𝑖,𝑡+ 𝛽3𝐹𝑖𝑟𝑚_𝑃𝑒𝑟𝑓𝑜𝑟𝑚𝑎𝑛𝑐𝑒𝑖,𝑡+ 𝛽4𝑇𝑜𝑏𝑖𝑛_𝑄𝑖,𝑡+ 𝛽5𝐹𝑜𝑟𝑒𝑖𝑔𝑛_𝑂𝑝𝑒𝑟𝑎𝑡𝑖𝑜𝑛𝑖,𝑡+ 𝛽6𝐵𝑖𝑔𝑂𝑤𝑛𝑖,𝑡+ 𝛽7𝐹𝑜𝑟𝑒𝑖𝑔𝑛𝑖,𝑡+ 𝛽8𝐼𝑛𝑑𝑒𝑏𝑡𝑒𝑑𝑛𝑒𝑠𝑠𝑖,𝑡
+ 𝛽9𝐿𝑜𝑠𝑠𝑖,𝑡+ 𝛽10𝐴𝐸𝑀𝑖,𝑡+ 𝛽11𝑅𝐸𝑀𝑖,𝑡+ 𝐼𝐷 + 𝑌𝐷 + 𝜀𝑖,𝑡
Panel A: Sensitive Analysis By Relative Efficiency decile rank
Most Efficient Most inefficient
10 9 8 7 6 5 4 3 2 1
Relative_Effi -3.47
(-1.29) -6.04*** (-3.28) -6.00*** (-3.66) -5.67*** (-3.44) -7.73*** (-4.76) -6.22*** (-3.82) -7.95*** (-4.84) -4.75*** (-3.03) -11.52*** (-6.04) -11.11*** (-5.51)
Controls Included Included Included Included Included Included Included Included Included Included YD Included Included Included Included Included Included Included Included Included Included ID Included Included Included Included Included Included Included Included Included Included f value 41.05*** 32.75*** 36.67*** 31.14*** 30.49*** 40.46*** 41.09*** 47.97*** 41.73*** 63.10***
Adj. R2 0.2677 0.2645 0.2621 0.2188 0.2080 0.2739 0.2718 0.2842 0.2872 0.3458
Obs. 1247 1014 1148 1235 1289 1192 1223 1341 1151 1325 Panel B: Sensitive Analysis By Volatility decile rank
Most volatile Least volatile
10 9 8 7 6 5 4 3 2 1
Relative_Effi -7.87***
(-4.13) -6.85*** (-4.55) -7.73*** (-5.70) -6.37*** (-5.31) -5.85*** (-5.24) -5.94*** (-5.18) -4.93*** (-4.65) -4.83*** (-4.79) -3.77*** (-3.97) -2.70*** (-3.07)
Controls Included Included Included Included Included Included Included Included Included Included YD Included Included Included Included Included Included Included Included Included Included ID Included Included Included Included Included Included Included Included Included Included f value 21.83*** 22.33*** 26.16*** 28.83*** 32.23*** 22.09*** 20.65*** 17.02*** 16.70*** 10.76***
Adj. R2 0.1635 0.1668 0.1985 0.2060 0.2185 17.39 0.1605 0.1337 0.1355 0.0776