http://www.scirp.org/journal/lce ISSN Online: 2158-7019
ISSN Print: 2158-7000
DOI: 10.4236/lce.2018.92005 May 7, 2018 63 Low Carbon Economy
The Happiness Cost of Air Pollution
Feng Chen
Jinan University, Guangzhou, China
Abstract
This paper chooses the air quality index (AQI) as the main measure of air pollution, using the relevant data of CGSS (2013) to analyze the impact of air pollution and subjective well-being of residents. In the end, the paper is based on the above research in order to analysis the willingness to pay for air quality improvement, and help the government put forward the corresponding policy suggestions.
Keywords
Ordered Probit Model, Subjective Well-Being, Air Pollution
1. Introduction
Since the Reform and Opening Up, the growth of China continued to accelerate. At the same time, the pollution of environment and deterioration of ecological environment is becoming worse than before. In the existing economic system of China, “high pollution, high energy” consuming industry based economy still occupies a pivotal position. This can make the air pollution worse nowadays. This can cause the haze weather in each area of China, finally causing serious impact on public health. In 2016, at The Conference National on Environment and Health has clearly pointed out that the continuous fog weather and haze weather in China is closely related to the increasingly air pollution. Haze weath-er will cause more cardiovascular diseases and increase the risk of cancweath-er. The Ministry of Environmental Protection has published “2016 China environmental situation bulletin”. In this report, it is said that, in 2016, in 338 cities across the country, 254 of them exceed the standard of air quality, with a proportion of 75.1%. The air pollution is a severe environmental constraint for China’s eco-nomic development and it is also a major challenge to build an environ-ment-friendly society in China. Under this background, it is urgent and impor-tant thing to study air pollution. There is no doubt that China’s economic is de-How to cite this paper: Chen, F. (2018)
The Happiness Cost of Air Pollution. Low Carbon Economy, 9, 63-74.
https://doi.org/10.4236/lce.2018.92005
Received: March 23, 2018 Accepted: May 4, 2018 Published: May 7, 2018
Copyright © 2018 by author and Scientific Research Publishing Inc. This work is licensed under the Creative Commons Attribution International License (CC BY 4.0).
DOI: 10.4236/lce.2018.92005 64 Low Carbon Economy veloping, and the income level of the resident is improving all the time. So we cannot jump to conclusions when we discuss the influence of environmental pollution, because economic growth can bring environmental pollution.
At present, scholars mainly study the measurement of indicators of air pollu-tion, and the relationship between economic growth and air pollupollu-tion, but they pay less attention to study the air pollution to residents’ livelihood. Di Tella et al. [1] has pointed out that happiness has become an important index to measure people’s livelihood. At this stage, exploring the impact of environmental pollu-tion on residents’ happiness is a major problem to be solved in achieving “happy growth”.
Many disciplines have paid attention to “Subjective well-being”, such as eco-nomics, sociology, psychology and so on [2]. Subjective Well-being refers to “the individual’s subjective feelings about their life” [3] or “the overall feeling of hap-piness in life” [4]. In particular, SWB can describe people’s feeling about every-thing, for example, their feeling about life, about work, about environment and other things. Nowadays, it can be used in many things, but people always use it to draw the happiness for life. In recent years, foreign scholars have begun to study the impact of public goods such as environmental pollution on subjective well-being [5]. At present, China is in the situation of “stagnation of happiness”, and the continuous haze weather is one of the important reasons for the “low happiness”. Therefore, this paper analyzes the relationship between the subjec-tive well-being and air pollution and finally calculates the willingness of resi-dents to pay for the improvement of environment.
2. Literature Review
The most famous research on the relationship between environmental pollution and economic growth is the “environmental Kuznets curve” (EKC), which uses economic growth as an explanatory variable and uses environmental pollution as an explanatory variable. The economic growth is depicted on the horizontal axis, and the environmental pollution is depicted on the vertical axis. Finally, the economic growth and environmental pollution are found like “Inverted U” curve. On this basis, Grossman [6] proved the relationship between environ-mental quality and per capita GDP, and pointed out that “environenviron-mental pollu-tion in relatively will increase with the increase of per capita GDP when the in-come level is low, but with the development of GDP, the pollution will be less”. After that, scholars at home and abroad made further researches. Schmalensee et al.[7] uses piecewise linear function to study the relationship between the emis-sion of CO2 and the per capita GDP between 141 countries during the period of
1950 to 1990, and proves the existence of EKC. Millimet [8] uses application semi parametric model to study the relationship between the emission of nitro-gen dioxide and sulfur dioxide in various states of the United States and the GDP of each state, as well as proving the existence of EKC. Lau [9] uses an em-pirical study on the relationship between 1970-2010 CO2 emissions from
en-DOI: 10.4236/lce.2018.92005 65 Low Carbon Economy vironmental Cruz Nez curve. Gio-Vanis [10] uses the fixed effect, the dynamic panel and the two variable Logit model to make an empirical study on the rela-tionship between air pollution and family income in Britain from 1991 to 2009. The results show that the hypothesis of the inverted U curve is proved by other models other than the fixed effect model.
All in all, the above scholars’ research shows that developing cause environ-mental pollution. And we know that the cost of environenviron-mental pollution is very serious, and one of them is the impact on our well-being. The economic research thought of humanism encourages us to consider subjective perception, and hap-piness is the main index to measure human subjective dynamic. Research on the relationship between happiness and environmental pollution is rising. Air pollu-tion affects the decline of happiness mainly through the following three conduc-tion paths. First, air polluconduc-tion causes the decline of human immunity, increases the sensitivity of the pathogen to the pathogen, and thus increases the incidence of disease, which affects the well-being index of people through the transmission mechanism for the health of the people. Secondly, air pollution increases the adverse degree to the living of the residents from the higher level. It affects the quality of life of the residents. Air pollution causes frequent fog and haze, which leads to restricted road operation and obstructed air operation; air pollution also leads to lower atmospheric visibility, which leads to frequent traffic accidents, and then affects the residents’ living and welfare index. Finally, air pollution also accelerated the depreciation of fixed assets, such as the frequent occurrence of acid rain events, which accelerated the depreciation of the buildings, resulting in serious losses to the national property, and thus affected the well-being index of the residents.
Sustained economic growth brings environmental pollution, since twenty-first Century. Foreign scholars have attached great importance to the study of happi-ness economics. Welsch [11] put SO2 and NO2 as a measurement of air quality
DOI: 10.4236/lce.2018.92005 66 Low Carbon Economy different provinces and cities in China, and found that the influence of work and living environment on happiness is different between regions. Zheng Junjun, Liu Can, Li Chengzhi etc. use the ordered logit model to analyze the influence of en-vironmental pollution factors to happiness, and discuss those problems between different age groups, region groups. The results show that there is no difference between different groups when we discuss the impact of environmental pollu-tion on the happiness [15]. So it is not difficult to see that there is an inherent link between the subjective well-being and the air pollution. However, the cur-rent research on happiness in China is mainly focused on the impact of income inequality on happiness [16], to explore the impact of inflation on residents’ happiness [17], to explore the relationship between public expenditure and hap-piness [18], but pays less attention on the impact of air pollution to the well-being of residents.
To sum up, the shortcomings of the above research are as follows: first, few scholars have studied the difference between groups of air pollution and resi-dents’ happiness; secondly, there are less articles which discuss the resiresi-dents’ willingness to pay for environmental pollution.
3. The Selection of Related Indexes and Analysis of the
Model
3.1. The Selection of Related Indexes
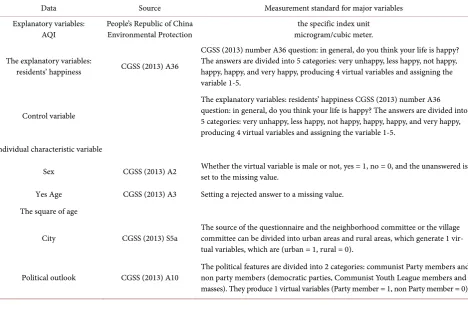
This paper mainly uses the AQI (air quality index) as a measurement of the de-gree of the air pollution index, the datas of AQI in various provinces and cities comes from the environmental protection of People’s Republic of China, The National Statistical of China (2013), the announcement that are came up with Chinese Ministry of environmental protection.
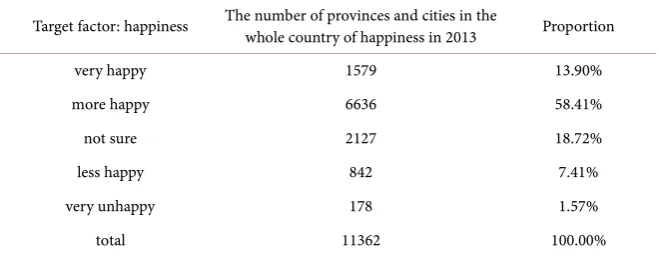
The index of happiness refers to the relevant indicators to measure the specific satisfaction of residents. The data on happiness of Chinese residents in this ar-ticle mainly comes from the Chinese General Social Survey (CGSS). It is the offi-cial authoritative data that is recognized throughout the country at present. The happiness about Chinese residents in CGSS (2013) is: in general, do you think your life is happy? (A36). There are five kinds of answers: “very unhappy”, “less happy”, “not happy or unhappy”, “more happy” and “very happy”. According to the previous study, this paper will assign it to 1-5. And the following results are shown in Table 1.
DOI: 10.4236/lce.2018.92005 67 Low Carbon Economy
Table 1. The basic distribution of Chinese residents’ happiness index in 2013.
Target factor: happiness The number of provinces and cities in the whole country of happiness in 2013 Proportion
very happy 1579 13.90%
more happy 6636 58.41%
not sure 2127 18.72%
less happy 842 7.41%
very unhappy 178 1.57%
total 11362 100.00%
And this article put them all in Table 2. We can see from Table 2, which shows the average index of Chinese residents. Data sources use STATA to com-pile the national statistical yearbook. Happiness is about 3.16, which is more than the middle value. AQI index of the average city is 80.19, AQI index showed a rising trend from the view of social trust, social integrity, social equity, the as-signment in the middle level. The detail of Table 2 can be seen from Table 3.
3.2. Ordered Probit Model
This paper uses model which is put by Di Tella, in order to estimate the impact of air pollution on the well-being of the residents. The model is like this:
ln
ij j ij i j ij
H =βpollution +λ Income +θX +χY +µ .
Among them, Hij represents the happiness level of resident I in the area. J.
pollutioni indicates the air pollution level of the city J. As we mentioned before,
we use the AQI index of every city as a measurement index, λlnIncomeij
represents the logarithm of household income. Xi is a set of individual
characte-ristic variables, which mainly include the age, political outlook, marital status, and individual character variables of the individual I. Yj is mainly expressed as
the city characteristic variables of the J, which mainly includes the per capita GDP of various provinces and cities. Because happiness is an ordinal discrete va-riable that can be ordered from 1 to 5, the ordinary OLS regression analysis is not applicable. Therefore, this paper uses Ordered Probit model to analyze.
3.2.1. Result Analysis
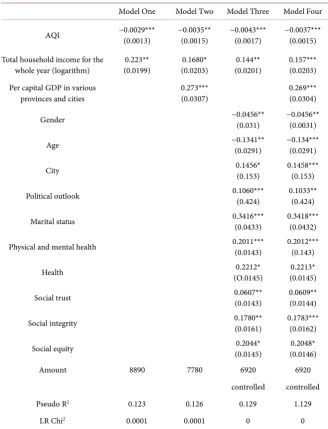
According to the above equation mentioned above, using Ordered Probit to analyse model, we can obtain the following results. The first row to the fourth row respectively joins total household income (logarithmic), per capital GDP, individual characteristic variables, including all variables in the model (Table 4).
DOI: 10.4236/lce.2018.92005 68 Low Carbon Economy
Table 2. Description statistics of variables.
Variables Minimum Maximum Mean value Deviation Standard
Residents’ happiness 1 5 3.76 0.84
AQI 12.05 192.28 80.19 32.03
Gender 0 1 0.48 0.51
Age 5 63 46.7 15.01
City 0 1 0.56 0.49
Political outlook 0 1 0.14 0.34
Marital status 0 1 0.79 0.34
Nation 1 7 1.23 1.25
Physical and mental health 1 5 2.07 0.95
Health 1 5 3.73 1.08
Total household income for
the whole year (logarithm) 9.21 12.1 10.8 0.94
Social trust 1 5 3.28 1.03
Social integrity 1 5 3.05 1.02
Social equity 1 5 3 1.04
Per capital GDP in various
provinces and cities 22922 99607 47046.55 20776.72
Table 3. Variables.
Data Source Measurement standard for major variables
Explanatory variables:
AQI People’s Republic of China Environmental Protection microgram/cubic meter. the specific index unit
The explanatory variables:
residents’ happiness CGSS (2013) A36
CGSS (2013) number A36 question: in general, do you think your life is happy? The answers are divided into 5 categories: very unhappy, less happy, not happy, happy, happy, and very happy, producing 4 virtual variables and assigning the variable 1-5.
Control variable
The explanatory variables: residents’ happiness CGSS (2013) number A36 question: in general, do you think your life is happy? The answers are divided into 5 categories: very unhappy, less happy, not happy, happy, happy, and very happy, producing 4 virtual variables and assigning the variable 1-5.
Individual characteristic variable
Sex CGSS (2013) A2 Whether the virtual variable is male or not, yes = 1, no = 0, and the unanswered is set to the missing value.
Yes Age CGSS (2013) A3 Setting a rejected answer to a missing value. The square of age
City CGSS (2013) S5a The source of the questionnaire and the neighborhood committee or the village committee can be divided into urban areas and rural areas, which generate 1 vir-tual variables, which are (urban = 1, rural = 0).
[image:6.595.66.535.423.736.2]DOI: 10.4236/lce.2018.92005 69 Low Carbon Economy Continued
Marital status CGSS (2013) A69
The marital status is divided into 2 categories: single (unmarried, cohabiting, divorced, widowed) and non single (first marriage with spouses, remarriage with spouses, separation without divorce), and a virtual variable (single = 1, non single = 0) is set up as a missing value.
Religion CGSS (2013) A5
Religion can be divided into Buddhism, Taoism, folk belief, Muslim/Islam, Catholicism, Christianity, Orthodox Church, other Christianity, Judaism, Hinduism, and other 12 kinds of variables, have produced 11 virtual variables, which set the refusal answer to the missing value.
Nation CGSS (2013) A4 The ethnic groups are divided into 7 categories: Han, Mongolian, Manchu, Hui, Tibetan, Zhuang and others. They produce 6 virtual variables, and refuse to answer as missing values.
Physical and mental health CGSS (2013) A17 The degree of frustration that has been felt over the past four weeks is divided into 5 categories: always, often, sometimes, rarely, and never altogether, producing 4 virtual variables, which will be set up as virtual values.
Health CGSS (2013) A15 The health level is divided into 5 categories, which are unhealthy, unhealthy, general, healthy and healthy. 4 virtual variables are produced, and the rejected answers are set to the missing values.
Total household income for the
whole year CGSS(2010)A62
The 1. 5% values of the upper and lower floating income and the lower income limit should be deleted to prevent the occurrence of outliers. The rejected answer is set to the missing value.
Social trust CGSS (2013) A33
The question is: in general, do you agree that most people in this society can be trusted? The answers are divided into 5 categories: very disagreement, comparison, disagreement, agreement disagreement, comparative consent, and very agreement. 4 virtual variables are produced, and the rejection answer is set as a missing value. And assigns the ordinal variable 1-5 respectively.
Social integrity CGSS (2013) A34
The question is: in general, do you agree or disagree with the fact that if you are careless in this society, others will try to take advantage of you? The answer is set to be very disagree, disagree, say not agree disagree, agree and agree altogether 5 kinds, produce 4 virtual variables, the setting of the refusal answer is the missing value. And assigns the ordinal variable 1-5 respectively.
Social equity CGSS(2013)A35
The question is: in general, do you think today’s society is unfair? The answer is set to be totally unfair, unfair, not fair, but not unfair, fair, and totally fair in all 5 categories. 4 virtual variables are generated, and the refusal answers are set to the missing values, and the variable 1-5 is assigned respectively.
Social characteristic variables
China’s Statistical Yearbook
(2013) of all provinces Municipalities GDP Take the per capita GDP of the provinces and cities of China to take the logarithm.
the health level. The level of people’s well-being is higher when people feel they are healthier. Finally, there is a positive relation between social trust, social jus-tice, social integrity and happiness.
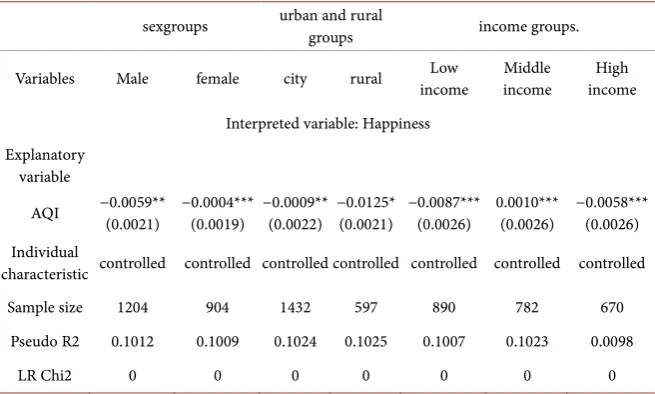
3.3.2. Study on the Happiness of Different Groups
DOI: 10.4236/lce.2018.92005 70 Low Carbon Economy
Table 4. Analysis of the relationship between residents’ subjective well-being and air pollution.
Model One Model Two Model Three Model Four
AQI −0.0029*** (0.0013) −0.0035** (0.0015) −0.0043*** (0.0017) −0.0037*** (0.0015)
Total household income for the
whole year (logarithm) (0.0199) 0.223** (0.0203) 0.1680* (0.0201) 0.144** 0.157*** (0.0203) Per capital GDP in various
provinces and cities 0.273*** (0.0307) 0.269*** (0.0304)
Gender −0.0456** (0.031) −0.0456** (0.0031)
Age −0.1341** (0.0291) −0.134*** (0.0291)
City 0.1456* (0.153) 0.1458*** (0.153)
Political outlook 0.1060*** (0.424) 0.1033** (0.424)
Marital status 0.3416*** (0.0433) 0.3418*** (0.0432)
Physical and mental health 0.2011*** (0.0143) 0.2012*** (0.143)
Health (O.0145) 0.2212* (0.0145) 0.2213*
Social trust 0.0607** (0.0143) 0.0609** (0.0144)
Social integrity 0.1780** (0.0161) 0.1783*** (0.0162)
Social equity (0.0145) 0.2044* (0.0146) 0.2048*
Amount 8890 7780 6920 6920
controlled controlled
Pseudo R2 0.123 0.126 0.129 1.129
LR Chi2 0.0001 0.0001 0 0
DOI: 10.4236/lce.2018.92005 71 Low Carbon Economy
Table 5. Analysis of the difference of the influence of air pollution on happiness—group regression analysis.
sexgroups urban and rural groups income groups.
Variables Male female city rural income Low Middle income income High
Interpreted variable: Happiness Explanatory
variable
AQI −0.0059** (0.0021) −0.0004*** (0.0019) −0.0009** (0.0022) −0.0125* (0.0021) −0.0087*** (0.0026) 0.0010*** (0.0026) −0.0058*** (0.0026)
Individual
characteristic controlled controlled controlled controlled controlled controlled controlled
Sample size 1204 904 1432 597 890 782 670
Pseudo R2 0.1012 0.1009 0.1024 0.1025 0.1007 0.1023 0.0098
LR Chi2 0 0 0 0 0 0 0
While taking the income situation into consideration also shows similar results, higher income group are less affected by air pollution, from the macro side, with the improvement of people’s income, people should decrease the tolerance de-gree to the environment, but the high income group who living in the cities where have more economic basis and conditions to solve the air quality prob-lems, for example, they can buy the house on the up-wind side, enjoy better medical facilities and other ways to enhance their sense of happiness, so they may not affect so much by environmental pollution.
3.4. Residents’ Willingness to Pay for Air Pollution
Air pollution is a kind of social public goods, and there is a certain difficulty in pricing it. This paper mainly uses the “subjective well-being” method to eva-luate, mainly through the measurement of more or less pollution to measure positive or negative effect on subjective well-being, and the positive effect of in-come increasing to happiness, so that to calculate the residents’ willingness to pay for environmental goods. On the basis of previous research, this paper as-sumes that the happiness can only be affected by the air pollution and the in-come level of residents can be liked as this: H = F (M, Q). H represents the sub-jective well-being of the residents, and M represents income and Q represents environmental pollution. Based on the above hypothesis, we can easily estimate the residents’ willingness to pay for air pollution. The principle is to regard all people as rational brokers. The hypothesis of utility maximization is that the marginal utility of air pollution reduction is equal to the marginal utility brought by income increase. Just as: dH = 0, the following formula can be obtained:
d d
M F Q
MV
Q F M
∂ ∂
= − =
∂ ∂
DOI: 10.4236/lce.2018.92005 72 Low Carbon Economy income and air pollution, we can measure the happiness cost of air pollution. According to the following formula, we can calculate the residents’ willingness to pay air pollution,
M
WTB Y Y
Q α β ∂
= − = −
∂
where α and β present the of air pollution and the marginal utility of the affec-tion between well-being and happiness. WTB represents the money that the res-idents can be able to pay while reducing air pollution. For this reason, we should first consider the calculation of marginal utility. By using the above method and ordered Probit model, we can come up with Table 5.
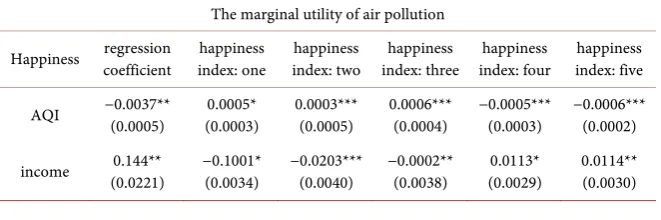
From Table 6, we can draw the average level of happiness is 3.76, close to the 4, so this paper use the happiness index of 4 to calculate the willingness to pay. The marginal utility of air pollution is −0.0005; the marginal effect of income is 0.0113; the average willingness to pay for pollution is 49,020 per person. Ac-cording to the above formula, we can conclude that the willingness to pay for air pollution: WTB = 0.0005/0.0113 × 49020 = 2169.03. This shows that when we image to keep the level of happiness stay in the same situation, each person is willing to pay 2169.03yuan per year to relieve air pollution.
4. Conclusions
This paper uses the ordinal regression equation to analyze the effect of air pollu-tion and people’s subjective well-being. The research results show that, after controlling for many factors, air pollution has a negative effect on the subject well-being of residents, On the basis of heterogeneity analysis, we find that people in different six groups, different living condition groups, and different income groups have different affections when facing air pollution. On the basis of above, we calculated the happiness cost of air pollution by subjective well-being method, and had an idea that: in order to maintain the same level of happiness, per resident were willing to pay 2169.03 yuan for decreasing one unit of air pollution.
[image:10.595.210.541.624.734.2]We can see from the past: since 21st century, we have always stressed the “beau-tiful China” goal. We are now living in a period of changing the style of eco-nomic growth. Promoting the structural reform from supply side has an impor-tant position. This paper studies the connection between subjective well-being
Table 6. The price of air pollution.
The marginal utility of air pollution
Happiness regression coefficient index: one happiness index: two happiness index: three happiness index: four happiness index: five happiness
AQI −0.0037** (0.0005) (0.0003) 0.0005* 0.0003*** (0.0005) 0.0006*** (0.0004) −0.0005*** (0.0003) −0.0006*** (0.0002)
DOI: 10.4236/lce.2018.92005 73 Low Carbon Economy and air pollution, and comes up with an conclusion that there is a negative affec-tion between them, and the male more than female, the people living in city more than in rural areas, low income group more than high income group are affected by the air pollution. Taking this phenomenon into consideration, the government should think more for low income group and people who are living in rural areas, considering every part of society. In a word, in the high speed growth of economic, we should pay attention to the quality of urbanization, and the control of air pollution, which will bring great social and economic value.
However, this paper still has some limitations. First, this paper uses the data of 2013, because we can only have the data from 2013, so it may not the same with today. Second, this paper use China as model, but we know, China has many provinces, so it is better to study on detail. Last, the paper gives the WTB, but not everyone wants to pay, so how we can persuade everyone to pay for chang-ing for better environment is still a problem. So this paper will keep on studychang-ing the different parts of China, and provide some better advice for government.
References
[1] Grossman, G.M. and Krueger, A.B. (1991) Environmental Impacts of a North American Free Trade Agreement. NBER Working Paper, NBER.
[2] Schmalensee, R., Stoker, T.M. and Judson, R.A. (1998) World Carbon Dioxide Emissions: 1950-205. Review of Economics and Statistics, 80, 15-27.
https://doi.org/10.1162/003465398557294
[3] Bertinelli, L. and Strobl, E. (2005) The Environmental Kuznets Curve Semi-Parametrically Revisited. Economics Letters, 88, 350-357.
https://doi.org/10.1016/j.econlet.2005.03.004
[4] Lau, L.S., Choong, C.K. and Eng, Y.K. (2014) Investigation of the Environmental Kuznets Curve for Carbon Emissions in Malaysia: Do Foreign Direct Investment and Trade Matter? Energy Policy, 68, 490-497.
https://doi.org/10.1016/j.enpol.2014.01.002
[5] Giovanis, E. (2013) Environmental Kuznets Curve: Evidence from the British Household Panel Survey. Economic Modelling, 30, 602-611.
https://doi.org/10.1016/j.econmod.2012.10.013
[6] Di Tella, R., MacCulloch, R. and Oswald, A. (2003) The Macroeconomics of Hap-piness. Review of Economics and Statistics, 85, 809-827.
https://doi.org/10.1162/003465303772815745
[7] Huang, Y.M. and He, L.Y. (2013) Urbanization, Environmental Pollution and the Subjective Well-Being of Residents—Empirical Evidence from China. China Soft-ware Science,12, 82-93
[8] Cantril, H. (1965) Pattern of Human Concerns. Rutgers University Press, New Brunswick, NJ.
[9] Campbell, A. (1976) Subjective Measures of Well-Being. American Psychologist, 31, 117-124. https://doi.org/10.1037/0003-066X.31.2.117
[10] Luechinger, S. and Raschky, P.A. (2009) Valuing Flood Disasters Using the Life Sa-tisfaction Approach. Journal of Public Economics, 93, 620-633.
https://doi.org/10.1016/j.jpubeco.2008.10.003
Qual-DOI: 10.4236/lce.2018.92005 74 Low Carbon Economy ity. Journal of Public Economics, 96, 669-880.
[12] Juncal, C., de Gracia, P. and Fernando (2014) New evidence for Spain. Social Indi-cators Research, 66, 32-50
[13] Ferreira, S., Akay, A., Brereton, F., et al. (2013) Life Satisfaction and Air Quality in Europe. Ecological Economics, 88, 1-10.
[14] Menz, T. (2011) Do People Habituate to Air Pollution? Evidence from International Life Satisfaction Data. Ecological Economics, 71, 211-219.
https://doi.org/10.1016/j.ecolecon.2011.09.012
[15] Zheng, J.J., Liu, C. and Li, C.Z. (2015) The Influence of Environmental Pollution on Chinese Residents’ Happiness—An Empirical Analysis Based on CGSS. Journal of Wuhan University (Philosophy and Social Sciences), 4, 66-73.
[16] Hu, H.S. and Lu, Y.P. (2012) Public Expenditure and Subjective Sense of Happiness of Farmers—An Empirical Analysis of CGSS Data Based on. Finance & Economics, 10, 23-33.
[17] Hu, H.S. and Lu, Y.P. (2012) Income Inequality, Health and Subjective Well-Being: Empirical Evidence from the Background of China’s Aging. China Soft Science, 11, 41-56.