FORCE PRESSURE SENSOR BASED ON MICROBEND
Dr. Bushra R. Mhdi, Alaa Thaer Lateef
Department of Physics, JNTUH College of Engineering Hyderabad, Jawaharlal Nehru Technological University,
ARTICLE INFO ABSTRACT
The fiber optic sensors are small, electrically isolated and immune
an correct choice to detect the vibration ,cracks on building and environment factors Practically, microbend fiber optic pressure force sensors are limited to intensity
(or phase
the response of a force pressure optical fiber sensor .The relation between the output power and the applied force pressure show that an optical fiber sensor with these design c
measuring the force/stress applied to a mechanical structure or which it is linked, by optimizing the uses of appropriate materials for constituting the sensor support. In this work ,the transmitted beam power through the optical f
sensitivity .A multimode optical fiber (50,125) is pressed by using force in the range (5 multimode fiber. The fiber is passed through microbend cell made from Al material (3.2
Copyright © 2015 Dr. Bushra R. Mhdi et al. This is an open access article distributed under the Creative Commons Att unrestricted use, distribution, and reproduction in any medium, provided the original work is properly cited.
INTRODUCTION
In fiber optic sensor the heart of the sensor is an optical fiber. By using optical fiber sensing devices one can measure or monitor different physical and chemical parameters in terms of one of the principal parameters that describe the light beams [3]. These principal parameters include light intensity, phase, polarization and wavelength. An optical fiber sensor it is a device that converts light rays in to electronic signals. Similar to a photo resistor, fiber optic sensors (FOS) work like other electrical sensors except that the FOS uses a glass fiber instead of copper wire and light instead of electricity. It measures the physical quantity of light and translates by the instrument. One of the features of an optical sensor is its ability to measure the changes from one or more light beams. This change is most often based around alterations to the intensity of the light. Optical sensors can work either on the single point method or through a distribution of points. Through the single point method, a sole phase change is needed to a
.In terms of the distribution concept; the sensor is reactive along series of sensors or single fiber optic. Optical fibers are also attractive for other applications such as in sensing, control and instrumentation. In the simplest form,
sensor is composed of a light source, optical fiber; sensing element and a detector [11,12].
*Corresponding author: Alapati D. Malleswara Rao,
Physics, JNTUH College of Engineering Hyderabad, Jawaharlal Nehru Technological University, Hyderabad, Andhra Pradesh, India
ISSN: 0975-833X
Article History:
Received 07th December, 2014
Received in revised form 28th January, 2015
Accepted 07th February, 2015
Published online 17th March,2015
Key words:
Microbend, Intensity modulation, Photodetector, Force, Sensing region.
RESEARCH ARTICLE
FORCE PRESSURE SENSOR BASED ON MICROBEND OPTICAL FIBER
Dr. Bushra R. Mhdi, Alaa Thaer Lateef and *Alapati D. Malleswara Rao
College of Engineering Hyderabad, Jawaharlal Nehru Technological University,
Hyderabad, Andhra Pradesh, India
ABSTRACT
The fiber optic sensors are small, electrically isolated and immune
an correct choice to detect the vibration ,cracks on building and environment factors Practically, microbend fiber optic pressure force sensors are limited to intensity
(or phase-modulated) methodologies. The main purpose of this project we propose an analyzing of the response of a force pressure optical fiber sensor .The relation between the output power and the applied force pressure show that an optical fiber sensor with these design c
measuring the force/stress applied to a mechanical structure or which it is linked, by optimizing the uses of appropriate materials for constituting the sensor support. In this work ,the transmitted beam power through the optical fiber due to force pressure on optical fiber to determine the pressure sensitivity .A multimode optical fiber (50,125) is pressed by using force in the range (5
multimode fiber. The fiber is passed through microbend cell made from Al material 7.5) cm.
is an open access article distributed under the Creative Commons Att use, distribution, and reproduction in any medium, provided the original work is properly cited.
heart of the sensor is an optical fiber. By using optical fiber sensing devices one can measure or monitor different physical and chemical parameters in terms of one of the principal parameters that describe the light beams include light intensity, phase, polarization and wavelength. An optical fiber sensor it is a device that converts light rays in to electronic signals. Similar to a photo resistor, fiber optic sensors (FOS) work like other FOS uses a glass fiber instead of copper wire and light instead of electricity. It measures the physical quantity of light and translates by the instrument. One of the features of an optical sensor is its ability to measure the ght beams. This change is most often based around alterations to the intensity of the light. Optical sensors can work either on the single point method or through a distribution of points. Through the single point method, a sole phase change is needed to activate the sensor .In terms of the distribution concept; the sensor is reactive along series of sensors or single fiber optic. Optical fibers are also attractive for other applications such as in sensing, control and instrumentation. In the simplest form, an optical fiber sensor is composed of a light source, optical fiber; sensing
Alapati D. Malleswara Rao, Department of
Physics, JNTUH College of Engineering Hyderabad, Jawaharlal University, Hyderabad, Andhra Pradesh, India
Microbending Sensor
An optical microbending sensor is built to create periodical microbendings of optical fiber at a short part of it. The sensor structure is simple; can be created by a pair of deformation plates which cause bends of fiber in a regular pattern is shown in Figure (1) [36]. Sensing region are consist of two corrugated plates. The fiber is pressed between these plates by applying different forces to the top plate. Optical fiber passes through these corrugated plates. Both ends of the fiber inside the sensor are relaxed to keep away elastic factors of the fiber. Λ is the mechanical periodicity (deformer tooth spacing), the corrugation size (thickness of the spacer material between the deformer plates) and cylindrical grooves are the corrugations (bends). When an optical fiber is bent, it causes the output intensity to decrease due to the loss at the bend. Therefore, when an external force is applied to the apparatus shown in Figure (1), the output intensity will decrease. This output intensity is inversely related to the applied force. Because light is entirely confined to the fiber, the possibility of environmental contamination is eliminated. Temperature, acceleration, strain, displacement
natural parameters to be measured using this technique [37,38]. Microbend loss occurs when small bend in the core cladding interface of the optical fiber causes the propagating light intensity to be coupled out of the core,
microbend sensor, microbend losses are in curried mechanically, when an external force caused the optical fiber to be squeezed between corrugated plate
Available online at http://www.journalcra.com
International Journal of Current Research
Vol. 7, Issue, 03, pp.13246-13250, March, 2015
INTERNATIONAL
z
OPTICAL FIBER
Malleswara Rao
College of Engineering Hyderabad, Jawaharlal Nehru Technological University,
The fiber optic sensors are small, electrically isolated and immune to electromagnetic field, they are an correct choice to detect the vibration ,cracks on building and environment factors Practically, microbend fiber optic pressure force sensors are limited to intensity-modulated and interferometric
) methodologies. The main purpose of this project we propose an analyzing of the response of a force pressure optical fiber sensor .The relation between the output power and the applied force pressure show that an optical fiber sensor with these design can covenanting allow the measuring the force/stress applied to a mechanical structure or which it is linked, by optimizing the uses of appropriate materials for constituting the sensor support. In this work ,the transmitted beam iber due to force pressure on optical fiber to determine the pressure sensitivity .A multimode optical fiber (50,125) is pressed by using force in the range (5-50) N at (1) m multimode fiber. The fiber is passed through microbend cell made from Al material at dimension
is an open access article distributed under the Creative Commons Attribution License, which permits
An optical microbending sensor is built to create periodical microbendings of optical fiber at a short part of it. The sensor structure is simple; can be created by a pair of deformation lates which cause bends of fiber in a regular pattern is shown Sensing region are consist of two corrugated plates. The fiber is pressed between these plates by applying different forces to the top plate. Optical fiber passes these corrugated plates. Both ends of the fiber inside the sensor are relaxed to keep away elastic factors of the fiber. Λ is the mechanical periodicity (deformer tooth spacing), ls is the corrugation size (thickness of the spacer material between rmer plates) and cylindrical grooves are the When an optical fiber is bent, it causes the output intensity to decrease due to the loss at the bend. Therefore, when an external force is applied to the apparatus output intensity will decrease. This output intensity is inversely related to the applied force. Because light is entirely confined to the fiber, the possibility of environmental contamination is eliminated. Temperature, acceleration, strain, displacement, vibration, and pressure are natural parameters to be measured using this technique Microbend loss occurs when small bend in the core-cladding interface of the optical fiber causes the propagating light intensity to be coupled out of the core, for purpose of microbend sensor, microbend losses are in curried mechanically, when an external force caused the optical fiber
ueezed between corrugated plate.
Figure 1. Geometry of microbending sensor
The general equation used in modeling and designing microbend Sensor's eq (1). The change in
transmission (ΔT), propagation through a microbend sensor is a function of a constant (D) and the environmental change (ΔE), in addition, (ΔE) results in the deformation plates applying a force (ΔF) to the bend fiber, theory causing a deformation of the fiber by an amount (ΔX),the deformation is often expressed as the product of the environmental change time the constant or
ΔX=DΔE
ΔT = (ΔT/ ΔX) D.ΔE
[39] Equation (2) written in the terms of the force ΔF applied to the bent fiber becomes
∆ = ∆
∆ ∆
ƭ+ s s
s ¯ˉ¹
∆ = (∆ /∆ ) ∆ ᴀ ( ƭ+ s s/ s)
Where the change in pressure is denoted by (ΔP), pressure area
( ). Therefore if ( ) so small such that the effective
conformity of the pressure sensor is deformation by that of the bent fiber, then equation (4) reduced in equation (5)
Where
ˉˡ= Ʌ
2 ⁴
Represent (d) fiber diameter, (η) number of bend. When designing a microbend fiber optical sensor, equation (5) is an
important parameter, the term ( ‾¹) is recognized as the
effective spring constant for the assembled microbend sensor. The effective spring constant is a function of the deformation tooth spacing ( ), the force constant involved with
the length of the deformer spacers. The coefficient ΔT/ΔX, which relates the change in transmission to the change in fiber deformation amplitude, depends on the modal properties of the fiber. The change in optical transmission through the bent fib results in a change in optical energy incident on the photodetector. The change in the photodetector output signal is
13247 Dr. Bushra R. Mhdi et al. Force press
Geometry of microbending sensor
The general equation used in modeling and designing microbend Sensor's eq (1). The change in the light propagation through a microbend sensor is a function of a constant (D) and the environmental change (ΔE), in addition, (ΔE) results in the deformation plates applying a force (ΔF) to the bend fiber, theory causing a of the fiber by an amount (ΔX),the deformation is often expressed as the product of the environmental change
(1)
(2)
Equation (2) written in the terms of the force ΔF applied
(3)
(4)
Where the change in pressure is denoted by (ΔP), pressure area
) so small such that the effective
deformation by that of the bent fiber, then equation (4) reduced in equation (5)
(5)
Represent (d) fiber diameter, (η) number of bend. When designing a microbend fiber optical sensor, equation (5) is an ) is recognized as the effective spring constant for the assembled microbend sensor. The effective spring constant is a function of the deformation ), the force constant involved with changing the length of the deformer spacers. The coefficient ΔT/ΔX, which relates the change in transmission to the change in fiber deformation amplitude, depends on the modal properties of the fiber. The change in optical transmission through the bent fiber results in a change in optical energy incident on the photodetector. The change in the photodetector output signal is
thus used to detect the original environmental perturbation ΔE. Depending on the construction of the deformer, various environmental parameters can in principle be sensed.
Experimental work
The light may be lost from an optical
radius of the fiber exceeds the critical angle necessary to confine the light to the core area and there is leakage into the cladding. Local microbending of the
occur. As a result intensity modulation of light propagating through an optical fiber will occur. The schematic block diagram of microbend optical fiber sensor system is shown in the Figure (2). A typical layout o
consisting of a light source, a section of optical in a microbend transducer designed to intensity in response to an environmental e
cases the microbend transducer can be imp
special fiber cabling or optical fiber that is simply optimized to be sensitive to microbending loss. The
[image:2.595.309.557.308.404.2]the experimental work is shown in Figure (3).
Figure 2. The schematic diagram of experimental work
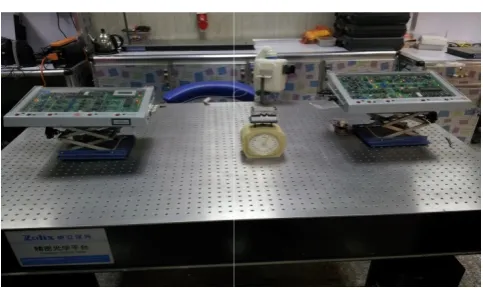
Figure 3. Photograph picture of the experimental work
The experimental setup is consists of an optical source (LED, Light emitting diode, optical fiber, sensing cell or modulator element, an optical detector (photodiode), optical spectrum analyzer and processing electronics.
Light source
The light emitting diode is used as feeding source for fiber optic cable at wavelength 592nm, orange color. The power is equal to (4.5 µW). The package of transmitter LED is proved from Promax company at model Fiber optic Communications system Emitter EF-970/E is shown in
contains the driver circuit of light emitting diode at different
Dr. Bushra R. Mhdi et al. Force pressure sensor based on Microbend optical Fiber
thus used to detect the original environmental perturbation ΔE. Depending on the construction of the deformer, various
rameters can in principle be sensed.
The light may be lost from an optical fiber when the bend fiber exceeds the critical angle necessary to fine the light to the core area and there is leakage into the microbending of the fiber can cause this to occur. As a result intensity modulation of light propagating fiber will occur. The schematic block diagram of microbend optical fiber sensor system is shown in the Figure (2). A typical layout of this type of sensor consisting of a light source, a section of optical fiber positioned in a microbend transducer designed to intensity-modulate light
in response to an environmental effect, and a detector. In some
cases the microbend transducer can be implemented by using fiber cabling or optical fiber that is simply optimized to be sensitive to microbending loss. The photograph picture of
is shown in Figure (3).
schematic diagram of experimental work
picture of the experimental work
The experimental setup is consists of an optical source (LED, Light emitting diode, optical fiber, sensing cell or modulator element, an optical detector (photodiode), optical spectrum analyzer and processing electronics.
[image:2.595.313.555.426.570.2]wavelength. The power of LED is controlled by driver current circuit which appears in digital screen.
Microbend deformer cells
The microbend sensor employs a fiber between two ridged plates with an optimum periodicity depending upon the modal properties of the fiber. (This periodicity is typically in the millimeter range). A displacement of the plates changes the amplitude of the bends resulting in intensity modulation. The schematic diagram of geometry design of a sensing region for the microbend sensor is shown in Figure (5) and the photograph picture is shown in Figure (6). The sensing region consists of two modulation cells. The cell is designed and constructed at two corrugated plates. It is made from Al material block ,which is operated by cutter wire technique. The
microbend cells dimensions are (3.2.cm * 7.5cm), mechanical
[image:3.595.41.290.87.223.2]periodic Ʌ equal (5mm), ls equal( 5 & 6 mm).
Figure 5. The geometric design of microbend cell
Figure 6. The photograph picture of microbend cells
The receiver
[image:3.595.311.559.179.274.2]This unit is used to drive the detectors at different spectrum range. The power is measured from output fiber. This kit is provided from Promax company at model Fiber optic communications system-Receiver EF-970/R. which is shown in Figure (7). This kit includes the digital screen to display the output power in watt & dB and four input terminal each terminal for the one wavelength. It is adjustable to select which terminal input power according the testing wavelength.
Figure 7. The photograph picture of receiver Kit
RESULTS AND DISCUSSION
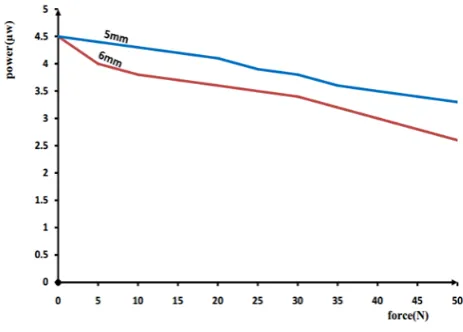
The wavelength λ=592nm is transmitted through MMF, where this fiber is passing through microbend cell at 5 mm or 6 mm. The relation between applied pressure force and the output power is shown in Fig (8). From this figure the increase of applied force at range from 5N to 50N caused to decreased the output power. The reference power means no applied force on two microbend cells is 4.5 µw. The output power from (5mm) microbend cell change from 4.5µw to 3.3µw at the force range from 0N to 50 N at step 5 N and the output power from the second microbend cell (6mm) ranges from 4.5µw to 2.6 µw at the same range of applied force. This figure shows the output power at 6mm microbend cell is less than 5mm microbend cell because of the microbend cell 6 mm model is greater bend fiber than the 5 mm model, that means increased the bend losses. The calculated output power of two model of microbend cells is shown in Figure (8)
The power loss (in percent) of the light transmitted power through the fiber optic as a result of bending deflection was determined from the following equation (4-1)
[image:3.595.42.271.433.556.2]The image part with relationship ID rId23 was not found in the file.
Figure 8. The output power for two microbend cells Figure 4. The photograph of the transmitter Kit
13248 International Journal of Current Research, Vol. 7, Issue, 03, pp.13246-13250, March,2015
[image:3.595.316.548.527.693.2]l = s ḍ
s
Where
Pl is the power loss, Ps is the power measured for straight fiber
optic, and Pd is the power measured for deflected fiber optic of
the same length. The calculated output power loss of two model of microbend cells is shown in Figure (9)
From this Fig(9) the power loss of 6mm microbend cell is greater than the power loss of 5mm microbend cell. From this figure we can show the losses of 5mm microbend cell is less than the losses of 6mm microbend cell.
dimensionless measurement of the ability of me
light. Absorbance (A) occurs when a photon emitted from a light source excites an electron from a ground state to higher energy orbital, it is represented by the following equation [94] .
ʎ= − ʎ
ʎ˳
Where
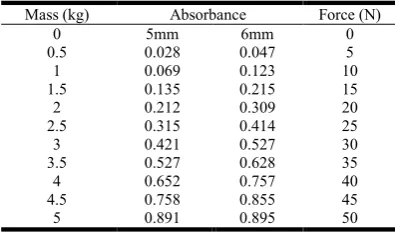
is the absorbance at specific wavelength (λ), Iλ is the intensity of the light at wavelength λ, Iλᴏ is the intensity of the incident light at wavelength λ before it enters the sample. absorbance is calculated for two microbend cells is shown in table (1). The relation between applied force and calculate absorbance is shown in Fig (10). From this fi
[image:4.595.310.552.56.195.2]absorbance of 6mm model is greater than model 5mm. The maxim value of absorbance for 6 mm is 0.985 and 0.891 for 5mm.
Table 4.4. The result of absorbance
Absorbance Mass (kg)
6mm 5mm
0
0.047 0.028
0.5
0.123 0.069
1
0.215 0.135
1.5
0.309 0.212
2
0.414 0.315
2.5
0.527 0.421
3
0.628 0.527
3.5
0.757 0.652
4
0.855 0.758
4.5
0.895 0.891
[image:4.595.44.279.158.318.2]5
Figure 9. The output power losses for two microbend
13249 Dr. Bushra R. Mhdi et al. Force pressure sensor based on Microbend optical Fiber
(6)
is the power measured for straight fiber is the power measured for deflected fiber optic of the same length. The calculated output power loss of two model of microbend cells is shown in Figure (9)
power loss of 6mm microbend cell is greater than the power loss of 5mm microbend cell. From this figure we can show the losses of 5mm microbend cell is less than the losses of 6mm microbend cell. Absorbance is dimensionless measurement of the ability of media to absorb light. Absorbance (A) occurs when a photon emitted from a light source excites an electron from a ground state to higher energy orbital, it is represented by the following equation (4-2)
(7)
is the absorbance at specific wavelength (λ), Iλ is the is the intensity of the incident light at wavelength λ before it enters the sample. The absorbance is calculated for two microbend cells is shown in table (1). The relation between applied force and calculate absorbance is shown in Fig (10). From this figure the absorbance of 6mm model is greater than model 5mm. The maxim value of absorbance for 6 mm is 0.985 and 0.891 for
The result of absorbance
Force (N) 0 5 10 15 20 25 30 35 40 45 50
Figure 10. The relation between absorbance and applied force
From all these results are shown by microbending cells the fiber is bent to critical angle and some modes escape from the core to the cladding. It leads to changes in the intensity of back-scattered radiation from the place of effect. The plates in response to a change of physical quantity
on the fiber, creating microbendings of the fiber. The change in transmission rate will be appears as a change in optical power detected by the photo detector
Conclusion
In this experiment, we have ve
losses are due to the changing in the applied force. When the force increases that lead to increase in losses and we Observed that the losses in microbend 6mm greater than microbend 5mm. By studying a generic design, the mic
been examined and optimized.The power results of 6mm cell at different applied force are less than 5mm.The intensity results of 6mm cell at different applied force are less than 5mm.The microbend effect was studied experimentally in multimode fiber at different microbend cells, and it was found
that with a value (5and6) mm cause significant losses which
can dramatically minimize at (5mm) microbend cell than (6mm).The absorbance results of 5mm cell at different applied force are less than 6mm.
REFERENCES
[1] Olshansky, R. 1975.
Cabled Optical Fiber”, Appl,
[2] Fiber Optic Sensors Principles and Applications by
B.D. Gupta, 2006.
[3] Measures, R.M., M. Leblanc, L.K,
”Fiber Optic Sensor For Smart Structures”, Optics and Lasers in Engineering , pp. 127
[4] Lequime, M. 1997. “Fiber Sensors for Industrial
Applications," in Proceedings of the 12th International Conference on Optical Fiber Sensors, vol. 16 of OSA Technical Digest Series, pp. 66
DC, USA.
[10] Murtaza, G., S. L. Jones, J. M. Senior, and N. Haigh,
2000. “Loss Behavior of single microbend sensors".
Figure 9. The output power losses for two microbend
Dr. Bushra R. Mhdi et al. Force pressure sensor based on Microbend optical Fiber
The relation between absorbance and applied force
From all these results are shown by microbending cells the fiber is bent to critical angle and some modes escape from the core to the cladding. It leads to changes in the intensity of scattered radiation from the place of effect. The plates in
e to a change of physical quantity ΔE act by force ΔF
on the fiber, creating microbendings of the fiber. The change in transmission rate will be appears as a change in optical power detected by the photo detector
In this experiment, we have verified the fact that microbend losses are due to the changing in the applied force. When the force increases that lead to increase in losses and we Observed that the losses in microbend 6mm greater than microbend By studying a generic design, the microbend sensor has been examined and optimized.The power results of 6mm cell at different applied force are less than 5mm.The intensity results of 6mm cell at different applied force are less than 5mm.The microbend effect was studied experimentally in mode fiber at different microbend cells, and it was found
with a value (5and6) mm cause significant losses which can dramatically minimize at (5mm) microbend cell than (6mm).The absorbance results of 5mm cell at different applied
1975. ”Model Distortion Losses in Appl, opt. 14, 20.
Fiber Optic Sensors Principles and Applications by
M. Leblanc, L.K, S. Ferguson, 1992. ”Fiber Optic Sensor For Smart Structures”, Optics and
Engineering , pp. 127–52.
[image:4.595.63.261.633.749.2][13] The best way for transmission information is using laser wavelength because it has high intensity compared with another wavelength at low losses.
[15] Lúcia, B., Nélia Alberto, João L. Pinto and Rogério Nogueira, 2012. "Optical Sensors Based on Plastic Fibers ", Sensors , ISSN 1424-8220.
[16] Shaveta, T. Pratima Manhas, 2011. "Fiber Optic
Sensors Technology & their Applications", IJECT Vol. 2, Issue 2.
[20] Udd, E. 1995. “An Overview Of Fiber Optic Sensors”, Review of Scientific Instruments, vol. 66, no. 8, pp. (4015-4030).
[21] Casas, J. R.and Paulo, J. S. 2003. "Fiber Optic Sensors
for Bridge Monitoring", Journal of Bridge Engineering ASCE.
[23] Schulz, W., Udd, E. J. Seim, J. Corones, and H. M. Laylor, 1998. "Fiber Optic Sensors for Infrastructure Applications" , Oregon Department of Transportation, Washington D.C.
[24] Schulz, W., Udd, E. J. Seim, J. Corones and H. M.
Laylor, 1998. "Fiber Optic Sensors", Journal
Engineering ASCE.
[25] Fidanboylu, K. and Efendioglu, H. S., 2009. "Fiber
Optic Sensors And Their Applications", 5th
International Advanced Technologies Symposium (IATS’09), Karabuk, Turkey, May 13-15.
[27] Boswell, L. F. and B. McKinley. 2006. Use of optical fiber technology to measure structural performance,
Proceedings of the Tenth East Asian-Pacific
Conference on Structural Engineering and
Construction, Thailand. New hook JP. 2005 Developing an SHM system for FRP-strengthened beams. Proceedings of the 6thinternational symposium on NDE for health monitoring and diagnostics, San Diego, SPIE. [28] Sarazin, G. and Newhook, JP. 2004. Strain monitoring techniques for FRP laminates. Proceedings of the 2nd international conference on FRP in civil engineering, Adelaide.
[29] McKinley, B. and Boswell, L. F. 2002. Optical fiber systems for bridge monitoring. Proceedings of First International Conference on Bridge Maintenance, Safety and Management, Barcelona, Spain.
[31] P.K. Cheo, 1990. Fiber optics and optoelectronics. 2nd
Edition. Prentice-Hall International, New Jersey. [33] Ghatak, A.K. and K. Thyagarajan, 2002. Introduction to
Fiber Optics. Cambridge University Press. A.K. Ghatak and K. Thyagarajan .
[37] Pitt, G.D. 1985. "Optical-Fibre Sensors," IEE Proceedings, Vol. 132, Pt. J., No. 4, pp. 214-248. [38] Berthold III, J.W. 1994. "Historical Review of
Microbend Fiber Optic Sensors," Proc. 10th Optical Fibre Sensors Conference, pp. 182-185.
[39] Nicholas Lagakos, J. H. Cole and J. A. Bucaro, 1987. "Microbend Fiber-Optic Sensor", Applied Optics, vol. 26, No. 11 ,PP.2171-2180.
[40] Thomas, L. 2003. “Design, Fabrication and
Characterization Of Fiber Optic Sensor For Physical And Chemical Applications ", pp. 86, India.
[41] YoanyRodr´ıguezGarc´ıa, Jes ´ us M. Corres, and Javier
Goicoechea ,"Vibration Detection Using Optical Fiber
Sensor". spin, vol 10,No 13,1999.
[42] Pillai, P.K.C., Goal, T.C., Pandey, N.K. and S.K. Nijhawan, 1992. “Monitoring of High Pressure With Optical Fiber Sensor Using Microbends in The
Embedded Fiber“, International Journal of
Optoelectronics 14.
[43] Remouche, M., R. Mokdad and M. Lahrashe, 2007.
"Intrinsic Optical Fiber Temperature Sensor Operating by Modulation of the Local Numerical Aperture", Optical Engineering, Vol. 46, No. 2.
[45] Thomsen, R.M. 1999. "Optical Fiber Sensors: principles and state of the art", spin, Vol 19, No 4.
*******
13250 International Journal of Current Research, Vol. 7, Issue, 03, pp.13246-13250, March,2015