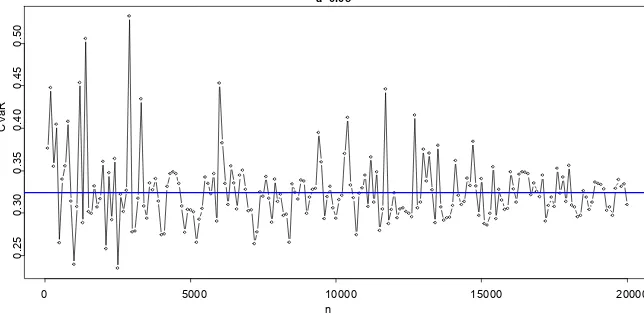
Strong Consistency of CVaR Optimal Estimator
Full text
Figure


Related documents
diallylacetic acid rather than bismuth since in one case in which analysis was performed only minute amounts of bismuth were recovered, and there was, in his opinion, ‘ ‘no
The goals of this project are to produce a web accessible data source to help measure Corps environmental performance, identify national trends in environmental quality, and
Field experiments were conducted at Ebonyi State University Research Farm during 2009 and 2010 farming seasons to evaluate the effect of intercropping maize with
Aims: Analysis of the prognostic values of blood pH and lactate and plasma metformin concentrations in severe metformin-associated lactic acidosis may help to resolve the
Portfolio characteristics include: the average % deviation of the actual to the normal inventory level at the time of ranking, the basis at the time of the ranking, the 12- month
Directorate Finances technological modernization and innovation in the productive sector Finances technological modernization and innovation in the productive sector FONTAR
• Class II workers who remove intact flooring using compliant work practices: 8-hours if initial specialized training covering the topics listed in the flooring
Purchase Area Title, LLC dba People's Title Company.. 400947 Howell
