ISSN Online: 2151-4844 ISSN Print: 2151-481X
DOI: 10.4236/sgre.2018.95006 May 30, 2018 75 Smart Grid and Renewable Energy
Different Storage-Focused PV-Based Mini-Grid
Architectures for Rural Developing
Communities
Nicholas Nixon Opiyo
Centre for Integrated Energy Research, School of Chemical and Process Engineering, University of Leeds, Leeds, UK
Abstract
Impacts of grid architectures on temporal diffusion of PV-based communal grids (community owned minigrids or microgrids) in a rural developing community are modelled and simulated using MATLAB/Simulink and a sur-vey-informed agent-based model (ABM) developed in NetLogo. Results show that decentralised control architectures stimulate minigrid formations and connections by allowing easy expansions of the minigrids as each decentral-ised PV system within a minigrid is treated equally and determines its own real and reactive power, eliminating the need for communication links. This also reduces the cost of implementing such a system; fewer connections are realized with centralised controls as such systems require high speed commu-nication links which make them both difficult to expand and expensive to im-plement. Results also show that multi-master operation modes lead to more communal grid connections compared to single-master operation modes be-cause in the former, all distributed PV systems within a communal grid have the same rank and can act as masters or can be operated as combinations of master generators (VSIs) and PQ inverters, allowing for more design flexibil-ity and easy connections from potential customers.
Keywords
Communal Grid, Control, Architecture, DC/AC-Coupling
1. Introduction
Modern energy services are fundamental to all three pillars of sustainable devel-opment, i.e. social, economic, and environmental. Most energy developments must be implemented in line with all aspects of the development process, e.g.
How to cite this paper: Opiyo, N.N. (2018) Different Storage-Focused PV-Based Mini-Grid Architectures for Rural Devel-oping Communities. Smart Grid and Re-newable Energy, 9, 75-99.
https://doi.org/10.4236/sgre.2018.95006
Received: May 7, 2018 Accepted: May 27, 2018 Published: May 30, 2018
Copyright © 2018 by author and Scientific Research Publishing Inc. This work is licensed under the Creative Commons Attribution International License (CC BY 4.0).
http://creativecommons.org/licenses/by/4.0/
DOI: 10.4236/sgre.2018.95006 76 Smart Grid and Renewable Energy
energy and communication, energy and health, energy and schools, energy and roads, etc. Energy is therefore a complementary factor to socio-economic devel-opment. Electricity, the main form of modern energy, is crucial to industrializa-tion and easy access to it is an indicator of a naindustrializa-tion’s standard of living. It is es-timated that there are about 632 million people in sub-Saharan Africa without access to electricity today and that 84% of these people reside in rural areas, and that this number is projected to rapidly increase, mainly due to population growth, unless sustained annual investments of about US$19.1 billion in elec-tricity generation and distributionare made [1]. Table 1 summarizes the above information.
[image:2.595.209.540.493.722.2]There are two possible routes to rural electrification i.e., through extensions of existing national utility grids from large central power generation systems or through decentralized systems namely communal grids and stand-alone micro-generation systems. National grid extensions are recommended where the load demands are high enough to make the costs of such investments reasonable. Communal grids are recommended for condensed villages or markets far from national grid lines but with potential economic values to warrant such tions. Stand-alone systems are recommended for isolated homesteads or installa-tions far from existing grid lines, other homesteads, or other installainstalla-tions. The International Energy Agency (IEA) estimates that only 30% of the people cur-rently without access to electricity in sub-Saharan Africa can be cost-effectively served through national grid extensions due to the sparseness of the rural popu-lations, rough terrains, low economic activities, and low load densities. The remaining 70% would be most cost-effectively served through decentralized systems, i.e. communal grids (52.5%) or stand-alone systems (17.5%) [2][3][4] [5][6]. The modular nature of microgeneration technologies allows for phased
Table 1. Electricity access in 2016 Regional Aggregates [1].
Region without electricity Population millions
Electrification rate %
Urban
electrification rate %
Rural
electrification rate % Developing countries 1185 79% 92% 67%
Africa 634 45% 71% 28%
North Africa 1 99% 100% 99% Sub-Saharan Africa 632 35% 63% 19% Developing Asia 512 86% 96% 79% China 0 100% 100% 100%
India 244 81% 96% 74%
Latin America 22 95% 98% 85% Middle East 18 92% 98% 78% Transition economies &
OECD 1 100% 100% 100%
DOI: 10.4236/sgre.2018.95006 77 Smart Grid and Renewable Energy
project implementations, enabling households and communities to initiate the modest power generation programs, and to modify their systems according to their changing energy needs. Depending on local resources, capacities, designs and technologies used, microgeneration systems could provide the final solu-tions to rural electrification in many developing nasolu-tions and entrench green economies in the process. In fact, it is estimated that there will be almost 400 TWh of installed microgeneration capacity by 2030, about 40% of new installed capacities towards universal electrification in developing nations [1].
Many factors influence choices of technologies used in rural electrification, the main ones being availability of resources, demand, investment costs, and lo-cal socio-politilo-cal and cultural environments. Different modelling tools and techniques have been applied in planning rural electrification paths in many countries. However, these often view this problem as a question of expansion of grid coverage through extensions of existing transmission and distribution lines from central power generation stations and seldom address the unique and re-gionally-specific challenges presented by many developing nations [7][8][9]. In most of sub-Saharan Africa for example, grid electricity is often unreliable, plagued with frequent blackouts, poor maintenance, and low quality of service. In these regions, expansions of the national grids often result in further strain on the systems and thus in further reduction in the quality of services provided to those already grid-connected [10]. Bhattacharyya and Timilsina point to models that can capture a developing nation’s unique context as a key input for future policy formulation, while Urban et al. point to the lack of focus to date on off-grid technologies based on locally available renewable energy resources and on the prevailing socio-economic and cultural factors [11][12].
af-DOI: 10.4236/sgre.2018.95006 78 Smart Grid and Renewable Energy
fect costs, ease of connections, and scalability.
2. Overview of PV-Based Communal Grids
A PV-based communal gridis defined as a locally confined and independently controlled electric power grid in which a distribution architecture integrates dis-tributed loads and disdis-tributed energy resources—i.e. local distributed PV systems and energy storage devices—which allows the communal grid to operate in both islanded and utility grid-connected modes.Communal grids are operated in islanded mode when they are situated far from existing utility transmission net-works, or if the owners of the grid prefer independence of their own power source. On the other hand, communal grids can be utility-grid connected to improve sys-tem economics, to improve operations, and to improve stability, while the utility grid gets to enjoy improved availability, improved stability, and reduced conductor sizes. For a successful interfacing of communal grids to utility grids, convert-ers/inverters should allow net metering (bi-directional flow of power), peak shav-ing, advanced communications and control, and fast demand response.
2.1. Control Structures
Inverters are used to interface communal grids with utility grids and can be clas-sified according to modes of operation as PQ or V-f (also known as voltage source inverter (VSIs)). A PQ inverter controls the real (P) and reactive (Q) power by adjusting the magnitude of the output real and reactive current. It therefore operates as a voltage controlled current source [13]. A voltage source inverter controls the voltage (V) and frequency (f) at the output terminal, and thus operates as a voltage source [13][14]. The mode of an inverter operation is chosen depending on a communal grid’s architecture and control strategy, and may change depending on whether the communal grid is islanded or grid-connected. Unlike synchronous generators, inverters do not have rotors and thus no natural connection between frequency and active power. To achieve stable operation with multiple distributed PV systems, the inverters are con-trolled so that they mimic the characteristics of synchronous generators with P-f and Q-V droop controls [15]. In P-f and Q-V droop controllers for a PQ in-verter, P and Q injections are changed proportionally to frequency and voltage deviations, respectively. On the other hand, P-f and Q-V droop controllers of a VSI changes the frequency and the voltage proportionally to P and Q deviations
[18]. These relationships are modelled as [13][14][15]:
( )
0(
set)
fP f
= −
P
f
−
f k
(1)( )
0(
set)
vQ V
=
Q
−
V
−
V k
(2)where P0 is the power delivered by the inverter at set point frequency fset, kf
is the gradient of the droop, which determines how much the active power P will change in response to a change in frequency f, Q0 is the reactive power
DOI: 10.4236/sgre.2018.95006 79 Smart Grid and Renewable Energy
of the droop, which determines how much the reactive power Q will change in response to a change in voltage V.
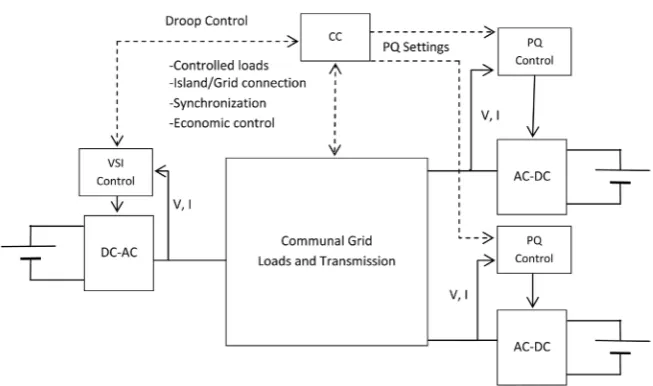
The two general control structures used in communal grids are centralised control and decentralised controls [16] [17]. In centralised control, a central controller (CC) determines the operating points of the communal grid and sends this information via communication systems to some or all the distributed PV systems and potentially to some of the loads throughout the communal grid network. In decentralised control, a virtual communication system independ-ently determines the operating points of each decentralised PV system and load within the communal grid network, effectively eliminating the need for commu-nication links and thus increasing system reliability as well as reducing cost. This enables easy and cost-effective expansion of the communal grid by enabling de-centralised PV systems and loads to have plug-and-play capabilities. The two configurations can be implemented under two main modes of operation, i.e., master slave or multi master [18].
2.1.1. Master Slave (Single Master) Operation
In master slave mode of operation, all the inverters in the network operate in PQ mode when the communal grid is connected to the utility grid, since the latter controls the voltage and frequency. In islanded mode, a single master inverter switches to voltage source (VSI) mode to provide the voltage and frequency ref-erences while the remaining distributed PV systems continue to operate in PQ mode [13]. The system can operate in either a centralised configuration or in a decentralised configuration. In centralised configuration, a single VSI acts as the voltage and frequency reference while all the other inverters operate in PQ cur-rent source mode. The load is equally shared across each inverter such that the current produced from the master is used as a reference for the PQ inverters. The operating current is communicated to them in real time. This configuration is therefore only possible with high speed communication links and is thus dif-ficult to expand [19]; it is therefore not recommended for communal grids which require modularity in design. Figure 1 shows a centrally controlled mas-ter slave operation [14][20].
DOI: 10.4236/sgre.2018.95006 80 Smart Grid and Renewable Energy
Figure 1. A Centrally controlled single master communal grid.
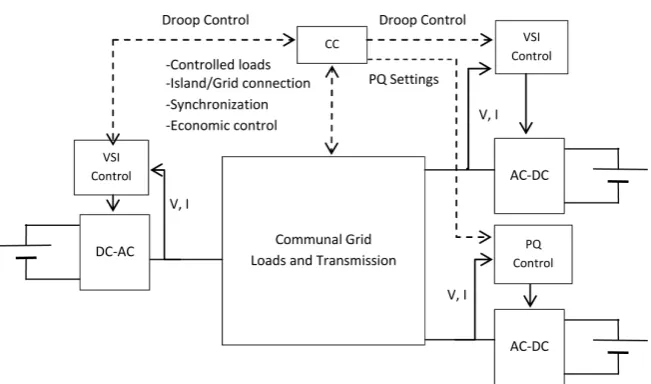
2.1.2. Multi-Master Operation
In multi-master mode of operation, all distributed PV systems within a com-munal grid can act as masters or can be operated as combinations of master generators (VSIs) and PQ inverters [13]. This mode shares many aspects with single master operation and can also be operated in centralised or decentralised configuration. The principle is almost identical to the centrally control single master system. One advantage is that battery interfaced VSIs can be distributed throughout the network [22]. Figure 2 shows a centrally controlled VSI-PQ multi master operation [20] [23]. Compared with single master, the centralised control for multi master requires a higher level of communication between mas-ter VSIs. This adds complexity, although it does have the advantage of built-in redundancy as the system will continue to operate if one of the master VSIs goes off-line [16].
Decentralised configuration for multi master is almost identical to the single master mode. All distributed PV systems can regulate their power outputs in grid-connected and islanded modes by using individual droop controls. Here also, a single pilot machine is used to set a pilot waveform. Multi master pure droop systems are well suited to systems with multiple integrated, renewable en-ergy/storage generators spread throughout a communal grid. When imple-mented in this way the load will be shared equally across all distributed PV sys-tems [23]. The dynamic response of the inverters was neglected given the limited scope of the paper; the paper focuses more on network architectures than on control [30].
3. Modelling PV-Based Communal Grids
DOI: 10.4236/sgre.2018.95006 81 Smart Grid and Renewable Energy
Figure 2. A centrally controlled combined VSI-PQ multi master communal grid.
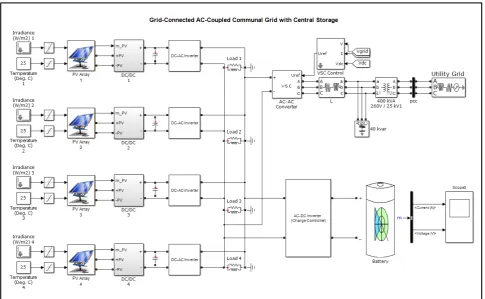
radiation and 25˚C; each array consists of 66 parallel strings, each comprising 5 PV 330 SunPower (SPR-305-WHT-D) modules connected in series (66 × 5 × 305.2 = 100.7 kW). Each array is connected to a 5 kHz boost DC-DC converter with maximum power point tracking (MPPT) and charge-controlling capabili-ties. Each converter uses the perturb-and-observe method to extract maximum voltage (273V DC) from each array and then boosts it to 500 V DC. For utility grid interfacing, a DC-AC inverter inverts the DC bus voltage to 260 V AC, while keeping a unity power factor. The inverter uses two control loops: one which regulates DC link voltage to +/−250 V and an internal control loop which regulates active and reactive current. Active current reference is the output of the DC voltage external controller while reactive current reference is set to zero to maintain unity power factor. A 40-kvar capacitor bank is used to filter har-monics produced by the inverter. The inverter is connected to the utility grid through a 400-kVA 260 V/25 kV step-up transformer.
3.1. DC-Coupled Communal Grids
Communal grids can be classified as ether DC-coupled or AC-coupled depend-ing on the common bus voltage. A grid usdepend-ing a DC bus avoids many of the power conversion steps required when using an AC bus leading to higher energy efficiency and cost-saving. Traditionally, AC enabled efficient voltage transfor-mation and high-voltage power transmission over long distances. Recently however, technology advances have led to highly efficient AC/DC and DC/DC converters, making high-voltage DC long-distance bulk power transmission more efficient [24]. Due to lower power and energy rating, stability issues are more prevalent in communal grids than in utility grids. Analyses of stability is-sues in AC-coupled communal grids follow the same concepts as with utility grids, i.e.:
• Voltage and frequency values need to both be regulated through active and
DOI: 10.4236/sgre.2018.95006 82 Smart Grid and Renewable Energy
• If a decentralised power source is a traditional synchronous generator with
an AC output, and is connected directly to the utility grid without power electronic interfaces, stability is controlled through the machine shaft’s torque and speed control.
In DC systems, there are no reactive power interactions which suggest that there are few stability issues; system control seems to be oriented towards volt-age regulation only.
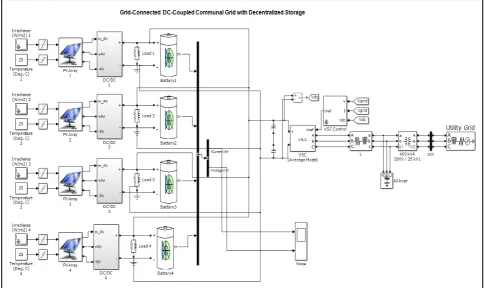
3.1.1. DC-Coupled Communal Grid with Decentralised Storage
[image:8.595.56.541.410.698.2]In these systems generated DC voltage by the PV systems is distributed throughout the communal grid in the DC form. Inverters are therefore not re-quired for common bus connections. Each DC-DC converter for each PV system is necessary for maximum power point tracking (MPPT) and for charge control-ling of the storage system. Figure 3 shows a Simulink model used to implement a DC-coupled communal grid with decentralised storage. Each Converter is connected to a decentralised lead acid battery bank rated at 1040 Ah, with a 25% depth of discharge (DOD), and 3 days of autonomy. The battery is then con-nected to a 500 V DC common bus. The load across each converter is stochasti-cally allocated between 10 kW and 25 kW, based on Kendu Bay data and poten-tial number of households served by each array [25]. If the DC bus voltage is kept stable at a certain level, future connections to the communal grid are easy as no modifications to the interfacing inverter are necessary.
DOI: 10.4236/sgre.2018.95006 83 Smart Grid and Renewable Energy
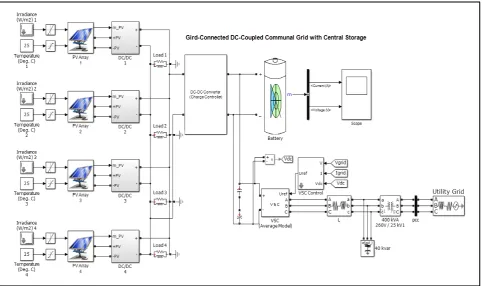
[image:9.595.59.542.420.706.2]3.1.2. DC-Coupled Communal Grid with Centralised Storage
Figure 4 shows a Simulink model used to implement a DC-coupled communal with centralised storage. These systems are like DC-coupled systems with decen-tralised storage, with the exception being that the storage system is now central-ised. Each DC-DC converter for each PV system is still necessary for maximum power point tracking, however, the task of charge controlling is now performed by an appropriately sized central converter connected to the central storage sys-tem. Future connections to the communal grid are complicated by the fact that each time the storage capacity is increased to meet the increased demand, a new appropriately sized DC-DC charge controller must be purchased for the net-work. Here, the battery bank capacity is increased to 4160 Ah while the DOD is kept at 25%. The days of autonomy is also kept at 3. A DC link capacitor is used to connect the grid interfacing VSI is connected to the central charge controller.
3.2. AC-Coupled Communal Grids
Majority of appliances require AC power to operate and AC is the main form of power transmitted and distributed around the world. It is therefore important to model AC coupled-networks, and compare them to DC-coupled networks.
3.2.1. AC-Coupled Communal Grid with Decentralised Storage
Figure 5 shows a Simulink model used to implement an AC-coupled communal grid with decentralised storage. In these systems generated DC voltage by the PV systems is first inverted into AC form before being distributed throughout the
DOI: 10.4236/sgre.2018.95006 84 Smart Grid and Renewable Energy
Figure 5. Simulink model ofan AC-coupled communal grid with decentralised storage.
network. Due to decentralised storage, each household has its own DC-AC in-verter for connection to the common AC bus. A decentralised control system is used to set the network voltage amplitude and frequency. The system works by using a virtual communication system to independently determine the operating points of each decentralised PV system and load within the communal grid net-work, effectively eliminating the need for communication links and thus in-creasing system reliability as well as reducing cost [26]. This enables easy and cost-effective expansion of the communal grid by enabling decentralised PV systems and loads to have plug-and-play capabilities. Every decentralised PV system, including the master has a built-in generation profile determined by P-f and Q-V droop curves. Each unit therefore determines its own real and reactive power, eliminating the need for communication networks in the process. The master VSI sets the voltage and frequency based on its droop and the PQ invert-ers determine the active power from the system frequency set by the master VSI and the reactive power from the local voltage measurements [21]. Even though here the common bus voltage is in AC form, it is at a different frequency and voltage amplitude from the utility grid, another AC-AC converter is therefore needed for grid interfacing. Future connections to the communal grid are easy as no modifications to the interfacing inverter are necessary.
3.2.2. AC-Coupled Communal Grid with Centralised Storage
DOI: 10.4236/sgre.2018.95006 85 Smart Grid and Renewable Energy
Figure 6. Simulink model of an AC-coupled communal grid with centralised storage.
controlling capabilities is used to connect the central energy storage system to the common AC bus. Since the central inverter is large compared to the indi-vidual array inverters, it also acts as master VSI for setting up reference line voltage amplitude and frequency while other inverters function as PQ inverters. Future connections to the communal grid are complicated by the fact that each time the storage capacity is increased to meet the increased demand, a new ap-propriately sized AC-DC inverter must be purchased for the network.
4. Agent-Based Model (ABM)
Simulated data from the Simulink models are fed into an agent based model (ABM)developed in NetLogo, to simulate effects of control architectures on temporal diffusion of PV-based communal grids in a rural developing commu-nity, with the main driving factor being the cost of setting up and connecting to a given control architecture. NetLogo is a multi-agent programmable language that was authored by Uri Wilenskey and developed at Northwestern University
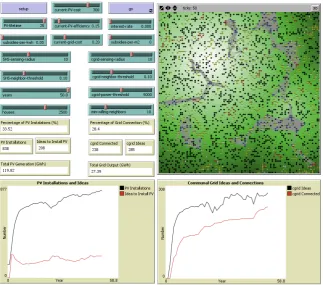
[27]. It was chosen for this work because it is widely accepted by scholars as one of the best environments for socio-economic agent-based modelling [28]. Moreover, it is free to download and use. Figure 7 shows a graphical user inter-face of the NetLogo model.
The following agents are created in the model:
DOI: 10.4236/sgre.2018.95006 86 Smart Grid and Renewable Energy
Figure 7. NetLogo graphical user interface.
2) The populations in it that require electricity,
3) PV seeds that would use the environment to produce electricity,
4) Links which are used by households with PV to connect to communal grids, and
5) A central observer or stakeholder who determines the strategies and pref-erences for PV diffusions.
Through these agents and the rules created for their interactions, the model is used to simulate the way decisions and preferences by human actors affect PV diffusion. Kendu Bay survey data are used to inform the model [25]. Table 2
shows parameters used in the model:
A household without PV would consider installing PV if
/
PV A kWh
LUCE <C (3)
where CA kWh/ is avoided cost per kWh, i.e., the prevailing national grid
electric-ity cost per kWh and equals $0.20/kWh as per current Kendu Bay rates [25], while LUCEPV is the levelised unit cost of delivered electricity and is given by
365PV PV
p
ALCC LUCE
W EHFS CUF
=
× × × (4)
where Wp is the rated peak Watt capacity of the PV module and is based on a
DOI: 10.4236/sgre.2018.95006 87 Smart Grid and Renewable Energy
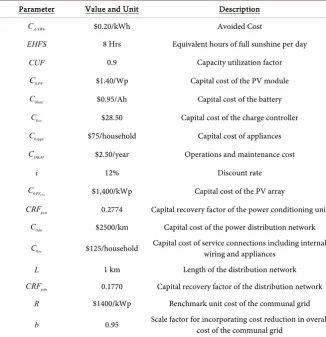
Table 2. Parameters used in the NetLogo model.
Parameter Value and Unit Description
/ A kWh
C $0.20/kWh Avoided Cost
EHFS 8 Hrs Equivalent hours of full sunshine per day CUF 0.9 Capacity utilization factor
0PV
C $1.40/Wp Capital cost of the PV module
0batt
C $0.95/Ah Capital cost of the battery
0cc
C $28.50 Capital cost of the charge controller
0appl
C $75/household Capital cost of appliances
& O M
C $2.50/year Operations and maintenance cost
i 12% Discount rate
0PVCG
C $1,400/kWp Capital cost of the PV array
pcu
CRF 0.2774 Capital recovery factor of the power conditioning unit
0dn
C $2500/km Capital cost of the power distribution network
0sc
C $125/household Capital cost of service connections including internal wiring and appliances
L 1 km Length of the distribution network
pdn
CRF 0.1770 Capital recovery factor of the distribution network R $1400/kWp Benchmark unit cost of the communal grid
b 0.95 Scale factor for incorporating cost reduction in overall cost of the communal grid
reasons and equals 0.9 based on Kendu Bay survey data [25], and ALCCPV is
the annualized life cycle cost which is calculated by summing up the cost of all of its individual components, i.e. the module, battery, charge controller, and ap-pliances multiplied by their respective capital recovery factors plus operations and maintenance costs. It is expressed as
(
) (
) (
)
(
0 0)
0 & 0PV PV PV batt batt cc cc
appl appl O M
ALCC C CRF C CRF C CRF
C CRF C
= × + × + ×
+ × + (5)
where C0PV is the capital cost of the PV module and is set at $1.40/Wp based
on Kenya’s PV costs, C0batt is the capital cost of the battery and is set at
$0.95/Ah based on the price of a typical 48V 100 Ah battery in Kenya, C0cc is
the capital cost of the charge controller and is set at $28.50 as per Kenyan rates, and C0appl is the capital cost of appliances and is averaged at $75 per household
based on typical load profiles of 95% of households with PV systems in Kendu Bay [25]. CRFPV, CRFbatt, CRFcc, and CRFappl are the capital recovery
fac-tors of the PV module, the battery, the charge controller, and appliances, respec-tively, whileCO M& is the operations and maintenance cost and is set at
$2.50/year based on Kendu Bay survey data [25].
DOI: 10.4236/sgre.2018.95006 88 Smart Grid and Renewable Energy
(
)
(
)
1 1 1 n n i i CRF i + =+ − (6)
where i is the discount rate and is set at 12% based on average Kenya’s central bank rates over the past 12 months, while n is the life of the particular compo-nent being considered, i.e. 25 years for PV modules/arrays, 5 years for batteries, 5 years for converters/inverters/charge controller, and 10 years for appliances (cumulative load). Based on these figures, CRFPV =0.1339, CRFbatt=0.2774,
0.2774
cc
CRF = , and CRFcc =0.1770.
For a communal grid consisting of N households, levelised unit cost of deliv-ered electricity (LUCECG) is given by
365 CG CG CG ALCC LUCE
PV EHFS CUF
=
× × × (7)
where PVCG is the capacity of the communal grid (PV array) in kWp and is
based on the activity profiles of all households connected to the communal grid,
EHFS is the equivalent hours of full sunshine per day and equals 8, CUF is the capacity utilization factor which incorporates non-utilization and outages of systems due to various reasons and is maintained at 0.9, and ALCCCG is the
annualized life cycle cost of the communal grid and is given by
(
) (
)
(
)
[
]
(
) (
)
0 0 0
0 0
&
CG CG
CG
CG PV PV batt batt pcu pcu
b
CG dn sc
pdn O M
ALCC C CRF C CRF C CRF
PV R C L C N
CRF C = × + × + × × × + × + × × + (8)
where
C
0PVCG is the capital cost of the PV array and associated mountingstructures and is set at $1400/kWp, C0CGrid batt_ is the capital cost of the battery
bank and associated structures and equals $0.95/Ah × N, C0pcu is the capital
cost of the power conditioning unit (power electronics) and equals $28.50 × N,
pcu
CRF is the capital recovery factor of the power conditioning unit and equals 0.2774, C0dn is the capital cost of the power distribution network per km and
equals $2500 for Kendu Bay, C0sc is the capital cost of service connections
in-cluding internal wiring and appliances per household serviced and equals $125 based on similar networks in Kenya, L is the length of the distribution network in km and is initially set at 1 km for a neighbourhood radius of 500 m, CRFpdn
is the capital recovery factor of the distribution network including the service connections and is calculated to be 0.1770,
C
O M& CG is the cost of operating andDOI: 10.4236/sgre.2018.95006 89 Smart Grid and Renewable Energy
Once cost has been determined, PV is installed by a household if
/ / 100 PV SR SR Total SR H T
H × > (9)
where HPV SR/ is the number of households with PV within a given sensing
ra-dius (SR) or neighbourhood, HTotal SR/ is the total number of households within
the same sensing radius, and TSR is the neighbourhood threshold. For Kendu
Bay, the initial sensing radius is set at 500 m based on population distribution; a sensing radius below 500 m limits impacts of neighbourhood influence on a household to one’s own clan, based on homestead and farm distributions [25]. The initial neighbourhood threshold is set at 10%; simulation results showed that values below 10% showed no impact (influence) on PV diffusion.
The size of the installed PV system by the household is given by
( )
( ) ( )
(
)
(
) (
)
p W
1 1 1
cc temp dust mismatch inv PV batt PV
PV
P h
f f f EHFS
η η η
× = × × × − × − × − × (10)
where P is the household’s power load, h is the number of hours the load is op-erated per day, ηcc is the charge controller efficiency, ftemp , fdust , and
mismatch
f are the losses in PV module due to cell temperature, dust, and mis-match amongst several cells due to shadow and other factors, and EHFS is the equivalent hours of full sunshine. P is calculated from a list of stochastically al-located appliances based on active occupancy, time of the day, and day of the week [29].
The required battery capacity for the household is given by
(
)
( ) ( )
A h
inv PV batt PV
P h Batt D V MDoD η η × ⋅ = × × × ×
(11)
where V is the operating voltage of the battery,
η
inv PV( ) is the efficiency ofin-verter, MDoD is the maximum depth of battery discharge, ηbatt PV( ) is the
charging/discharging efficiency of the battery, and D is the days of autonomy. To be allowed to join a communal grid, a household must have electricity needs beyond lighting and must demonstrate this by having installed PV of a given minimum capacity (power-threshold), which is set at 2 KWp. They must also be within a given sensing radius of other houses with PV that meet the power-threshold. A household will join a communal grid if
/ / 100 CG SR SR Total SR H T
H × > (12)
where HCG SR/ is the number of households with PV within the sensing radius
that meet the power-threshold and HTotal SR/ is the total number of households
within the same sensing radius.
DOI: 10.4236/sgre.2018.95006 90 Smart Grid and Renewable Energy
( )
( ) ( )
(
)
(
) (
)
p kW
1 1 1
CG
cc temp dust mismatch inv CG batt CG
PV
P h
f f f DF EHFS
η η η
× = × × × − × − × − × × (13)
where
η
inv CG( ) is the cumulative efficiency of inverters used in the communalgrid, ηbatt CG( ) is the cumulative charging/discharging efficiency of the batteries
used in the communal grid, and DF is the diversity factor, ratio of the sum of all individual peak loads to the maximum load of the entire communal grid.
The total battery capacity required for the communal grid is given by
(
)
( ) ( )
A h CG
inv CG batt CG
P h
Batt N D
V MDoD DF
η η
×
⋅ = × ×
× × × ×
(14)
Generally, PVCG
(
kWp)
should equal N PV×( )
Wp , whileBatt
CG(
A h
⋅
)
should equal
N Batt
×
(
A h
⋅
)
; the deficit should be evenly distributed between the households forming the communal grid. i.e., they may need to increase the sizes of their installed systems. [image:16.595.211.539.76.128.2] [image:16.595.210.538.524.704.2]5. Results and Discussion
Figure 8 shows a comparison of the irradiances hitting each of the 4 PV arrays shown in all simulations within 3 seconds (duration of simulation). Variations in irradiances have been included to account to mimic real environmental condi-tions. In PV 11,000 W/m2 radiation hits the array for 0.5 seconds before falling sharply to 50 W/m2 for 2 seconds, before rising again to 1000 W/m2 for the re-mainder of the simulation. In PV 21,000 W/m2 radiation hits the array for the first 1.5 seconds before falling to 200 W/m2 until 2.3 seconds when it rises again to 1000 W/m2. In PV 31,000 W/m2 radiation hits the array for the first 0.5 sec-onds before falling to 600 W/m2 until 1.5 seconds when it rises again to 1000 W/m2. In PV 41,000 W/m2 radiation hits the array for the first 1.0 second before falling to 350 W/m2 until 2.0 seconds when it rises again to 1000 W/m2. During
DOI: 10.4236/sgre.2018.95006 91 Smart Grid and Renewable Energy
[image:17.595.208.542.309.493.2]all simulations, the temperature is kept constant at 25˚C.
Figure 9 shows the voltages produced by each of the 4 PV arrays due to the irradiances shown above; each array is connected to a DC-DC boost converter with maximum power point tracking (MPPT) capabilities, keeping the average voltage at about 250 V for each array. The blips in the figure correspond to points of changes in irradiances. The maximum voltage produced by each array at any given time is 273 V. This is then boosted to 500 DC by the DC-DC con-verters.
Figure 10 shows the current outputs from the 4 PV arrays. Since the current generated is directly proportional to the irradiance hitting the arrays, the plots mirror those of the irradiances hitting the arrays.
[image:17.595.209.540.525.705.2]As with current outputs, power outputs from the 4 PV arrays also mirror the irradiances hitting the arrays as shown in Figure 11. The four power outputs from the PV arrays sum up to the active power injected into the control inverter as shown in Figure 12.
Figure 9. Mean voltages produced by the PV arrays.
DOI: 10.4236/sgre.2018.95006 92 Smart Grid and Renewable Energy
Figure 11. Mean power outputs from the PV arrays.
Figure 12. Active and reactive power.
[image:18.595.208.538.288.477.2]DOI: 10.4236/sgre.2018.95006 93 Smart Grid and Renewable Energy
Table 3. Comparison of additional power electronics required by networks. (GC is
Grid-Connection Cost.)
Additional Power Electronics Centralised Decentralised DC AC DC AC
VSI 1 1 1 1
Central Charge Controller 1 1 0 0 DC-AC Inverter 0 4 0 4
Transformer 1 1 1 1
Filter 1 1 1 1
Total Additional Cost ($) 250 + GC 950 + GC GC 700 + GC
Figure 13 shows the view at year after 25 years. The landscape is coloured green with the lighter areas being hill tops. Black houses are those that are un-electrified. Houses deciding on installing PV are coloured white while those that have installed PV are coloured yellow. Houses with PV that meet the communal grid-power-threshold and are deciding on joining communal grids are coloured red. Houses that have joined communal grids are coloured blue and are linked to other houses in the communal grid through grey links (grid lines), from the fig-ure, nearby communal grids join to form even larger regional grids.
5.1. DC-Coupled Communal Grids
Figure 14 shows a comparison of households connected to communal grids in centralised and decentralised storage configurations after 25 years while Figure 15 shows their corresponding percentages. After 25 years, 2103 households would have joined communal grids with decentralised storage systems, repre-senting 21.5% of all households. This is higher than the 1571 households that would have joined networks with centralised storage systems, representing 16% of all households.
5.2. AC-Coupled Communal Grids
Figure 16 shows a comparison of households connected to communal grids in centralised and decentralised storage configurations after 25 years while Figure 17 shows their corresponding percentages. After 25 years, 1887 households would have joined communal grids with decentralised storage systems, repre-senting 19.2% of all households. This is higher than the 1286 households that would have joined networks with centralised storage systems, representing 13.1% of all households.
DOI: 10.4236/sgre.2018.95006 94 Smart Grid and Renewable Energy
Figure 13. A view of the world after simulations after 25 years.
Figure 14. Houses connected to DC-coupled networks.
networks than AC-coupled networks. This is due to additional costs incurred in DC-AC inverter purchases.
6. Conclusions
[image:20.595.209.538.431.613.2]DOI: 10.4236/sgre.2018.95006 95 Smart Grid and Renewable Energy
[image:21.595.211.538.287.469.2]Figure 15. Percentage of houses connected to DC-coupled networks.
Figure 16. Houses connected to AC-coupled networks.
Table 4. Comparison of houses connected to communal grids under different control
architectures.
Time (Years)
DC-Coupled AC-Coupled Decentralised
Storage Centralised Storage Decentralised Storage Centralised Storage
0 0 0 0 0
5 414 301 383 249
10 842 609 744 493
15 1276 928 1126 748
20 1679 1249 1497 1012
25 2103 1571 1887 1286
[image:21.595.208.540.534.676.2]DOI: 10.4236/sgre.2018.95006 96 Smart Grid and Renewable Energy
Figure 17. Percentage of houses connected to AC-coupled networks.
paper is that it combines a socio-economic agent-based model with a technical model developed to simulate the most cost-effective communal grid control ar-chitecture.
Generally, DC-coupled networks seem to fair better than AC-coupled net-works in all categories. This is mainly due to cost and ease of set-up of such networks. As explained above, DC systems tend to be more modular and scal-able than AC systems because DC converters are easier to control and to parallel. This allows for more flexibility in system design and expansion, and thus more effective capital investment management. In addition, DC system components tend to be more compact than equivalent AC components because of higher ef-ficiency and by not being frequency dependent. This therefore leads to lower capital costs due to fewer electronic components being used. Moreover, most distributed energy sources and storage devices have inherently DC outputs, making DC architectures more natural options for their integrations. Due to lower power and energy rating, stability issues are more prevalent in communal grids than in utility grids. However, in DC systems where there are no reactive power interactions, there are few stability issues; system control seems to be oriented towards voltage regulation only.
Results show DC-coupled networks with decentralised storage stimulate communal grid connections by allowing easy expansions of the communal grids as each decentralised PV system within a communal grid is treated equally and determines its own real and reactive power, eliminating the need for communi-cation links. This also reduces the cost of implementing such a system; fewer connections are realized with centralised controls as such systems require high speed communication links which make them both difficult to expand and ex-pensive to implement.
DOI: 10.4236/sgre.2018.95006 97 Smart Grid and Renewable Energy
former, all distributed PV systems within a communal grid have the same rank and can act as masters or can be operated as combinations of master generators (VSIs) and PQ inverters, allowing for more design flexibility and easy connec-tions from potential customers.
In conclusion, for cost-effective communal grids, DC-coupled networks with decentralised storage systems are recommended as the most-cost effective archi-tectures for rural communal grids. Where a communal grid must be AC-coupled communal grids, systems with decentralised storage and multi-master operation modes are recommended for cost-effectiveness.
Acknowledgements
This research was funded by Leeds International Research Scholarship.
Highlights
• Decentralised control architectures lead to more connections than centralised
controlled;
• DC-coupled communal grids are more cost-effective than AC-coupled ones; • Combination of DC-coupling and decentralised storage leads to increased PV
installations;
• Multi-master operation modes lead to more connections than single-master
modes.
Conflicts of Interest
The authors declare no conflicts of interest regarding the publication of this pa-per.
References
[1] International Energy Agency (IEA) (2016) World Energy Outlook.
[2] Zerriffi, H. (2011) Distributed Rural Electrification in Brazil. In: Rural Electrifica-tion, Springer, Berlin, 59-87.
[3] Yadoo, A. and Cruickshank, H. (2010) The Value of Cooperatives in Rural Electri-fication. Energy Policy, 38, 2941-2947.
[4] Reiche, K., Covarrubia, A. and Martinot, E. (2000) Expanding Electricity Access to Remote Areas: Off-Grid Rural Electrification in Developing Countries. Fuel, 1, 1-4. [5] Short, W., Packey, D. and Holt, T. (1995) A Manual for the Economic Evaluation of
Energy Efficiency and Renewable Energy Technologies. National Renewable Energy Laboratory (NREL).
[6] National Renewable Energy Laboratory (NREL) (2012) Energy Analysis: Technol-ogy Cost and Performance.
[7] Parshall, L., Pillai, D., Mohan, S., et al. (2009) National Electricity Planning in Set-tings with Low Pre-Existing Grid Coverage: Development of a Spatial Model and Case Study of Kenya. Energy Policy, 37, 2395-2410.
https://doi.org/10.1016/j.enpol.2009.01.021
DOI: 10.4236/sgre.2018.95006 98 Smart Grid and Renewable Energy
in Senegal: Scenarios and Policies. Energy for Sustainable Development, 16, 13-25. [9] Levin, T. and Thomas, V. (2012) Least-Cost Network Evaluation of Centralized and
Decentralized Contributions to Global Electrification. Energy Policy, 41, 286-302. https://doi.org/10.1016/j.enpol.2011.10.048
[10] Foster, V. and Steinbuks, J. (2009) Paying the Price for Unreliable Power Supplies In-House Generation of Electricity by Firms in Africa.
[11] Bhattacharyya, S. and Timilsina, G. (2010) Modelling Energy Demand of Develop-ing Countries: Are the Specific Features Adequately Captured? Energy Policy, 38, 1979-1990.https://doi.org/10.1016/j.enpol.2009.11.079
[12] Urban, F., Benders, R. and Moll, H. (2007) Modelling Energy Systems for Develop-ing Countries. Energy Policy, 35, 3473-3482.
https://doi.org/10.1016/j.enpol.2006.12.025
[13] Pecas-Lopes, J., Moreira, C., Mandureira, A., et al. (2005) Control Strategies for Mi-crogrids Emergency Operation. International Conference on Future Power Systems, Amsterdam, 18 November 2005, 6.
[14] Pecas-Lopes, J., Moreira, C. and Mandureira, A. (2006) Defining Control Strategies for Microgrids Islanded Operation. IEEE Transactions on Power Systems, 21, 916-924.https://doi.org/10.1109/TPWRS.2006.873018
[15] Ashbani, S. and Abdel-Rady, M. (2013) General Interface for Power Management of Micro-Grids Using Nonlinear Cooperative Droop Control. IEEE Transactions on Power Systems, 20, 2929-2941.https://doi.org/10.1109/TPWRS.2013.2254729
[16] Bidram, A. and Davoudi, A. (2012) Hierarchical Structure of Microgrids Control System. IEEE Transactions on Smart Grid, 3, 1963-1976.
https://doi.org/10.1109/TSG.2012.2197425
[17] De Brabandere, K., Vanthournout, K., Driesen, J., et al. (2007) Control of Micro-grids. Power Engineering Society General Meeting, Tampa, 24-28 June 2007, 1-7. [18] Chowdhury, S., Chowdhury, P. and Crossley, P. (2009) Microgrids and Active
Dis-tribution Networks. The Institution of Engineering and Technology, London. [19] Hatziargyriou, N. (2014) Microgrids: Architecture and Control. John Wiley & Sons,
New York.
[20] Banerji, A., Sen, D., Paul, D., et al. (2013) Microgrid: A Review. Global Humanitar-ian Technology Conference: South Asia Satellite (GHTC-SAS), Trivandrum, 23-24 August 2013, 27-35.https://doi.org/10.1109/GHTC-SAS.2013.6629883
[21] Baert, D. and Vervaet, A. (1999) Lead-Acid Battery Model for the Derivation of Peukert’s Law. Electrochimica Acta, 44, 3491-3504.
https://doi.org/10.1016/S0013-4686(99)00117-6
[22] Huang, J., Jiang, C. and Xu, R. (2008) A Review on Distributed Energy Resources and Microgrids. Renewable and Sustainable Energy Review, 12, 2472-2483. https://doi.org/10.1016/j.rser.2007.06.004
[23] Pedrasa, M. and Spooner, T. (2006) A Survey of Techniques Used to Control Mi-crogrid Generation and Storage during Island Operation. 16th Australasian Univer-sities Power Engineering Conference, Melbourne.
[24] Vallve, X. and Serrasolses, J. (1997) Design and Operation of a 50 kWp PV Rural Electrification Project for Remote Sites in Spain. Solar Energy, 59, 111-119. https://doi.org/10.1016/S0038-092X(96)00124-7
[25] Opiyo, N. (2016) A Survey Informed PV-Based Cost-Effective Electrification Op-tions for Rural Sub-Saharan Africa. Energy Policy, 91, 1-11.
DOI: 10.4236/sgre.2018.95006 99 Smart Grid and Renewable Energy
[26] https://ccl.northwestern.edu/netlogo/
[27] Zhao, J., Mazhari, E., Celik, N. and Son, Y. (2011) Hybrid Agent-Based Simulation for Policy Evaluation of Solar Power Generation Systems. Simulation Practice and Theory, 19, 2189-2205.
[28] Opiyo, N. (2015) Modelling PV-Based Communal Grids Potential for Rural West-ern Kenya. Sustainable Energy, Grids and Networks, 4, 54-61.
[29] Chaurey, A. and Kandpal, T. (2010) A Techno-Economic Comparison of Rural Electrification Based on Solar Home Systems and PV Microgrids. Energy Policy, 38, 3118-3129.https://doi.org/10.1016/j.enpol.2010.01.052
![Table 1. Electricity access in 2016 Regional Aggregates [1].](https://thumb-us.123doks.com/thumbv2/123dok_us/9288346.424149/2.595.209.540.493.722/table-electricity-access-regional-aggregates.webp)