A COMPUTATIONAL ANALYSIS OF THE PHYLOGENETIC TREES OF SOME EUKARYOTES
1
Prof. Dr. P. K. Srimani and
1
Director, R&D Division, B.U.,
2
Dperatment of MCA (BU), DSI, Bangalore, Karnataka, India and Research Scholar, SCSVMV University,
ARTICLE INFO ABSTRACT
The recent challenges in computational biology are pertaining to Sequence Analysis and various tools related to it. Sequences are to be aligned before they are used for any other purpose like constructing the evolutionary or Phylogenetic trees.
among various biological species or other entities based upon similarities and differences in their physical and/or genetic characteristics. The aligned sequences are helpful to know the unknown families fr
giving an insight about how to use the tools related to alignment and tree construction to study the evolutionary details of DNA and Protein sequences.
INTRODUCTION
Bioinformatics is the application of information technology to the analysis, organization, management and distribution of biological data in order to answer complex biological questions. Bio computing and computational biology are synonyms and describe the use of computers and computational techniques to analyze any type of a biolo system, from individual molecules to organisms to overall ecology. Computers are used to gather, store, analyze and integrate biological and genetic information which can then be applied to gene-based drug discovery and development. In this regard, many universities, government institutions and pharmaceutical firms have formed bioinformatics groups, consisting of computational biologists and bioinformatics computer scientists. Bioinformatics is particularly important as an adjunct to genomics research, because of the large volume of complex data generated.
Bioinformatics plays a vital role in i. managing the data ii. Analysis of Sequence,
Functions. iii. Analysis of primary data such as Mass analysis, DNA micro arrays image analysis e.t.c
v. Database storage and access and vi. Interpreting results in a biological context. A tree is an undirected acyclic connected graph. The exterior nodes are called as leaves, hence a Phylogenetic tree is an unordered rooted/ Un rooted tree with weighted/un weighted edges. It is a branching diagram showing the inferred evolutionary relationship among various species. Computer tools/programs used in bioinformatics
*Corresponding author: [email protected]
ISSN: 0975-833X
Article History:
Received 20th February, 2012
Received in revised form 26th March, 2012
Accepted 19th April, 2012
Published online 30th May, 2012
Key words: Bioinformatics, Phylogenetic tree, DNA sequence Alignment, Pair-wise, N-J, and Average distance.
RESEARCH ARTICLE
A COMPUTATIONAL ANALYSIS OF THE PHYLOGENETIC TREES OF SOME EUKARYOTES
SEQUENCES
Dr. P. K. Srimani and
2Mrs. Kumudavalli M.V
Director, R&D Division, B.U., DSI, Bangalore, Karnataka, India
Dperatment of MCA (BU), DSI, Bangalore, Karnataka, India and Research Scholar, SCSVMV University,
Kanchipuram, Tamilnadu, India
ABSTRACT
The recent challenges in computational biology are pertaining to Sequence Analysis and various tools related to it. Sequences are to be aligned before they are used for any other purpose like constructing the evolutionary or Phylogenetic trees. These trees predict the evolutionary relationship among various biological species or other entities based upon similarities and differences in their physical and/or genetic characteristics. The aligned sequences are helpful to know the unknown families from a known sequence structure and also for drug analysis. The present study aims at giving an insight about how to use the tools related to alignment and tree construction to study the evolutionary details of DNA and Protein sequences.
Copy Right, IJCR, 2012, Academic Journals
Bioinformatics is the application of information technology to organization, management and distribution of biological data in order to answer complex biological questions. Bio computing and computational biology are synonyms and describe the use of computers and computational techniques to analyze any type of a biological system, from individual molecules to organisms to overall ecology. Computers are used to gather, store, analyze and integrate biological and genetic information which can then be based drug discovery and development. In this any universities, government institutions and pharmaceutical firms have formed bioinformatics groups, consisting of computational biologists and bioinformatics Bioinformatics is particularly important as , because of the large volume
i. Controlling and of Sequence, Structure and Analysis of primary data such as Mass spectra analysis e.t.c. iv. Statistics. Interpreting results in a . A tree is an undirected acyclic connected graph. The exterior nodes are called as leaves, hence a tic tree is an unordered rooted/ Un rooted tree with weighted/un weighted edges. It is a branching diagram showing the inferred evolutionary relationship among various
Computer tools/programs used in bioinformatics or
field of biology is intense. It plays a vital ro
maintaining large databases. For performing any calculations on these databases it is important to have an efficient tool/program, towards which the current day research bioinformatics is heading. There are various types of problems being catered by these existing and still under c
tools. For example: Phylogenetic construction and Pair-wise or
know the similarity and Identity between the genes or the species. Certainly there is a great need for
efficient tools for the analysis and comparison of genes, for drug analysis etc.
RLATED WORKS
A thorough survey of the literature pertaining to the subject reveals that very spare literature is available in this direction. Some recent works include ( [1], [2], [3], [4], [5]). Absolutely no work is available with regard to the present work
the present investigation is carried
NEED AND IMPORTANCE OF THE
As discussed earlier Bioinformatics has a major application in sequence alignment and analysis. Sequence analysis is the application of Information Technologies to Mol Biology. It deals with biological sequences, and processes them to extract significant information that may yield new insights and guidelines in the understanding of biological organisms. Various computer tools/programs are available which give appropriate results to the given set of input data. Usage of such tools with input data and the analysis of its
International Journal of Current Research Vol. 4, Issue, 05, pp.206-210, May,2012
INTERNATIONAL
A COMPUTATIONAL ANALYSIS OF THE PHYLOGENETIC TREES OF SOME EUKARYOTES
Mrs. Kumudavalli M.V
DSI, Bangalore, Karnataka, India
Dperatment of MCA (BU), DSI, Bangalore, Karnataka, India and Research Scholar, SCSVMV University,
The recent challenges in computational biology are pertaining to Sequence Analysis and various tools related to it. Sequences are to be aligned before they are used for any other purpose like These trees predict the evolutionary relationship among various biological species or other entities based upon similarities and differences in their physical and/or genetic characteristics. The aligned sequences are helpful to know the unknown om a known sequence structure and also for drug analysis. The present study aims at giving an insight about how to use the tools related to alignment and tree construction to study the
, Academic Journals. All rights reserved.
field of biology is intense. It plays a vital role in storing and bases. For performing any calculations on these databases it is important to have an efficient tool/program, towards which the current day research in bioinformatics is heading. There are various types of problems being catered by these existing and still under construction Phylogenetic tree or Evolutionary tree wise or multiple sequence analysis to similarity and Identity between the genes or the species. Certainly there is a great need for the development of analysis and comparison of genes, for
A thorough survey of the literature pertaining to the subject reveals that very spare literature is available in this direction. Some recent works include ( [1], [2], [3], [4], [5]). Absolutely no work is available with regard to the present work. Hence,
carried out.
NEED AND IMPORTANCE OF THE PROBLEM
various outputs are the main objectives of this research work. Since not much work in this area has been done, the present investigation is carried out to throw light on the qualitative as well as quantitative aspects of the problem.
METHODOLOGY
Sequence alignment means given any two sequences and a scoring matrix it finds the optimal pairing of letters. By aligning sequences with a known function we can get the insight about another sequence which has no known structure. Similarity obtained after alignment could be used as evidence of homology. Various methods are available for comparing sequences; most useful among them is Pair-Wise alignment. It is the basic method of comparative analysis of Proteins and Nucleic acids. Two sequences may be decided to be homologous when a high level of similarity is found in their alignment. Most of the works are based on [6] and [7]. A multiple alignment is gradually built up by aligning the closest pair of sequences first and then aligning the next closest pair of sequences or one sequence with a set of aligned sequences or two sets of aligned sequences [8]. This procedure is repeated until all given sequences are aligned together. From this the pair of sequences with minimum distance is most likely obtained from the most recent evolutionary divergence and the pair-wise alignment of these two specific sequences provide the most reliable information that can be extracted. Any two given sequence can be analyzed using various tools. If the analysis involves more than two sequences then it is called Multiple Sequence Alignment. There are many programs based on this method. Some of them construct an alignment throughout the entire length of sequence, such as MULTAL, AMULT [9a, 9b] and CLUSTALW [10]. BLAST (Basic Local Alignment Search Tool) is a heuristic method to find the highest scoring locally optimal alignments between a query sequence and a database.
Blast: which compares a nucleotide query sequence against a
nucleotide sequence database was used to get the other sequences in the table. Among all the progressive alignment methods CLUSTALW is the best known and the most popular program used widely. This method builds a tree from the pair wise alignment scores and merges subsets of sequences according to the tree. The other classes of alignment algorithms use iterative refinement strategies to improve an initial alignment. The set of 15 sequences were aligned using CLUSTALW and the alignment results were used in various tools like CLUSTALW- JalView, MATGAT, e.t.c for generating different trees, scoring matrix, identity and similarity matrix.
DESCRIPTION OFDATA SET
A set of sequences of the eukaryote kingdom is taken form NCBI nucleotide database. The sequences are aligned using ClustalW and the result is stored in a format that can be used for further study. The sequence that had the similarities of the sequence of study i.e DNA sequence of Dolichos Lab Lab was found using BLAST.
EXPERIMENTS AND RESULTS
[image:2.595.301.562.78.291.2]The experimental procedure follows the steps mentioned below:
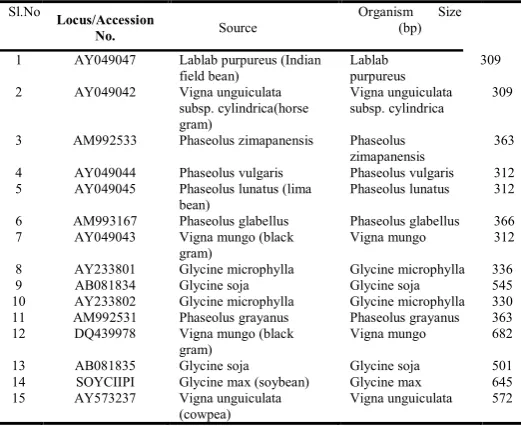
Table 1: Dataset Description of SEQUNCES
Sl.No
Locus/Accession
No. Source
Organism Size (bp)
1 AY049047 Lablab purpureus (Indian
field bean)
Lablab purpureus
309
2 AY049042 Vigna unguiculata
subsp. cylindrica(horse gram)
Vigna unguiculata subsp. cylindrica
309
3 AM992533 Phaseolus zimapanensis Phaseolus
zimapanensis
363
4 AY049044 Phaseolus vulgaris Phaseolus vulgaris 312
5 AY049045 Phaseolus lunatus (lima
bean)
Phaseolus lunatus 312
6 AM993167 Phaseolus glabellus Phaseolus glabellus 366
7 AY049043 Vigna mungo (black
gram)
Vigna mungo 312
8 AY233801 Glycine microphylla Glycine microphylla 336
9 AB081834 Glycine soja Glycine soja 545
10 AY233802 Glycine microphylla Glycine microphylla 330
11 AM992531 Phaseolus grayanus Phaseolus grayanus 363
12 DQ439978 Vigna mungo (black
gram)
Vigna mungo 682
13 AB081835 Glycine soja Glycine soja 501
14 SOYCIIPI Glycine max (soybean) Glycine max 645
15 AY573237 Vigna unguiculata
(cowpea)
Vigna unguiculata 572
Step1: The DNA sequence of Lablab purpureus was taken from Nucleotide database of NCBI.
Step 2: Remaining group of 14 DNA sequences were selected by using BLAST program as in Table 1.
Step 3: The sequence group was aligned and compared using CLUSTALW tool of NCBI.
Step 4: The alignment result was then used with JALVIEW option to get the Phylogenetic trees with different methods; like Neighbor-Joining, Unweighted Pair Group Method with Arithmetic Mean etc.
A tree is a formal structure of the representation of the process of evolution. The leaves represent the species under study; the interior nodes represent virtual ancestors, and the edges the evolutionary events [11]. In biology, this tree is called a Phylogenetic tree or an Additive tree if the edges have the valuations.
Alignment
As mentioned in step 3, the sequences are submitted to CLUSTALW tool, and then it creates an alignment file. It also calculates the Alignment Score [12], given by Alignment score - a computed score based on the number of matches, substitutions, and insertion/deletions (gaps) within the alignment. A partial view of the alignment file is as below:
>Vigna2-mungo
--- --- --- --- --- --- ---ATGGTGGTGTTAAAGGTGTGCTTGATGCTACTTTTCCTTCT---G GGAACTTGTGCTGCTAGCTTGAAGCAGTCGGAGCTAGAGCAACTCATCAA AAGTGGTCGTCATCATGAATCAACTGATGAGCCCTCTGAATCTTCAAAAC CATGCTGTGATCAATGCGCATGCACAAAATCAATACCTCCTAAATGCCGC TGTTCAGACTTAAGACTCAATTCGTGCCATTCAGCTTGCAAATCATGTGC ATGCACATATTCCATTCCTGCACAGTGTTATTGTGCAGACATAAACGACT TCTGCTACGAACCTTGCAAGTCCAGTCATGATGATGACTG-GGATAACTA ATGAGCAAGTCTT---ATGTAAGCTCTCTCTAAAATGGATGAAGCC CTTTCAGGCTTTGTTCCTTGTATAAGGAGATTAATAAAAGCTTTTTCGTG CCACAAATCTATGTCTTCTTCATTCTGATGCAAGTTTCTGAGTTTATAAG
AGGTTAACACGAAACTTAATTCAGTGAATTTCAAAAGTGTGAACTAAGTG TCAATTTACTTAATTAGTTCTTTATAAAAATAATTGATGGTTTAAATTGT ATCTGGATATTAACTAGTTTTTAATAACATAATTACAAACATTTTTTGGG ATTTTTTGGGGGGTTTTATTGAAAACGTTTTGCTTTAAAGCAAATTTG >Dolichos
--- --- ---ATGGTGGTGTTAAAGGTGTGCTTCATGCTACTTTTTCTTCT GGGACTTCTACTGCTAGCTTGAGGATGTCTGAGCTAGGCCTACGCTTCAA AAGTGGTCATCATCA---ATCAACTGATGAGCCCTCTGAGTCTTC CATGCTGTGATCACTGCGCATGCACAAAGTCGATACCTCCTCAATGCCAC TGTTCAGACCTTAGGCTGAATTCGTGCCATTCAGCTTGCAAGCCATGTCT TTGCACATTTTCGATTCCTGCACAATGTGTTTGTGCTGACACAAACGACT
[image:3.595.37.281.52.218.2]TCTGCTACGAACCTTGCAAA---During the alignment process firstly Pair-wise alignments of sequences are performed which give the pairs of sequences being aligned and the scores in an upper triangular format given in Figure1. Figure2 gives the Line graph of pair sequence alignment vs its score. Secondly the multiple alignments of the given sequences are performed which gives the output as given in Table 2.
[image:3.595.306.534.268.476.2]Figure 1. Matrix of Alignment Scores
Figure 2. Graph of DNA Sequences
As mentioned in step 3 the sequences will be aligned, and the Alignment Propertiesfor the sequences are given as:
Sequences: 15
Minimum Sequence Length: 308 Maximum Sequence Length: 681 Average Length: 416
AGGTTAACACGAAACTTAATTCAGTGAATTTCAAAAGTGTGAACTAAGTG TCAATTTACTTAATTAGTTCTTTATAAAAATAATTGATGGTTTAAATTGT ATCTGGATATTAACTAGTTTTTAATAACATAATTACAAACATTTTTTGGG ATTTTTTGGGGGGTTTTATTGAAAACGTTTTGCTTTAAAGCAAATTTG
--- --- --- --- --- --- ATGGTGGTGTTAAAGGTGTGCTTCATGCTACTTTTTCTTCT---G GGGACTTCTACTGCTAGCTTGAGGATGTCTGAGCTAGGCCTACGCTTCAA ATCAACTGATGAGCCCTCTGAGTCTTCAAAAC CATGCTGTGATCACTGCGCATGCACAAAGTCGATACCTCCTCAATGCCAC TGTTCAGACCTTAGGCTGAATTCGTGCCATTCAGCTTGCAAGCCATGTCT TTGCACATTTTCGATTCCTGCACAATGTGTTTGTGCTGACACAAACGACT
---wise alignments of the pairs of sequences upper triangular format as given in Figure1. Figure2 gives the Line graph of pair-wise . Secondly the multiple ignments of the given sequences are performed which gives
Matrix of Alignment Scores
2. Graph of DNA Sequences
As mentioned in step 3 the sequences will be aligned, and the the sequences are given as:
Table 2: Multiple Alignment Details
As mentioned in step 4 the aligned sequences are used in Jalview tool [13]; the various outputs are given below:
Figure 3. CLUSTALW
After the alignment process, the tool gives a guide tree in Newick Format
Guide Tree
(Dolichos:0.04115,(Dolichos2:0.04813,(((Phaseolus1 zimapanensis:0.01643,
(Phaseolus4-glabellus:0.03196,Phaseolus5 0.01763):0.00974):0.01100,
(Phaseolus2-vulgaris: 0.02541,Phaseolus3 0.01946):0.00278):0.01663,
((((Glycine1-microphylla: 0.00459,Glycine2 0.01624):0.01816,
Glycine3-micro:0.02597):0.05073,
(Glycine4:0.03184,Soybean:0.03802):0.15722):0.02932,Vigna 3-unguiculata: 0.27430):0.01671):0.00772):0.00365, (Vigna1 mungo:-0.01020,Vigna2-mungo: 0.01340):0.07861);
Figure4 shows a Tree which is that has additional information
are drawn proportional to some attribute
tree for the group of 15 sequences under study is as below Figure5 is another form of Evolutionary tree for the sequences under study. A cladogram is a simple tree d
relationships between terminal nodes. A cladogram can also show inferred character changes and is thus a diagram of synapomorphies.
Table 2: Multiple Alignment Details
As mentioned in step 4 the aligned sequences are used in outputs are given below:
Figure 3. CLUSTALW- Jalview
After the alignment process, the tool gives a guide tree in
(Dolichos:0.04115,(Dolichos2:0.04813,(((Phaseolus1-glabellus:0.03196,Phaseolus5-grayanus:
vulgaris: 0.02541,Phaseolus3-lunatus:
microphylla: 0.00459,Glycine2-soja:
micro:0.02597):0.05073,
Glycine4:0.03184,Soybean:0.03802):0.15722):0.02932,Vigna unguiculata: 0.27430):0.01671):0.00772):0.00365,
(Vigna1-mungo: 0.01340):0.07861);
[image:3.595.46.275.324.683.2] [image:3.595.52.277.325.510.2]
Figure 4. Phylogram
Figure 5. Cladogram
Figure 6 is a Jal Tree diagram for the guide tree obtained above in Newick format. The leaf nodes indicate the sequence names and the numerical values involved indicate the length of the branches. Figure7 depicts an evolutionary tree based on a distance method. It is a tree obtained by calculating the branch lengths between the most closely related sequence and then averaging the distance between this pair or sequence cluster and the next sequence or sequence cluster, and the process is continued until all the sequences are included in the tree [14]. In this case the percentage of identity is taken to be the branch lengths. Percentage Identity is calculated as follows:
(Percent Identity score - number of identical matches)
[image:4.595.40.284.58.344.2]/ the length of the alignment times 100. Example: (304/403) * 100 = 75.6 %
Figure 6. Jal Tree
Figure 7. Average distance using the percentage Identity
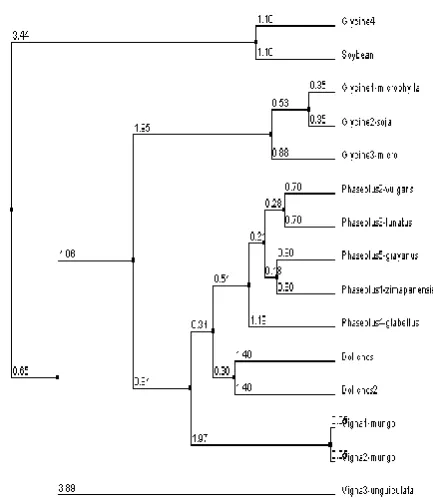
[image:4.595.311.552.425.680.2]Figure 8 is another tree obtained by Neighbor Joining method, which is also a distance, based method. This method pairs sequences based on the effect of the pairing on the sum of the branch lengths of the tree. Neighbor joining chooses the sequences that should be joined to give the best Least-Square estimates of the branch lengths that most closely reflect the actual distance between the sequences
.
Figure 8. Neighbor Joining using Percentage Identity
CONCLUSION
The present investigation of Phylogenetic trees on 15 eukaryote sequences was carried out with an objective to provide the evolutionary relationship among the sequences under study, with branch lengths. The sequences were aligned to find the percentage identity and then it was used with two
[image:4.595.58.273.548.764.2]distance based methods to construct the trees i.e, Unweighted Pair Graph method with Arithmetic Mean and Neighbor Joining. The results are found to be quite interesting and of practical importance in knowing the evolutionary distance from the root to the leaves. The N-J method using percentage identity determines vigna unguiculata (cowpea) sequence with Accession number AY573237 to be the farthest from the root with 3.58 branch length. But the Averaging method also determines vigna unguiculata (cowpea) to be the farthest with branch length-3.89. The analysis is is found to be first of its kind and has lot of scope for further research.
AKNOWLEDGEMENTS
One of the authors Mrs. Kumudavalli M.V acknowledges Dayanada Sagar Institutions, Bangalore, Karnataka and SCSVMV University, Kanchipuram, Tamilnadu, India for providing the facilities for carrying out the research work.
REFERENCES
[1] Kristian Hanekamp1,2, Uta Bohnebeck3, Bank Beszeri4 and Klaees Valentin4. “PhyloGena-a user- friendly system for automated Phylogenetic annotation of unknown sequences”. Bioinformatics, 23, 793-801, 2007.
[2] Ilan Gronau and Shlomo Moran. “Neighbor Joining Algorithms for interfering phylogenies via LCA Distances”. Journal of Computational Biology, 14, number 1, 1-15, 2007.
[3] Valery Polyanovsky, 1 Mikhail A. Roytberg,2 and Vladimir G. Tumanyan1. “Reconstruction of Genuine
Pair-Wise Sequence Alignment”. Journal of
Computational Biology, 15, Number 4, 379-391, 2008.
[4] Elodine Nedelec,1 Thomas Moncion,2,3 Elisabeth Gassiat,1 Bruno Bossard,2,4 Guillemette Duchateau-Nguyen,5 Alain Denise,2,5 and Michel Termier5. “A Pair-wise Alignment Algorithm Which Favors Clusters of Blocks”. Journal of Computational Biology, 12, Number 1, 33-47, 2005.
[5] Maria Luisa Bonet, 1 Katherine St. John, 2, 3 Ruchi Mahindru, 2, 4 and Nina Amenta5. “Approximating Sub tree Distances Between Phylogenies”. Journal of
Computational Biology, 13, Number 8, 1419-1434,
2006.
[6] S. B. Needleman and C. D. Wunsch. “A general method applicable to the search for similarities in the amino acid sequence of two proteins”. Journal of Molecular
Biology, 48:443-453, 1970.
[7] T. F. Smith and M. S. Waterman. “Identification of
common molecular subsequences”. Journal of
Molecular Biology, 147:195-197, 1981.
[8] Gotoh, O. Multiple sequence alignment:
Algorithms and applications. Adv. Biophysics. 36, 159-206, 1999.
[9] Barton G. J., and Sternberg, M.J.E. “Evolution and improvement in the automatic alignment of protein Sequences Protein Eng. 1, 89-94, 1987a. And “A strategy for the rapid multiple alignment of protein sequences: confidence levels from tertiary structure comparisons. Journal of Molecular Biology, 198,327-337, 1987b.
[10] Thompson J.D., Higgins, D.G., and Gibson, T.J. “Clustalw; improving the sensitivity of progressive multiple sequence alignment through sequence weighting, position- specific gap penalties and weight matrix choice. Nucl. Acids Res. 22, 4673- 4680, 1994.
[11] Day, W.H.E. 1985. Optimal Algorithms for Comparing Tree with labeled leaves. J. of classification. 2, 7-28.
[12] Yu Zhang1 and Michael S. Waterman2. 2003. An Eulerian path Approach to Global Multiple
Alignment for DNA Sequence. Journal of
Computational Biology, 10, 803-819.
[13] Waterhouse, A.M., Procter, J.B., Martin, D.M.A, Clamp, M. and Bartor, G.J (2009) Jalview version 2 – a multiple sequence alignment editor and analysis workbench Bioinformatics Doi:10.1093/ bioinfor matics/btp033
[14] Valdimir Makarenkov1 and Bruno Leclerc2.
Comparison of Additive Tree using Circular Orders. Journal of Computational Biology. 7, 731-744, 2005.