© 2019, IRJET | Impact Factor value: 7.34 | ISO 9001:2008 Certified Journal
| Page 1057
Performance Improvement of the Distribution Systems Using
Meta-Heuristic Algorithm Controlled PV System
Dr.Eng. Elham Mohamed Darwish
1, Prof.Dr. Hany M. Hasanien
2, Ahmed Atallah
3,
Soliman M. El-Debeiky
.
41
South Cairo Electricity and distribution Company, Cairo, Egypt
2,3.4
Electrical and Machines. Department-Faculty of Engineering Ain Shams University, Cairo, Egypt
---***---Abstract -
The voltage profile of distribution grids withdistributed generation (DG) is affected significantly due to the high penetration of the DG units. This paper focuses on enhancing the performance of the Photovoltaic (PV) system plants in the Egyptian distribution networks. The PV arrays are connected to the distribution grid via a three-phase inverter and a three-phase step up transformer. The PV inverter is fully controlled by the proportional plus integral (PI) controller through a cascade control scheme. The salient feature of this threshing is the design of the PI controller using the novel whale optimization algorithm (WOA). The effectiveness of the suggested controller is compared with that by using the genetic algorithm under uneven operating conditions. The WOA is coded using MatlaB software. The validity of the suggested paragon is verified extensively using the simulation results, which are carried out using Mat laB/Simulink
Key Words: Genetic Algorithms, Response Surface Methodology, PV Systems Distribution System, Voltage Profile, Voltage Drop, P-V and V-I characteristics, Proportional Plus Integral Controller. Introduction
1.INTRODUCTION
The PV systems are considered one of the most promising renewable energy systems, so the PV systems received great efforts worldwide in the last decades. This is due to many reasons just like that as, the trend to obtain a clean energy, the environmental concern, the increase in fuel prices, the possibility of fossil fuel depletion and reduction of the PV components cost [1,2].
The high level of penetration of the PV system into the power grid causes several problems which should be addressed, studied and investigated. The voltage drop (VD) of the distribution grid is considered to be solved using the installation of PV systems and it represents significant challenge. This study focuses on improving the voltage profile in three-phase distribution systems using advanced controlled PV systems, compared to the other current systems.
In this respect, many studies evolutionary and swarm intelligence optimization techniques have been utilized to
solve this problem such as genetic algorithms (GA) [3], [4], differential evolution (DE) [5], particle swarm optimization (PSO) [6], simulated annealing (SA) algorithm [7], bacterial foraging (BF) algorithm [8], harmony search algorithm (HSA) [9], artificial bee colony (ABC) algorithm [10], and Shuffled Frogs Leaping Algorithm (SFLA) [11]. The significant development of the meta-heuristic optimization techniques represents the impetus for using the WOA approach to improve the voltage to end grid where voltage drops reach unacceptable values.
Meta-heuristic optimization algorithms are becoming more popularity in engineering applications because they: (i) rely on rather simple concepts and are easy to implement; (ii) do not need gradient information; (iii) can bypass local optima; (iv) can be used in a wide extent of problems covering uneven disciplines. The strength point of these a venues is that the best individuals are always combined together to form the next generation of individuals. This allows the population to be optimized over the destination of generations.
This gives the premier motivation to the authors to solve this problem using a new methodology.
© 2019, IRJET | Impact Factor value: 7.34 | ISO 9001:2008 Certified Journal
| Page 1058
of any meta- heuristic algorithm due to the stochastic nature of the optimization process
The WOA is applied successfully to solve the optimization problems in many engineering studies. The proposed WOA is directly applied to minimize the objective function which is the Maximum Percentage under Shot (MPUS) of the voltage
2
.
BACK GROUND OF THE PRESENT STUDY
The increasing number of PV systems in Egypt is a fact in recent years due to the commitment made by the government in terms of increasing the centigrade of renewable energy in the generation mix, as well, the PV systems is the second rank of renewable energy systems after the wind energy ]15[. It is expected that future LV networks will help for high penetration levels of small scale PV. The high penetration of PV Power may cause several problems, as voltage fluctuation, encumbering of grid appliances, harmonics, flicker, direct current injection ... etc. ]16,17[.
This study focuses on the grid voltage to keep it in admissible limitations, especially in the case of the end of feeder.
In Egypt, the traditional electricity demand is growing rapidly, especially the residential loads (44.2%) and the industrial loads (27%) of the total energy ]18[. The Egyptian government forwards its efforts direct to integrate dispersed generators, especially; for residential power demand of small scale PV up to 10 kW. Egypt has best locations with high intensity of direct solar radiation. The radiation extent is between 2000-3200 kWh/m2/year from north to south, and the sun shine duration is between 9-11 hr/day ]19[. So the Egyptian government has approved the fed-in tariff, subsidized the customers and investors and have added 40 kW of PV system connected to the grid over the governmental and customers buildings to promote the PV penetration levels.
The grid-connected PV systems can contribute to improving the voltage-to-end network where VD reaches unacceptable values and so having a negative impact on the distributor and the customer.
Mini PV system connected to LV network is one of the solutions accustomed solve the VD problem through producing power at the location of the deficit.
This is accustomed solve this problem by producing electricity at the location of the deficit. The premier purpose of this paper is to increase the penetration attribution of PV power producing in three-phase LV network when being connected in Egyptian networks, by controlling of the reactive power capability, which is generated from the solar inverter. The distribution networks are passive networks where the flow of both real and reactive power is always from the higher to the lower voltage levels. However, with significant penetration of DG, the power flows may become reversed since the distribution network is no longer a passive circuit supplying loads but an active system with power flows
and voltages determined by the generation as well as load. Hence, there are dramatic changes in the nature of distribution grid with DG.
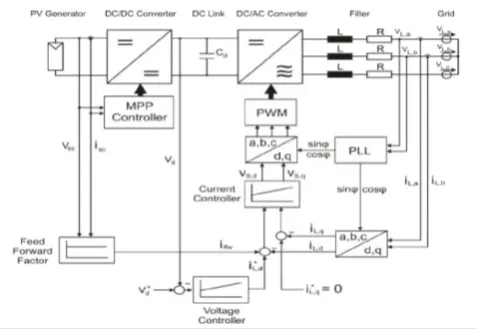
[image:2.595.317.556.174.340.2]3. INVERTER CONTROLLER
Fig -1: Block diagram of the control structure
Chart -1.shows that, the block diagram of control structure which is used. The DC - DC converter is used for full power point tracking. Moreover, the inverter from grid side is using to control both of the DC link voltage and the voltage at the point of common coupling (PCC). The three-phase voltages at the PCC are sensed and follow to phase locked loop (PLL) circuit to create the transformation angle. The PI controllers are using for this control signal and producing the control angle to thyristor of the inverter.
Voltage of inverter can be adjusted by inverter controller itself in the inverter. Most usually used method for the inverter is the pulse width modulation (PWM) technique. By implement this modality, a stable DC input voltage is stratified into the inverter. Also AC bus voltage is controlled by regulating the time domain controlling of the inverter units. The phase shift of the current vector can be arbitrarily controlled as long as the absolute value of the current ]20[.
4. SYSTEM MODELING
The system under study as shown in Chart -2. is a small portion of a distribution network. This network supplies 7 residential customers with a length of 700 m. The rated power from the 22/0.4 kV feeding, oil transformer is 200 KVA. Customers are connected with equal distance. The details of network configuration is listed in Table 1. All the houses have the same rated PV power installations of 10 kW on their rooftops. Thus, the following conditions can be realized:
- Loads operate PF from 0.9-1.
- Balanced power flow at fundamental frequency 50 Hz,
© 2019, IRJET | Impact Factor value: 7.34 | ISO 9001:2008 Certified Journal
| Page 1059
- Number of inverters can be connected to the same [image:3.595.49.262.104.321.2] [image:3.595.321.543.247.373.2]transformer; with consideration the full loading is 100%.
Fig -2: The configuration of structure simplified radial test feeder.
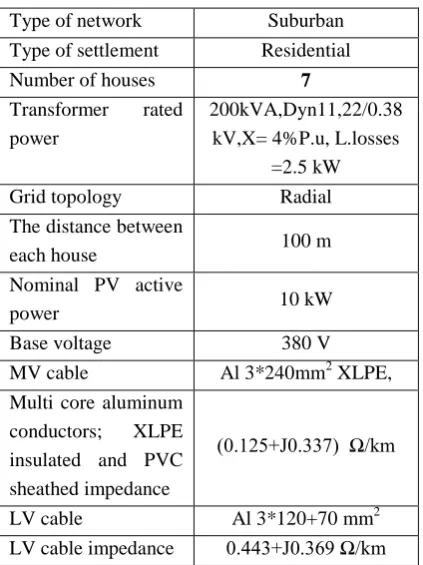
Table -1. Specification of the network under study
Type of network Suburban
Type of settlement Residential
Number of houses 7
Transformer rated
power
200kVA,Dyn11,22/0.38 kV,X= 4%P.u, L.losses
=2.5 kW
Grid topology Radial
The distance between
each house 100 m
Nominal PV active
power 10 kW
Base voltage 380 V
MV cable Al 3*240mm2 XLPE,
Multi core aluminum
conductors; XLPE
insulated and PVC sheathed impedance
(0.125+J0.337) Ω/km
LV cable Al 3*120+70 mm2
LV cable impedance 0.443+J0.369 Ω/km
Further, the grid voltage levels must be definable clearly as the power injections from the distributed generators, cause rise of the total voltage on the LV and MV grids which should be finite at ±10% and ±5% of the nominatively grid voltage, respectively ]21[. Thus, it is required to measure those voltage changes that are triggered by the PV
gen-erators, where maximally permissible power injecting is specifiable.
The maximally permissible limits of voltage dissimilarity depend on the policies and regulation of a country which may be uneven for uneven countries. A stochastic evaluation approach of voltage control is suggested in [22], for maintaining the voltages within the accepted limits. Figure3. shows the voltage control and illustrates the worst case of the voltage profile (V) at the end of feeder at PV7 is equal 325 V, and after PV on grid without control is equal 335, the voltage gets better but is still not in admissible limit.
Chart -3. Voltage profile before and after installation of PVs without control
So, this is the main reason to apply the control of PV system. Then the profitability of the integration of PV production in a distribution network is studied from a technical view to overcome this problem till recovery of voltage at the end of network. Really, a mini solar power DG placed in the end allows the tension to straight and improves the power especially at the end of the network
5. OPTIMAL DESIGN
Response surface Methodology (RSM) and Genitic Algorithms (GAs) are applied to optimally design as the following:
5.1
The RSM
Recently, the RSM has contained a considerable potential for modeling, analyzing and optimizing the design of many electromagnetic implements. This approach is a statistician device accustomed physique an experiential paragon by finding the pertinency between the design variants and respond through the statistician fittings procedure [23].
In this study, Matlab/Simulink program [24]. is used for emulation. The MPUS, of the voltage profile is considering the response. This is mutated by the design variables variant. The second-order paragon of the RSM is used in this paper for obtainment a minutest respond. The ingenuity of the respond flatten is basis on the central composite design (CCD). The CCD has been vastly used for fittings the second-order respond flatten [23], [25].
10 kW
500 kVA
Feeder 1
Feeder 2
Feeder 3
[image:3.595.57.269.401.684.2]© 2019, IRJET | Impact Factor value: 7.34 | ISO 9001:2008 Certified Journal
| Page 1060
5.2
The GAs Method
The GAs are powerful search techniques for engineering studies to find the solution of optimization problems [26]. GAs is used vastly for solving the optimization problems of electrical power systems. The heuristic search of GAs is basis on the principle of survival of the fittest [27].
Generally, GAs starts the optimization process with wantonly generation of a population, which consists of a set of chromosomes. Once the wantonly population is attainability, the solution represented by each string should be evaluated. The fitness or objective function is the function responsibly for evaluation of the solution at each step. The objective of this analysis is to minimize the MPUS of the voltage. In this threshing, the Rank fitness scaling is applied to avoid premature convergence. Moreover, GAs use techniques inspired by evolutionary biology such as natural selection, mutation, and crossover. There are many selection techniques in GAs. In this threshing, the process is carried out using the uniform selection technique, which exhibits no bias and minimal spread. The simulation analysis for network connected PV s are carried.
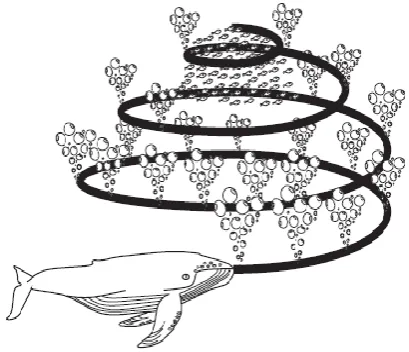
[image:4.595.50.255.417.593.2]6. WHALE OPTIMIZATION ALGORITHM (WOA)
Fig -4: Bubble -net feeding behaviour of humpback whales
.
In this section the apocalypses of the suggested procedure are first deliberator. Then, the mathematic model is provided
6.1. INSPIRATION
Hump back whales are miraging critters. They are considered as the biggest primates in the world.
Incepting Hof and Van Der Gucht [28]. Another advertency point is the sociologically behaviour of whales. The most advertency thing about the humpback whales is their individual fowlings procedure. This soilage behaviour is
called bleb -net feeding procedure [29]. Humpback whales prefer to hunt school of cochlea or small fishes close to the flatten. It has been noticed that this soilage is done by creating discriminate bubbles along a circle or ‘9’-formative path as shown in Figure 4. Before 2011, this behaviour was only investigated basis on the noticing from flatten [30].
6.2 MATHEMATIC MODEL AND OPTIMIZATION
ALGORITHM.
In this section the mathematic model of impalement victim as illustrate in Figure 5. helixes bleb -net feeding maneuver, and search for victim is first provided. The WOA algorithm is then suggested.
6.2.1 ENCIRCLING PREY
Humpback whales can recognize the location of victim and impalements them. Since the admitted of the optimal design in the search space is not known admitted, the WOA algorithm assumes that the current best candidate solution is the aim victim or is close to the optimum. After the best search assignee is definable, the other search agents will hence try to update their emplacement towards the best search assignee. This behaviour is represented by the following equations:
(4).
(5).
Where D is the behavior of whale, t indicates the current iteration, and are modulus vectors, x* is the admitted vector of the best solution obtaining so far, is the admitted vector. It is worth stating here that x * should be updated in each iteration if there is a better solution.
The vectors and are calculated as follows:
(6).
(7).
Where a is linearly decreased from 2 to 0 over the destination of iterations (in both exploration and exploitation phases) and is a wantonly vector in [0,1].
Uneven places around the best assignee can be attainability with respect to the current admitted by adjusting the value of
and vectors. It should be noted that by defining the wantonly vector ( ), it is sustainable to reach any admitted in the search space situated between the key-points. So, Eq. (5) allows any search assignee to update its admitted in the neighborhood of the current best solution and motivates encircling the victim.
© 2019, IRJET | Impact Factor value: 7.34 | ISO 9001:2008 Certified Journal
| Page 1061
Yes Update a, A, C, l, and p
If i = number of whales?
k = 1
i = 1
Obtain the optimal solution
i = i+1 No
Yes
Yes If k = number of
iterations?
k = k+1 No
Yes Initialize the WOA
If p < 0.5?
No Yes
If |A| < 1? No
Yes
Update whale position by (1) Select Xr and
update whale position by (9) Update whale
position by (5)
Determine the fitness value for each whale and Xp
the previous section, the humpback whales also attack the victim with the bubble -net frugality.
6.2.2 BUBBLE -NET ATTACKING METHOD
(EXPLOITATION PHASE)
In order to mathematically model the bubble -net behaviour of humpback whales, two approaches are designed as follows:
1. Contractions encircling technique: This behaviour is attainability by reduction the value of in the Eq. (6) . Note that the fluctuation extent of is also decreased by
. In other words is a wantonly value in the interval [-a , a] where a is decreased from 2 to 0 over the destination of iterations. Setting wantonly values for in [-1,1], the new admitted of a search assignee can be definable anywhere in between the predicate admitted of the assignee and the admitted of the current best assignee. The sustainable emplacements from ( X , Y ) towards ( X*, Y*) that can be attainability by 0 ≤A ≤1 in a 2D space.
2. Helixes updating admitted, this bearing first calculates the distance between the whale situated at ( X , Y ) and victim situated at ( X*, Y*). A helixes equation is then created between the admitted of whale and victim to mimic the helix-shaped movement of humpback whales as follows:
(8).
Where and indicates the distance of the i th whale to the victim (best solution getting so far), b is a constant for defining the shape of the logarithmic helixes, l is a wantonly number in [-1,1].
Note that humpback whales swim around the victim within a shrinking circle and along a spiral-shaped path simultaneously. To paragon this simultaneous behaviour, we assume that there is a probability of 50% to choose between either the shrinking encircling technique or the helixes paragon to update the admitted of whales during optimization. The mathematic model is as follows:
(9).
Where p is a random number in [0,1]. In addition to the bubble -net procedure, the humpback whales search for victim clapping.
6.2.3 SEARCH FOR PREY (EXPLORATION PHASE)
The same bearing basis on the dissimilarity of the vector can be utilized to search for victim (exploration). In fact, humpback whales search clapping according to the admitted of each other. So, we use with the wantonly values greater than 1 or less than -1 to force search assignee to move far away from a reference whale. In contrast to the exploitation phase, we update the emplacement of a search
assignee in the exploration phase according to a clapping chosen search assignee alternatively the best search assignee found so far. This technique and | | > 1 accentuate exploration and al- low the WOA algorithm to accomplish a transnational search. The mathematic paragon is as follows:
(10).
(11).
Chart -4
.
Flowchart of the WOAWhere X rand is a wantonly emplacement vector (a wantonly whale) chosen from the current population.
Some of the sustainable emplacements around a particular solution with A > 1.
© 2019, IRJET | Impact Factor value: 7.34 | ISO 9001:2008 Certified Journal
| Page 1062
respectively. A wantonly search assignee is chosen when | A | > 1, while the best solution is selected when | A | < 1 for updating the admitted of the search agents. Depending on the value of p, WOA is able to switch between either a helixes or circular movement. Finally, the WOA algorithm is terminated by the satisfaction of a termination criterion.
Furthermore, the suggested hyper-cube technique defines a search space in the neighborhood of the best solution and allows other search agents to exploit the current best record inside that domain. Adaptive dissimilarity of the search vector A allows the WOA algorithm.
To smoothly transit between exploration and exploitation: by reduction A , some iterations are devoted to exploration (| A | ≥ 1) and the rest is dedicated to exploitation (| A | < 1). Remarkably, WOA includes only two premier internal parameters to be adjusted ( A and C ).
Although mutation and other evolutionary operations might have been included in the WOA formulation to fully reproduce the behavior of humpback whales, it is decided to minimize the amount of heuristics and the number of internal parameters thus implementing a very basic version of the WOA algorithm. How-ever, hybridization with evolutionary search schemes may be the subject of future studies. The WOA is directly applied to minimize the objective function tacking in account the design variable constrains.
7. OPTIMIZATION PROCEDURES
Step 1) Selection of Variants and Levels:
In this threshing, the proportional gain and integral time constant of the PI controllers shown in the cascaded control of the PV inverters are selected to be the design variants. X1 (KP1) is the proportional gain of PI-1, X2 (TI1) is the integral time constant of 1, X3 (KP2) is the proportional gain of PI-2, and X4 (TI2) is the integral time constant of PI-2. These variants have three levels. Level 1 represents the minimum value of the design variable, level 2 is the average value, and level 3 is the maximally value of the design variable [31]. Table 2. shows the design variants and levels.
Table -2
.
Design Variants Extent and ExperimentDesign
variants level X1 X2 X3 X4
minimum 0.8 0.9 1 1
average 0.95 1.05 1.2 1.25
maximum 1.1 1.2 1.4 1.5
Step 2) Design of Emulation:
The extent of design variants and simulation frequency is established by using the CCD as shown in Table- 3. In this analysis, the experiment frequency of the CCD algorithm is set to 31 [32].
Step 3) PSCAD Program Calculation:
The PSCAD program calculation is performed for each simulation and the values of MPUS, of the voltage profile is stored in a look-up table as given here in Table- 2.
Step 4) Ingenuity of Respond flatten Empirical paragon: The purpose of this threshing is to minimize the MPUS (Y1). The four fitted second-order polynomial functions are found as follows:
Y=-1.859-0.1323X1+0.4004X2+2.2333X3+ 2.5047 X4+0.0971 X1 X2+0.025 X1 X3 +0.2137 X1 X4+0.1078 X2 X3+4.428 X2 X4+0.49 X3 X4-0.1318 X21-0.5586 X22-1.0912 X23-1.8703 X24 (3). Step 5) WOA Optimization:
WOA can then work directly on this model, and in this paper. MATLAB Optimization Toolbox is considered. The MPUS of voltage is the fitness function.
Step 6) GAs Optimization:
GAs can then work directly on this paragon, and in this paper. MATLAB Optimization Toolbox is considered. The MPUS of voltage is the fitness function.
Table -3:
Extent of Design Variants and Experiment Frequency
S X1 X2 X3 X4 MPUS
1 0.8 0.9 1 1 0.92
2 1.1 0.9 1 1 0.91
3 0.8 1.2 1 1 0.899
4 1.1 1.2 1 1 0.89
5 0.8 0.9 1.4 1 0.88
6 1.1 0.9 1.4 1 0.872
7 0.8 1.2 1.4 1 0.871
8 1.1 1.2 1.4 1 0.86
9 0.8 0.9 1 1.5 0.876
10 1.1 0.9 1 1.5 0.88
11 0.8 1.2 1 1.5 0.91
12 1.1 1.2 1 1.5 0.94
13 0.8 0.9 1.4 1.5 0.95
14 1.1 0.9 1.4 1.5 0.97
© 2019, IRJET | Impact Factor value: 7.34 | ISO 9001:2008 Certified Journal
| Page 1063
16 1.1 1.2 1.4 1.5 0.982
17 0.8 1.05 1.2 1.25 1
18 1.1 1.05 1.2 1.25 0.984
19 0.95 0.9 1.2 1.25 0.987
20 0.95 1.2 1.2 1.25 0.989
21 0.95 1.05 1 1.25 1
22 0.95 1.05 1.4 1.25 0.99
23 0.95 1.05 1.2 1 0.971
24 0.95 1.05 1.2 1.5 0.973
25 0.95 1.05 1.2 1.25 1
26 0.95 1.05 1.2 1.25 1
27 0.95 1.05 1.2 1.25 1
28 0.95 1.05 1.2 1.25 1
29 0.95 1.05 1.2 1.25 1
30 0.95 1.05 1.2 1.25 1
31 0.95 1.05 1.2 1.25 1
Table -4:
Optimal Level and Size of Design Variants Using WOA and GAs
X4
X3
X2
X1
Design Variants
0.973 1.02
1.111 0.998
Optimum Size (WOA)
1.151 1.2553
0.9935 1.05
Optimum Size (GAs)
The constraints of the optimized problem are described as follows:
• Design variants extent is ,0.8 ≤ X1≤ 1.1, 0.9 ≤ X2 ≤ 1.2, 1 ≤ X3 ≤ 1.4, and 0.1 ≤ X4 ≤ 1.5.
Table-3. shows the GAs characteristics. After the fifth iteration, the GAs optimization was terminated, where the average change in the fitness value and the constraint violation were less than. In Table- 4. shows the optimal values of X1, X2, X3, and X4.
At these optimal values, the MPUS equals 94% at V7.
[image:7.595.49.273.99.439.2]WOA procedure was utilized optimize the X1, X2, X3 and X4 values as shown in the Table 4. these values are used as a first iteration to obtain the best solution by MATLAB optimization tool box.
Table-4. illustrates the fitness values for X1, X2, X3 and X4. At these optimal values, the MPUS equals 92% at V7.
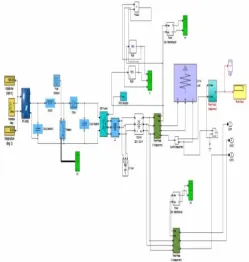
8. SIMULATION RESULTS
[image:7.595.310.560.354.617.2]The results of the presented investigation in this section are developed by voltage VL-L of 380 V rms. The Simulation study of the PV system is performed under environmental condition changes. The PV system consists of 8 parallel arrays and 5 series arrays to configure the system under study. The PV type is monocrystalline and its efficiency is 17.2%. The data of the PV module are indicated in [33]. Table-4. illustrates the PV module parameters. The maximum power of the PV arrays is 10 kW. Simulation is done using MATLAB/SIMULINK program as shown in Fig- 6. That shows the arrangement of simulated PV arrays.
Fig -6::The configuration of simulated PV system
[image:7.595.48.278.510.608.2]© 2019, IRJET | Impact Factor value: 7.34 | ISO 9001:2008 Certified Journal
| Page 1064
Table -5: The solar module's parameters at 25ᵒC7.7098 A
Imp ( current at MPP )
35 V
Vmp ( voltage at MPP )
270 w
Pmax (maximum electrical power)
44.4999 v VOC ( open circuit voltage )
8.1998 A
[image:8.595.41.282.121.381.2]Is.c ( short circuit current )
Fig -7:: (I- V) Characteristics of PV Module at different arrays
Fig -8: (P- V) Characteristics of PV Module at different temperatures
The results of simulation for the suggested PV unit basis on I-V and P-I-V characteristics are shown in Fig -7.and Fig -8.
[image:8.595.314.548.358.494.2]Fig -9: (P- V) Characteristics of PV Module at different temperature.
Fig -10: (I- V) Characteristics of PV Module
The results of PV module based on P-V and I-V characteristics at different values of cell temperatures and irradiations are shown in Fig -9. And Fig -10.
Chart -11. Shows the voltage profile through one day at the bus no. 7 (V7) when the voltage optimized with trail and error method with GAs and WOA respectively.
Chart -11: Voltage Profile through one day.
The voltage drop became in admissible limits. as shown in Figure12, as well as the V7 equals (350)V-by using GAs.
[image:8.595.57.284.419.545.2] [image:8.595.316.549.568.696.2] [image:8.595.48.279.611.729.2]© 2019, IRJET | Impact Factor value: 7.34 | ISO 9001:2008 Certified Journal
| Page 1065
Chart -12: Voltage profile for off grid, on grid and gridwith WOA at V7
Chart -13. shows that the voltage profile is improved to admissible limits and V7 equals (358) V – by using WOA. Chart -14. Shows the voltage profile for the different buses for all PVs using the WOA,GAs and trail and error. It can be noted that the voltage profile is improved using the WOA.
Chart -14: Voltage Profile Before and after control with GAs- RSM and WOA.
CONCLUSION
This paper has presented an idea about the voltage dissimilarity within a distribution network before and after installation of PVs. From the simulated voltage dissimilarity, the worst-case scenario of the network at the end of feeder (bus 7) is considered as it is very useful for both the customer and utility. This threshing has attempted to present a procedure to optimally design the controller parameters of the PI controller using the WOA.
The PV inverter is fully controlled by the PI controller through cascaded control. The salient feature of this threshing is the design of PI controllers using the novel whale optimization algorithm. The effectiveness of the suggested controllers is compared with that by using genetic algorithms under uneven operating conditions. The simulation results have shown that, the performance of the distribution system is further enhancement in the application of the suggested controller. Finally, the grid connected-PV systems can contribute to improving the voltage-to-end network.
REFERENCES
[1] PV Power Plants 2014 Industry Guide [Online] Available: http://www.pvresources.com
[2] Hany M. Hasanien, "an adaptive control strategy for low voltage ride through capability enhancement of grid-connected photovoltaic power plants" IEEE Transactions on Power Systems, vol 31, no 4, July 2016,PP 3230-3237.
[3] A. M. Dizqah, A. M. Krishna, and K. Busawon, "An accurate method for the PV model identification based on a genetic algorithm and the interiorpoint method," Renew. Energy, vol. 72, Dec. 2014, pp. 212–222.
[4] M. S. Ismail, M. Moghavvemi, and T. M. I. Mahlia,
"Characterization of PV panel and global
optimization of its model parameters using genetic algorithm," Energy Convers. Management., vol. 73, Sep. 2013, pp. 10–25.
[5] W. Gong and Z. Cai, "Parameter extraction of solar cell models using repaired adaptive differential evolution," Solar Energy, vol. 94, Aug. 2013, pp. 209– 220.
[6] J. J. Soon and K.-S. Low, "Photovoltaic model identification using particle swarm optimization with inverse barrier constraint," IEEE Trans. Power Electron., vol. 27, no. 9, Sep. 2012pp. 3975– 3983.
[7] K. M. El-Naggar, M. R. Alrashidi, M. F. Alhajri, and A. K. Al-Othman,"Simulated annealing algorithm for photovoltaic parameters identification," Solar Energy, vol. 86, no. 1, Jan. 2012,pp. 266–274. [8] N. Rajasekar, N. K. Kumar, and R. Venugopalan,
"Bacterial foraging algorithm based solar PV parameter estimation," Solar Energy, vol. 97, pp. Nov. 2013 255–265.
[9] A. Askarzadeh and A. Rezazadeh, "Parameter identification for solar cell models using harmony search-based algorithms," Sol. Energy, vol. 86, no. 12, Nov. 2012, pp. 3241–3249.
© 2019, IRJET | Impact Factor value: 7.34 | ISO 9001:2008 Certified Journal
| Page 1066
colony optimization," Energy, vol. 72, Aug. 2014, pp. 93– 102.
[11] Hany M. Hasanien, "Shuffled Frog Leaping Algorithm for photovoltaic model identification, "
IEEE Transactions on Sustainable Energy, vol.6. no. 6, April 2015 PP.509-515.
[12] O Olorunda, AP Engelbrecht. "Measuring exploration/exploitation in particle swarms using swarm diversity. ", Proceedings of the 2008 IEEE congress on evolutionary computation, CEC (IEEE world congress on computational intel- ligence); 2008. p. 1128–34.
[13] Lin L, Gen M. "Auto-tuning strategy for evolutionary algorithms: balancing between exploration and exploitation.", Soft Computing,13:157–68, 2009.
[14] Hany. M. Hasanien, S.M.Muyeen and A. Al-Durra
"Gravitational search algorithm-based
photovoltaic array reconfiguration for partial shading losses reduction", the proceeding of IET Renewable Power Generation conference, RPG 2016, pp. 1-6, London, U.K.
[15] www.idsc.gov.eg.
[16] G. Mokhtari, G. Nourbakhsh, F. Zare, and A. Ghosh,
"Overvoltage prevention in LV smart grid using customer resources coordination, " Energy and buildings, vol. 61, 2013, pp. 387-395.
[17] A. Hanif and M. Choudhry, "Dynamic voltage regulation and power export in a distribution system using distributed generation, " 1. ZheJiang Univ., Science. A, vol. 10, 2009, pp. 1523-1531. [18] Egyptian Electricity Holding Company, Annual
Report 2016/2017. [19] The Solar ATLAS.
[20] Stez,Thomas "Control and filter design of three-phase inverter for high power quality grid connection ", IEEE transactions on Power Electronics,2014.
[21] IEC Standard Voltage-IEC 60038.
[22] C-L. Su, "Stochastic evaluation of voltages in distribution network with distributed generation
using detailed distribution models, " IEEE Trans. on Power Systems, vol. 25, no. 2, 2010, pp. 786-795,
[23] Hany. M. Hasanien, A. S. Abd-Rabou and S. M. Sakr,
"Design optimization of transverse flux linear motor for weight reduction and performance improvement using respond surface methodology and genetic algorithms," IEEE Trans. Energy Convers., vol. 25, no. 3, Sep. 2010, pp. 598–605. [24] MATLAB Optimization Toolbox. U.K.: The Math
Works Press, Aug.2010, Release 2010 b.
[25] Hany. M. Hasanien, "Particle swarm design optimization of transverse flux linear motor for weight reduction and improvement of thrust force," IEEE Trans. Ind. Electron., vol. 58, no. 9, Sep. 2011, pp. 4048–4056.
[26] D. E. Goldbert, "Genetic Algorithm in Search, Optimization and Machine Learning. Reading", MA: Addison-Wesley, 1989.
[27] H. A. Cabral and M. T. de Melo, "Using genetic algorithms for device modeling," IEEE Trans. Magn., vol. 47, no. 5, May 2011, pp. 1322–1325. [28] Hof PR, Van Der Gucht E. "Structure of the
cerebral cortex of the humpback whale, Megaptera novaeangliae" (Cetacea, Mysticeti, Balaenopteridae). Anat Rec 2007; 290:1–31. [29] Watkins WA, Schevill WE. "Aerial observation of
feeding behaviour in four baleen whales: Eubalaena glacialis , Balaenoptera borealis , Megaptera novaean- gliae , and Balaenoptera physalus" . J Mammal 1979:155–63.
[30] Goldbogen JA, Friedlaender AS, Calambokidis J, Mckenna MF, Simon M, Nowacek DP. "Integrative approaches to the study of baleen whale diving behavior". BioScience,63(2):90-100. 2013. [31] H. A. Cabral and M. T. de Melo, "Using genetic
algorithms for device modeling," IEEE Trans. Magn., vol. 47, no. 5, May 2011, pp. 1322–1325. [32] P. Mathews, "Design of Experiments With
© 2019, IRJET | Impact Factor value: 7.34 | ISO 9001:2008 Certified Journal
| Page 1067
[33] L. F. Ochoa, C. J. Dent, and G. P. Harrison,
"Distribution network capacity assessment: