RESEARCH ARTICLE
ASSESSING THE PERFORMANCE OF CHECK DAMS TO CONTROL RILL-GULLY EROSION:
SMALL CATCHMENT SCALE STUDY
1,
*Pravat Kumar Shit,
2Gouri Sankar Bhunia and
1Ramkrishna Maiti
1
Department of Geography & Environment Management, Vidyasagar University, Medinipur-721102,
West Bengal, India
2
Senior Research Fellow (ICMR), Rajendra Memorial Research Institutes of Medical Sciences
(ICMR), Agamkuan, Patna-800007, Bihar, India
ARTICLE INFO ABSTRACT
Field experimental study was conducted to observe the effectiveness of check dams for reducing runoff and sediment yield in small gully catchment area. In the first phase of experiment, rill-gullies were mapped based on field survey and rill-gully development were measured; and in the second phase, check dams were constructed in particular interval along the gully to assess its effects since 2010. Check-dams in the gully basin have played a very important role in reducing sediment yield by 41.5 percent through trapping sediment and reducing erosion. Check-dams depressed the sediment yield by reducing the power of concentrated flow to remove materials through raising base level of erosion. The sediment deposited upstream of check dams shows distinct sorting. This trapped deposit facilitated the growth of vegetation which again intensifies the stability of deposit and so check dam is proved to be an efficient method of controlling rill-gully in the present study.
Copyright, IJCR, 2013, Academic Journals. All rights reserved.
INTRODUCTION
Soil erosion is a physical process with significant dissimilarity globally in its sternness and regularity (Poesen et al., 2003; Allen and Welch, 1971). It is indispensable to recognize the interface of the processes leading to the instigation and expansion of rills and gullies for the better management to control maximum utility from land and soil resource for long period (Huang, 2000; Zeng et al., 1995). Earlier workers were designed plot-scale experimental studies to understand the interrelationship between the process involving hydrological, ecological and geomorphological factors (Feng, 2000; Shit et al.,
2012a; Shit et al., 2012b; Gray and Leiser, 1982. The factors influence the rate of rill and gully erosion may be considered three headings, namely energy, resistance and protection (Morgan, 2005; Van Liew and Saxton, 1983). Such high sediment yields resulted in unsteadiness in these rill-gully channels. There are several factors that hearten the infiltration of water into the soil and thereby reduce runoff and deceases the erodibility, while any activity that pulverizes the soil, erodability is increases (Fullen and Booth, 2006; Zeng et al., 1999; Fullen and Brandsma 1995).
Lenzi (2002) demonstrated that the check dams constructed by local boulders could be used for gully erosion control and for high-gradient stream stabilization. The major function of check dams is to lessen water velocity and to catch sediments in gullies instead of supplementary soil substance being eroded away (Gray and Leiser 1982; Hui and Mingan, 2000). Although, the provision of check dams is very effective’s measure to trap eroded sediments, to stabilize stream channels, to reduce channel slope and to prevent the loss of soil from the gully channel in bad land areas (Singh et al., 2002; Yano, 1968; Zhang et al., 1988).
*Corresponding author:[email protected]
Earlier researchers also suggested that the building of check dam systems is one of the most effective measures for the conservation of soil and water in small watershed (Jiang et al., 1994; Xu and Wang, 2000; Xu. et al., 2004).
The usefulness of check dam systems for gully control aids to alleviate the streams and the adjacent land erosion (Xu et al., 2002, Lenzi and Comiti, 2003). In addition to the variations of erosion associated with the frequency and magnitude of single storms, rates of erosion often follow a seasonal pattern. This is best illustrated with reference to a rainfall regime with a wet and dry season (Figure 1). The vegetation growth follows a similar pattern, but peakserosion was observed later than the rainfall. The most vulnerable time for erosion is the early part of the wet season due to high rainfall; however vegetation has not grown sufficiently to protect the soil (Zokaib et al., 2005; Fang, 1999; Fang 1995; Meng, 1996). Thus, the erosion peak proceeds with the increase of rainfall. Therefore, it is necessary to construct the check dams for trapping sediment and to reduce runoff, and check the soil erosion (Fang et al., 1998; Gee and Bauder 1979; Goel et al., 1996).
In the present study, an experiment was conducted to investigate the effectiveness of check dams to reduce runoff and sediment yield in small gully catchment area of Paschim Medinipur district of West Bengal, India. Here we also analyzed the role of check dams in reducing rill-gully erosion rates and stabilized of gully heads.
MATERIALS AND METHODS
Study area
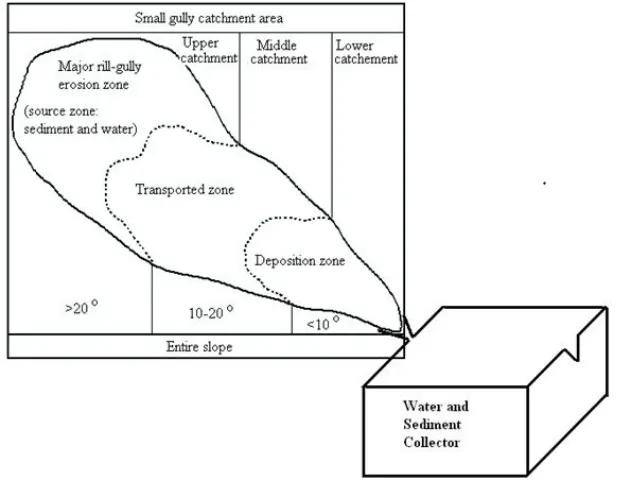
The Rangamati gully basin-II, a lateritic upland gully region, extended between 22°24.704' N to 22°24.723' N latitude and 87°17.806' E to 87°17.815' E longitude was selected as the study area (Figure 2).
ISSN: 0975-833X
International Journal of Current Research Vol. 5, Issue, 04, pp.899-906, April,2013
INTERNATIONAL JOURNAL
OF CURRENT RESEARCH
Article History: Received 29th January, 2012 Received in revised form 25th February, 2013
Accepted 19th March, 2013
Published online 13th April, 2013
Key words:
Figure 1. Seasonal cycles of rainfall, vegetation cover and erosion in sub humid monsoonal climate (Krikby, 1980).
The study area is located at the left bank of the Kossi (Kansai) river about the 1 km away from Medinipur town, and covered with an area of 254 m2. The region is characterized by tropical monsoon climate
with mean annual temperature of around 28.4° C, and the average summer (May) and winter (December) temperatures of 40.9° C and 7.5 ° C respectively. The mean annual rainfall of this region is about 1850 mm. However, the rainfall distribution is irregular, experiencing high-intensity rainstorms during June to September (i.e. > 125 mm h-1 over short periods), with high erosive potential (the rainfall erosivity factor R varies between 1200 and 1500 MJ mm ha-1 h-1 year-1). The major part of soil profiles has been truncated by hydraulic erosion and underlying horizons (Shit, et al, 2008, 2012).
There are important topographic variations within the lateritic upland rill-gully landforms. The average morphometric characteristics of gully basin such as top width, depth and length are respectively about 45 cm, 32 cm, and 6.8 m respectively. The maximum altitudinal difference from the gully top to gully bottom is 7 m. The rill-gully density is 1.72 per m2. The average slope of this area ranges between 20% and 30%. The gully basin is covered with primary and secondary succession of vegetation (Alysicarpus vaginalis; Eragrastis tenela; Evolvulus alcinoides; Evolvulus limunaris; Cynodon dactylon; Cyperus rotundus;Rosmarinus officinales; Stipa tenacissima; Hedyotis corymbosa; Lantana camara; Euphoria purpuria; Eragrostis cynosuroides; Evolvulus nummularia; Saccharum munja; Panicum maxima; Andropogon aciculate etc.) The gully basin is undulating and vulnerable to soil erosion due to heavy rainfall during monsoon and post-monsoon season.
Field topographic measurements
Monitoring of rill erosion in the selected basin was initiated in 2006. Series of check dams were constructed in 2008 (Figure 4). For the assessment of performance of check dam, entire monitoring period (2006-2011) is divided into two phases. In the first phase (Pre-construction phase, i.e. initial two years during 2006-2008), rill-gullies were mapped based on field survey and rill-gully development was monitored by erosional pins (bamboo) after rainstorms. The runoff volume, rill-gully lengthening and deepening in basin area were measured regularly.
In May, 2008 twelve porous check dams were constructed at particular interval across the gully with local boulders, pebbles etc. The check dam spacing was calculated using the following method developed by Heede and Mufich (1973). Three check dams were constructed in upper catchment, four dam at middle and five dams at lower catchment were constructed.
H
L
KSoCos
…………...1Where, L = Dam spacing along the gully (m) H= Effective dam height (m)
So= Original gully slope S= Sediment deposit slope
α = tan-1 So
K= 1 - S/So
According to Heede (1976):
tan cos
HE
Spacing
K
……….2
HE is the dam height, is the slope angle of the gully floor and K is
a constant equal to 0.3 for tan
≤0.2 and 0.5 for tan >0.2.The dam height is measured from the crest of the spillway to the gully floor. Check dams were constructed with rocks, boulder and gravels in the study area. A total of ten check dams were constructed. The length, width, height, inner slope, repose angle of all these check dams are summarized in Table 1. Furthermore, the length of the check dam is varied based on the gully size. The check dams have an effective height between 30 cm and 40 cm and extended upto 6.0 m long. The inner slope of the check dams is varied from 37 to 52 degree, while the repose angle ranged from 30 – 46 degree.
Sediment trapping and Soil properties analysis
[image:3.595.47.545.93.254.2]Sediment was collected after each rainfall through partial flume (Figure 3) and the sediment concentration behind each check dam was estimated. Sediment trapped was measured by measuring scale and multiplied by the area for estimating its volume. To study the nature of soil, parameters like soil texture, color of soil, soil consistence, erodability and soil pH, NPK, EC (Electric Conductivity), OC
Table 1. Characteristics of check dams at Rangamati Gully Basin-II
Small gully catchment
Name of the Check dams
Length (m)
Top width (cm)
Height (cm)
Inner slope (Degree)
Repose angle (Degree)
Thickness of the Sediment concentration (cm)
Volume of sediment (m3)
Sept, 2009 Oct, 2010
Sept, 2009
Oct, 2010 Lower
catchment
1 1 20 40 37 32 12 22 9.6 17.6
2 6 20 40 40 35 14 19 92.4 125.5
3 5.5 20 35 38 34 11 20 72.6 132
4 2.2 20 35 40 30 10 16 24.2 53.24
5 2.3 20 35 42 38 13 22 54.08 77.28
Middle catchment
6 2.1 20 36 45 46 14 24 49.98 85.68
7 0.9 20 34 52 40 8 13 11.52 18.72
8 1.2 20 30 50 45 7 11 11.76 18.48
9 1 20 30 48 43 8 14 8 14
Upper catchment
10 0.8 20 30 50 42 15 28 15.6 29.12
11 1 20 30 45 37 7 12 8.4 14.4
12 1.7 20 30 45 40 6 12 10.2 20.4
Check dams were constructed with rocks, boulder and gravels in the study area. A total of ten check dams were constructed. The length, width, height, inner slope, repose angle of all these check dams are summarized in Table 1. Furthermore, the length of the check dam is varied based on the gully size. The check dams have an effective height between 30 cm and 40 cm and upto 6.0 m long. The inner slope of the check dams is varied from 37 to 52 degree, while the repose angle ranged from 30 – 46 degree.
[image:3.595.143.452.293.536.2](Organic carbon) were analyzed. Topsoil was collected at 5-10 cm depth from the 3 different places of each check dam. The soil samples were dried through dry oven and from the each site 100g samples were mechanically sieved in the laboratory to sort the sediment into different size groups. The soil texture was determined by the hydrometry method (Gee and Bauder 1979) and the grain size distribution was determined by dry sieve analysis (Geo-chemical Lab, GSI, Eastern Region, Kolkata, and Panskura Agricultural Lab). The performance of the check dams and the effect of their location along the streams in retention of fine sediments were plotted in line diagram. Soil color was analyzed using Munsen color Chart and pH and EC of soil was measured using the digital pH meter and digital EC meter (shit et al., 2010). Soil fertility was also analyzed by NPK and OC using Kjeldahl distrilation for Nitrogen (N); Flame photometer for Potassium (K2O) and UV-VIS Spectrophotometer for Phosphorous
(P2O5) respectively. All soil properties were measured after and before
constructing check dams.
RESULTS AND DISCUSSION
Mechanism of check-dams in retaining sediments and decreasing erosion
At the initial stage of the check-dam, sediments are retained and runoff water is impounded within the check-dam.
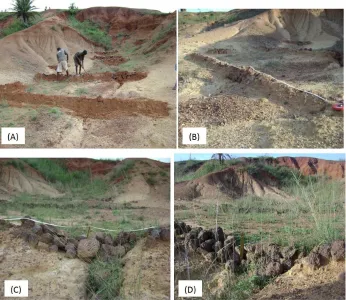
At this stage, the check-dam has the function of reducing the erosion in the lower reaches by reducing peak runoff. In the later stage, the flow velocity is reduced due to wider and gentle gradient of the newly formed terraced land. Consequently, sediment transport capacity of the stream is decreased and sediment deposition is observed along the valley of gullies (Figure 4). Meanwhile, grasses grew on the trapped sediment naturally after 18 months of constructing check dams
Table 2 showed the status of deepening, lengthening and widening of valley before and after the check dam construction. For example, during the period from June 2006 to May 2007, the average depth of the valley was 8.89 cm; while after the construction of check dam it is reduced upto 5.67cm. It is also observed that the average rate of valley lengthening was 8.44 cm before the construction of check dam, while it is reduced upto 7.22 cm after the check dam construction. The result also revealed that the average width of the valleys was 10.50cm before the check dam construction, whereas, it is decreased upto 8.00cm after the check dam construction (Table 2, Figure 4). However, the valley length, width and depth were relatively high before the construction of check dams and it is reduced after the construction of check dams due to partial filling with trapped sediment (Allen and Welch, 1971).
Figure 4. (A) Constructing check dams May, 2008(B) After 9 months constructing check dams, Aug, 2009, (C) After 18th months constructing
[image:4.595.133.479.76.376.2]check dams, June, 2010 and (D) After 21st months constructing check dams, Sept, 2010
Table 2. Erosion Measurement during monitoring periods (2006-2010)
Monitoring Periods (Before check dams) (After check dams)
June, 2006 – May, 2007 June, 2007– May, 2008 June, 2008 – May, 2009 June, 2009– May, 2010 Rills or gullies erosion VD VL VW VD VL VW VD VL VW VD VL VW
Min (cm) 4 5 6 6 7 7 3 4 6 3 4 3
Max (cm) 15 12 16 21 14 15 9 10 10 8 13 9 Mean (cm) 8.89 8.44 10.5 9.88 9.78 11.11 5.67 7.22 8 5.56 7.78 5.33
SE (cm) 1.31 0.76 1.06 1.71 0.87 1.06 0.67 0.68 0.41 0.60 0.91 0.62 SD (cm) 3.95 2.29 3.21 5.13 2.63 3.18 2.00 2.04 1.22 1.81 2.73 1.87
N 35 28 30 35 28 30 35 28 30 35 28 30
[image:4.595.50.548.685.776.2]Sediment trapping by Check dams
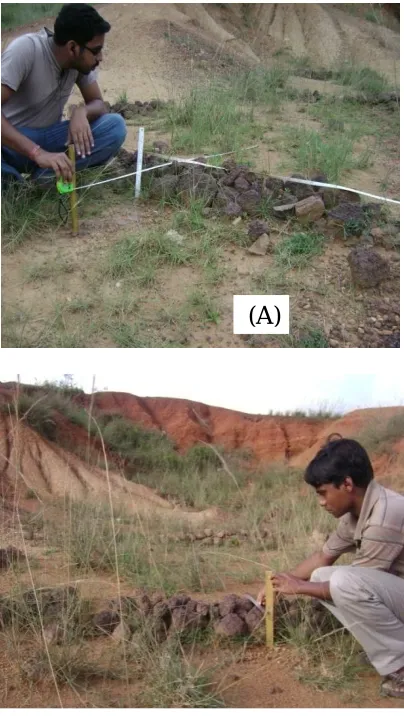
For each check dam, sediment concentrations were measured (Table 1). The thickness of sediment concentration behind each check dam varied from 11 to 28cm. Moreover, the result of the analysis showed that the length of the depositional surface behind each check dam was positively related to the height of the check dam and the gradient of the depositional surface (r = 0.4s2), but negatively related to the original channel gradient. The volume of sediment is trapped by the check dams ranges from 8.0 to 92.4 m3 (mean±standard deviation 30.70±29.16) upto September, 2009; whereas, in October, 2009 the sediment concentration in ranged from 14.0 to 132.0 m3 (mean±standard deviation 50.54±44.05) (Table 1 and Figure 5). The result of the study also showed that is strongly correlated with the length of the gully (r = 0.93; p<0.0001). Moreover, the height of the check dams were positively correlated with the sediment volume, r = 0.61 in September, 2009 and r = 0.58 in October, 2009. Negative correlation was found between inner slope angle and volume of sediment concentration in September, 2009 (r = -0.53) and in October, 2009 (r = -0.57). Additionally, repose angle also demonstrated weak negative relationship with the sediment volume in September, 2009 (r
[image:5.595.333.537.50.399.2]= -0.23) and in October, 2009 (r = -0.27).
Figure 5. Typical porous check dams constructed with local bolder for sediment trapping and reducing runoff. (A) Sept, 2009, and (B) Oct, 2010
Comparative assessment of soil loss and runoff volume
A comparative assessment is carried out to estimate the role of check dam in soil detachment and runoff volume. Runoff volume drastically reduced after the construction of check dam. The same is true for sediment discharge (Figure 6).
0
20
40
60
80
100
120
check dam without check
dam
R
uno
ff
v
ol
um
e
(
%
)
0
20
40
60
80
100
120
check dam
without
check dam
S
ed
im
en
t
de
ta
ch
m
e
nt
(k
g
m
s
-1
) (
pe
r
ce
n
ta
g
[image:5.595.64.266.297.655.2]e)
Figure 6. Effect of check dams (a) Estimation of runoff volume in relation to check dams (b) Estimation of soil loss in relation to check dams
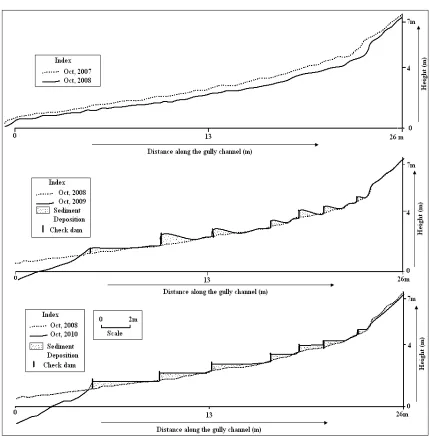
Check dams and terrace formation
In the reach upstream of each check dam, the degree of stream channel deformation was monitored by longitudinal profiles (Figure 7). The longitudinal profiles showed the deposition of sediments after the check dam that leads to develop terrace in the channel. The terrace with relative altitude up to 28 cm equivalent check dam height was formed in the gully. The detached sediment forms the upper sediment source zone start moving downstream. Being obstructed by the check dams velocity as well as carrying capacity of the runoff reduces that leads to sedimentation at upstream of each check dam. This sedimentation partially fills the channel that developed horizontal surface (terrace), where runoff loses its velocity and transport power (Figure 7). This further reduces carrying capacity and helps in further siltation. The result is also corroborated with earlier research work conducted by Van et al., (1983).
Soil particles analysis
Physical properties were also measured of the deposited material behind each check dam. The allocation of grain size of the sediments dropped behind the check dams depends on the available energy and efficiency of check dam to reduce velocity and transporting power. However, the analysis has been performed in the upper (>20 degree slope), middle (10 to 20 degree slope) and lower (<10 degree slope gradient) catchment area separately (Table 3). The result of the analysis showed that percent of sand particles were maximum in all the catchment areas in comparison to the silt and clay particles. Moreover, deposition of silt percent is more or less same in the upper and middle catchment area; while the deposition of clay percent is maximum in the lower catchment area (Figure 8). It is due to construction of check dams, water cannot pass through the dam easily,
(A)
(a)
so most sediments are trapped, and consequently, a backwater condition was developed that reduces the flow velocity. Additionally, the deposited material intimately resembled the coarse bed load existing in the unique channel and infatuated the distinctive particle size allocation.
Figure 8. Represent the sand, silt and clay percentage trapped by check dams
The depositional surfaces at the back of each check dam can be divided into different soil textures, according to the maximum diameter of the bed load particles (Figure 9). The upper part mainly consists of sandy loam, middle catchment with sandy clay loam and the lower catchment area consists of clay loam. This means that the check dam at the far downstream section performs much better in trapping fine sediments compared to the check dams located in the upper and middle sections of the streams. However, the result is also corroborated with the recent study (Hassanli et al., 2009).
[image:6.595.46.287.574.718.2]Furthermore, to appraise the effect of porous check dam position in a gully for the trapping of fine sediments, the grain size allocation of the sediments trapped by the check dams located at the far upper catchment section, at the middle section and at the far lower catchment section of each studied gully were also compared. In porous check dam, fine sediments were passed through the check dam by water flowing downstream. Figure 9 shows the particle size distribution curves corresponding to the three check dams located in Rangamati-II gully basin. The results also illustrated that the fine sediments were trapped far from the check dams in comparison to the middle and upstream sections. This significant difference could be due to the location of the check dam and the effect of intensive vegetation covers in the downstream reaches. The results of the study are also ratified with the previous study (Hassanli et al., 2009; Shafahi Bajestani 1994; Gee and Bauder, 1979).
Figure 9. Represent the particle size distribution of trapped sediment (a) Upper catchment (>20 º slope gradient), (b) Middle catchment (10 to 20 º
slope gradient), and (c) Lower catchment (<10 º slope gradient)
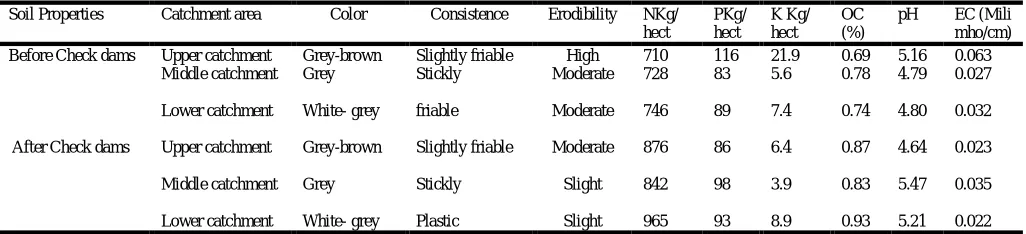
Check-dams and the soil fertility
Another important aspect of check dam construction is to increase of soil fertility in the neighbour region. To estimate the soil fertility, nitrogen (N), phosphorous (P), potassium (K), OC, soil pH, and EC were measured before and after the check dam construction. The result of the analysis showed that soil nutrients were dramatically increased after the check dam construction (Table 4). Furthermore, the results also demonstrated that the acidity of soil is reduced after the check dam construction. However, these may aid to grow the vegetation in nearby region of check dams and further reduce the soil loss.
Conclusion
Results from this study suggested that the installation of check dams produced positive effects in reinforcing upstream channel stability. In the reaches upstream of each check dam, the stream channel became wider and flatter. In addition, the depositional surface behind the check dams was relatively stable when the storage capacity was filled. Hence, the check dams mechanism can provide as efficient energy-absorbing dissipaters, then channel erosion can be abridged and it can be anticipated that the stream channel is to be steady in the long-term (Liu, 1983 Liu and Lin 1984). Check-dams in the study area have played an extremely imperative role in dropping sediment yield by trapping sediment and minimizing the frequency and intensity of soil loss. Furthermore, in case of sediment trapping, check-dams lowered the sediment yield by reducing the frequency and intensity of hyper-concentration flows and by reducing soil erosion in gullies through raising their erosion base level. To attain a high preservation of fine sediments it is suggested that porous check dams are assembled towards the lower catchment sections rather than in upper catchment sections. And, the construction of check dams in the study area may also aid to increase the soil fertility that helps to grow the vegetation in the nearby region ( Fullen and Booth, 2006). However, the present work is highly relevant in the context of degradation of land resource and to increase productivity by retaining as well as increasing quality of land. There is increasing awareness of the need to protect our natural environment in order to meet present and future requirements. In this circumstance, the intensive study on the mechanism of rill-gully erosion with spatio-temporal variation is necessary for remedial measures of rills and gullies erosion. The function of check-dams in soil conservation measures should be remunerated ample concentration in the future. It is essential to fortify construction and management of check-dams for preserving and even promoting their sediment trapping capacity and reducing the frequency of high sediment yield.
Table 3. Texture of the trapped sediments corresponding to the check dams
Location of the Check dams Number of check dams study Sand % Silt % Clay % Soil texture Upper catchment (>20 degree slope gradient) 3 72.68 16.32 11.00 Sandy loam Middle catchment (10 to 20 degree slope) 4 54.64 16.30 29.00 Sand clay loam Lower catchment (<10 degree slope) 5 36.20 31.42 32.38 Clay loam
Table 4. Soil properties of gully floor after and before constructing check dams in gully basin area
Soil Properties Catchment area Color Consistence Erodibility NKg/ hect
PKg/ hect
K Kg/ hect
OC (%)
pH EC (Mili mho/cm) Before Check dams Upper catchment Grey-brown Slightly friable High 710 116 21.9 0.69 5.16 0.063
Middle catchment Grey Stickly Moderate 728 83 5.6 0.78 4.79 0.027
Lower catchment White- grey friable Moderate 746 89 7.4 0.74 4.80 0.032
After Check dams Upper catchment Grey-brown Slightly friable Moderate 876 86 6.4 0.87 4.64 0.023
Middle catchment Grey Stickly Slight 842 98 3.9 0.83 5.47 0.035
Acknowledgement
We would like to thank The Geotechnical laboratory and Chemical Laboratory of Geological Survey of India (GSI), Eastern region, Kolkata, West Bengal, India. We also thankful to Mr. Nityananda Sar, Rabindranath Sar and Raj Kumar for their kind assistance to collect the data from the field.
REFERENCES
Allen, P. B., & Welch, N. H. 1971. Sediment yield reduction on watersheds treated with flood-retarding structures. Transaction
of ASAE, 14(5), 814–817.
Fang, R.Y. 1999. Outlook of the check-dam system agriculture in Shanxi Province. ShanXi Water Resource. 169, 4–7 (in Chinese).
Fang, X. 1995. Criterion and condition for the relative stability of check-dam system, Soil Water Conservation in China, (11): 29– 33 (in Chinese).
Fang, X., Wang, Z., Kuang, S. 1998. Mechanism and effect of check-dam to intersect sediment in the middle reach of Yellow River,
J. Hydraul. Eng. 262, 49–53 (in Chinese).
Feng, G.A. 2000. The key to bring the Yellow River under control is to speed up construction of check-dams in the Sandy and Grit Areas. Sci. Technol. Rev. 145, 53–57 (in Chinese).
Fullen, M.A., Booth, C.A. 2006. Long-term grass ley set aside on sandy soils: A case study. J. Soil and Water Cons., 61: 236-241. Fullen, M.A., Brandsma, R.T. 1995. Property changes by erosion of
loamy sand soils in east Shropshire, U.K. Soil Tech., 8: 1-15. Gee, G. W., and Bauder, J. W. 1979. Particle size analysis by
hydrometer: a simplified method for routine textural analysis and a sensitivity test of measured parameters. Soil Sci Soc Am J,
43(2), 1004–1007.
Goel, P. K., Samra, J. S., & Bansal, R. C. 1996. Sediment retention by gabion structures in Bunga Watershed. Indian Journal of Soil
Conservation, 24(2), 107–110.
Gray, D. H., and Leiser, A. T. 1982. Biotechnical slope protection and erosion control. Van Nostrand Reinhold Company, New York, U.S.A.
Hassanli AM, Esmaeli Nameghi A, Beecham S. 2009. Evaluation of the effect of porous check dam location on fine sediment retention (a case study). Environ Monit Assess, 152:319–326. Heede, B. H., and Mufich, J. G. 1973. Functional relationships and a
computer program for structural gully control. Journal of
Environmental Health, 45(1), 5–12.
Heede, B., 1976. Gully development and control: the status of our knowledge. USDA Forest Service Research Paper. RM-169, 42p. Rocky Mt. Forest and Range Experimental station, Fort Collins, Colorado.
Huang, Z. 2000. Practice and assumption for construction of the dam system eco-engineering for gullies in Loess Plateau. Soil Water
Conserv. China 22, 1–4 (in Chinese).
Hui, S., Mingan, S. 2000. Soil and water loess from the Loess Plateau in China. J. Arid Environ. 45, 9–20.
Jiang, D.S., Zhou, Q., Fan, X.K., Zhao, H.L 1994. Simulated experiment on normal intergral model of water regulating and sediment controlling for small watershed. J. Soil Water Conserv.
8, 26–30.
Kirkby, M.J. 1980. The problem. In: Soil Erosion (ed. by M.J.Kirkby & R.P.C.Morgan), 1-12. John Wiley, Chichester, UK.
Lenzi, M. A. 2002. Stream bed stabilization using boulder check dams that mimic step-pool morphology features in Northern Italy.
Geomorphology, 45, 243–260.
Lenzi, M. A., & Comiti, F. 2003. Local scouring and morphological adjustments in steep channels with check dam sequences.
Geomorphology, 55, 97–109.
Liu, C. M. & Lin, Y. L. 1984. The effectiveness of stilling ponds and concrete blocks in dissipating the overflow energy of check dams. In: Proceedings of the Symposium on Effects of Forest Land Use on Erosion and Slope Stability, 241-245. Environment and Policy Institute, East-West Center, Honolulu, Hawaii. Liu, CM. (1983) Impact of check dams on steep mountain channels in
northeastern Taiwan. In: Soil
Meng, Q. (Ed.), 1996. Soil and Water Conservation in the Loess Plateau, vol. 75, Water Resource Press of Yellow River, pp. 316–317 (in Chinese).
Morgan, R.P.C. 2005. Soil Erosion and Conservation. Blackwells. pp. 314.
Poesen, J., Nachtergaele, J., Verstraeten, G., and Valentina, C. 2003. Gully erosion and environmental change: importance and research needs. Catena. 50. 91-133.
Shafahi Bajestani, M. 1994. Hydraulic of sediment (p. 438). Ahvaz: Shahid Chamran University.
Shit, P.K., Bhunia G.S., Maiti R. 2012b. Effect of Vegetation Cover on Sediment Yield: An Empirical Study through Plots Experiment, Journal of Environment and Earth Science, Vol 2, No 5 , 32-40.
Shit, P.K., Maiti R. 2012a. Rill Hydraulics - An experimental study on gully basin in lateritic upland of Paschim Medinipur, West Bengal. Journal of Geography and Geology, Vol. 4, No. 4; 1-11,
Shit, P.K., Pati, C.K., Jana, S.K. 2010. Assessment of Plant Potential with Relation to Soil Properties in Different Forest Zones of Midnapur and Jhargram Sub-divisions, West Bengal. Indian
Journal of Geography and Environment, Vol.11, 64-71. (ISSN:
0972-7388)
Shit, PK and Maiti R. 2008. Rill Morphology in relation to Topographic Pedologic and Hydrologic attributes – a case study at Rangamati, Paschim Medinipur, and W.B., Indian Journal of
Geography and Environment, 10: 63-75
Singh S. and Dubey A. 2002. Gully erosion and management methods and applications (A Field Manual). New Academic Publishers, Delhi, 1 - 248 pp.
Van Liew, M.W., Saxton, K.E. 1983. Slope steepness and incorporated residue effects on rill erosion. Trans. ASAE 26, 1743.
Xu, M., Wang, G. 2000. To accelerate the construction of check-dams in the Loess Plateau. Yellow River 22, 26 (in Chinese).
Xu, X. Z., Zhang, H. W., & Zhang, O. 2004. Development of check dam systems in gullies on the Loess Plateau, China.
Environmental Science and Policy, 7(2), 79–86.
Xu, X., Zhang, H., et al. 2002. Check-dam system in gullies–the most effective measure to conserve soil and water in Chinese Loess Plateau, In: Proceedings of the 12th International Soil Conservation Organization Conference, vol III, Tsinghua University Press, pp. 503–509.
Yano, Y. 1968. An investigation report on the sabo works in Taiwan. Quart. J. Chinese Forestry 1(3), 140-160.
Zeng, M., Fang, X., Kang, L., Wang, E. 1995. It is doubtless for the check system in Gullies to become relatively stable. Yellow River 17, 18–21 (in Chinese).
Zeng, M., Zhu, X., Kang, L., Zuo, Z. 1999. Effect to intercept sediment and decrease erosion and development prospect of check-dams in water and soil erosion areas. Res. Soil Water
Conserv. 6, 127–132 (in Chinese).
Zhang, H. X. 1988. The use of silt trap dams in Xingzi River Basin.
Transactions of the ASAE, 31(4), 1064–1069.
Zokaib, S., Jehangir, M., Shah, H., Merz, J., and White, R. 2005. Measurement and distribution of runoff and soil losses from selected watersheds in the Hindu-Kush Himalayan region.
Aquatic Ecosystem Health & Management, 8(3): 235-241.