The crystal structure of bubbles in the wet foam limit
A. van der Net, W. Drenckhan, D. Weaire and S. Hutzler
*
Received 2nd November 2005, Accepted 19th December 2005 First published as an Advance Article on the web 6th January 2006 DOI: 10.1039/b515537a
We have observed a rich variety of three-dimensional crystal and defect structures spontaneously formed by small (diameter 200mm) bubbles in a wet foam. The observations confirm and extend those made by Bragg and Nye in 1947. However, while their experiments with two-dimensional bubble rafts have stimulated many researchers, their work onthree-dimensional wet assemblages does not appear to have been followed up. These ordered packings now pose intriguing questions for the physics of foams. The bubbles seem too large for conventional thermodynamics and kinetics to easily explain the high degree of ordering.
1. Introduction
Foams consist of gas bubbles separated by water films, where the shape of the bubbles depends on the liquid fraction. The structure of foams has generally been explored close to the dry limit, in which the liquid fraction is of the order of one percent or less,1 resulting in polyhedrally shaped bubbles. Such foams are highly disordered, even when they are monodisperse, unless they are confined within vessels or channels of small dimensions.2–4 Ordered bulk dry foam has remained an unrealisable ideal.
Nevertheless extensive orderedwet foams can be made (with values of liquid fraction larger than twenty percent, resulting in more or less spherical bubbles), and this paper presents observa-tions that demonstrate crystalline arrangements in various manifestations and with many kinds of well-defined defects.
The difference between these foams and those which have been previously studied lies in the size of the bubbles. Here they are of the order of 200mm in diameter, as compared with 1 mm or more in previous work of us. In equilibrium under gravity, such foams remains wet over a height of more than one centimetre above an underlying liquid pool (as explained in section 4), so that the bubbles are almost spherical.
The crystal structures in these wet monodisperse foams are close-packed, as one might expect in this case. However, this ready tendency to order is not easily explained. While the bubbles are small enough to create a wet foam in equilibrium, they are two orders of magnitude (in diameter) larger than analogous systems of spherical particles such as colloids, that order in slow sedimenta-tion processes. The random kinetics associated with thermal motion does not apply here, as it does on the small scale of colloids, yet the foam finds a crystalline structure, and does so rather quickly. How?
This central question looms over all the data that we present, and we can suggest only tentative lines of inquiry to find an answer. There are subsidiary questions as well.
In particular we shall ask why the fcc structure seems to be favoured over rival close-packed arrangements. Whatever the reason, it appears that substantial fcc grains are formed, in the (111) as well as the (100) surface orientation (section 5). They are joined by coherent grain boundaries of several kinds. There are also clearly visible stacking faults, partial dislocations, surface vacancies and terraces (section 6).
2. History
In reviewing relevant literature we were astonished to find that some similar observations of ordering in multiple layers in wet foams, as shown in Fig. 1 were made by Bragg and Nye in 1947,5 but apparently not followed up thereafter. The paper in question is a familiar reference, often cited for the introduction of the two-dimensional bubble raft (or 2D foam) as an analogue to metallic crystals. Two-dimensional bubble rafts have been subject of much research.6–10
In a short section at the end of that paper, ordered three-dimensional structures, very like what follows here, were shown. Nye (private communication) informed us that he even recognised partial dislocations in some of these pictures, but this finding was not published. (Such dislocations were largely unknown at the time, even by such experts as Bragg; they feature in a paper from 1948 by Heidenreich and Shockley.11)
School of Physics, Trinity College Dublin, Dublin 2, Ireland. E-mail: [email protected]; [email protected]
Fig. 1 A view of the top of a monodisperse foam (heighty1 cm, bubble diametery250mm) reveals grains with a crystalline arrangement. Note the existence of the square arrangement of bubbles in the upper right part of the photograph.
[image:1.595.324.538.524.685.2]Our own findings are highly consistent with those of Bragg and Nye (who used bubbles that were slightly larger than in our experiments), but are more detailed and wide ranging.
By use of appropriate lighting and ray tracing software, we are able to reliably infer the structure of as many as three to five layers below the top surface depending on the specific crystalline arrangement. We also view the system from the bottom, where terraces reveal ordering of up to seven layers.
Bragg’s soap raft was originally seen mainly as a charming analogue to a metal. Today it offers more direct interest, as the community of interest in foam physics has developed.
3. Experimental
Traditional methods of foam generation (beating, whipping, evolution of dissolved gas) result in polydisperse foam. To achieve monodispersity a nozzle (such as that of a syringe) may be used to issue bubbles at a time below a liquid surface.1It has often been necessary to maintain a slow rate of generation, as the process of bubble detachment can become chaotic at higher rates.12
Recently this technique has been enhanced by so-called microfluidic flow focusing,13–15 to produce a rapid stream of comparatively small bubbles. We have used this method to create samples of foams, consisting of equal sized bubbles where we varied the diameter between 100 to 500mm.
The foams are made using a foam generator consisting of a closed cell with supply of both nitrogen gas and concentrated surfactant solution (commercial detergent Fairy Liquid at a volume fraction of 3%). The cell is about half filled with solution, and the tip of a hollow needle is introduced through the bottom of the cell, slightly below the gas/liquid interface. An overpressure of the gas leads to a thin thread of gas, surrounded by liquid, streaming through the needle into an attached tube. This thread is unstable and breaks up, resulting in the formation of a very wet foam (with estimated liquid fraction 33 ¡ 2%) of equal sized bubbles. The bubbles are continuously expelled from the tube which is positioned slightly above a liquid pool consisting of the same surfactant solution.
Occasionally we have collected the bubbles between rectangular glass plates (Hele–Shaw cell) with a spacing of 3 mm, with similar results (e.g., Fig. 7 below) for their packing.
Photographs of the top layers of the foam are generally taken from the top through a microscope (low magnification 2–36) and using a diffusive light source (overhead projector) placed under-neath the foam sample.
4. The role of gravity
Once a thick layer of small bubbles has been created on top of the liquid pool, the foam does not expel liquid under gravity to the same extent as one containing larger bubbles. It remains wet (close to the wet limit, where the bubbles are spherical) up to a heighth above an underlying liquid surface given by1
h^l 2 0 d:
(1)
Herel0is the capillary length, l2
0~
c
rg, (2)
dis the bubble diameter,cis the value of surface tension,ris the density of the liquid andgis the gravitational acceleration.
The eqns (1) and (2) may be usefully rewritten as an estimate of the numberNof layers of bubbles within the wet layer of widthh
N^ l0 d 2
: (3)
Thus a substantial sample of wet foam may be created under gravity providedd%l0. For a typical surfactantl0is 1 mm or slightly more; we thus require bubbles whose diameter is a small fraction of a millimetre, such as those produced by the above method. With our range of bubble diameters we can create wet foams consisting of up to 25 layers.
5. Crystal structure
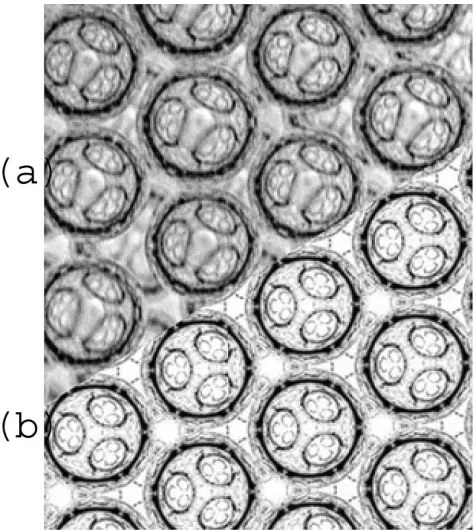
As described by Bragg and Nye two different surface pattern of the top bubble layer can be observed; these are triangular and square surface arrangements, as seen in Fig. 1. A closer examination reveals significant details (Figs. 2 and 3).
Two subtle optical phenomena deserve immediate comment. The circular black contours are not the actual boundaries of the bubbles: contrary to their appearance, bubbles touch their neighbours, indeed they should be slightly compressed against each other. The fine structure within the contours is due to refracted images of bubbles below the top layer, which are nested in each successive layer, forming a fractal-like pattern.
For comparison, ray-tracing simulations are included in Figs. 2 and 3. Full details of this method and its further implications will
[image:2.595.303.541.409.674.2]be published elsewhere.16The agreement with experiment extends right down to very fine features of the image, which is quite complex. Here we will be content with a simple visual comparison with the experimental picture, which enables us to interpret the images in terms of successive layers of bubbles.
Images of the triangular arrangements reveal up to three layers of bubbles. The vacancies described in Section 6 can enable us to look beyond three layers. The most commonly observed pattern is as in Fig. 2, being interpreted as (111) fcc, ABC... This was noted by Bragg and Nye (who were able to see two or three layers). Fig. 3 presents a second observed triangular sequence, ABA..., which we interpret as (hcp). Note that beyond three layers the continuation of the fcc or hcp structure is undetermined. There are, of course, many possibilities, including (rhcp) (random sequence of layers). However, we believe that other evidence in later sections points to substantial ordering in simple crystal structures.
From our analysis of 48 randomly picked triangular samples we find that we have a ratio of roughly 3 to 2 of ABC to ABA sequences.
The square arrangement is that of the (100) oriented fcc structure, as in Fig. 4. Note that the apparent shrinkage of each bubble, mentioned above, creates an illusion here, in that one is tempted to interpret the picture as bcc. Observing the optical patterns within the (100) fcc bubble surface, we are able to observe, depending on the bubbles size, up to five layers into the bulk structure, all consistent with this identification.
6. Imperfections
1. Surface defects
We observe simple vacancies at the surface, such as the point defect in Fig. 5, where one bubble is missing in the structure.
Divacancies,i.e., vacancies of two bubbles, often take the form shown in Fig. 6. If the surface layer is of type A and the underlying one is of type B, then the central bubble resides in a C site in this case. It is clear that the energy of this form of divacancy is lower than that of any alternatives. Since this type of divacancy seems unfamiliar, we have dubbed it the ‘‘shamrock’’ defect.
2. Stacking faults
Typically the surface is criss-crossed by grain boundaries of stacking faults. Figs. 7, 8 and 9 show that both intrinsic, e.g., …ABCA|CABC… and extrinsic,e.g., …ABCA|C|BCA… stacking faults are present. Similar patterns are seen in opal.17
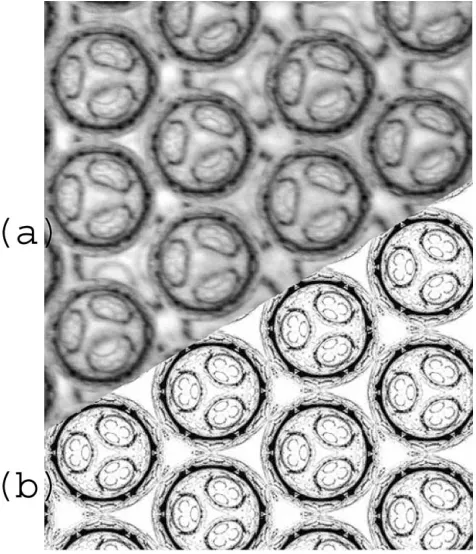
Fig. 3 (a) Photograph of bubbles consistent with hcp packing, ABA (bubble diameter = 200mm). (b) A ray tracing simulation (software: 3D Studio MAX) of a hcp packing, corresponding to the packing scheme ABA, shows detailed agreement with the experiment. Note the arrange-ment of the smallest visible bubbles, which differs from that in the case of fcc (Fig. 2).
Fig. 4 Photograph showing at least five layers of bubbles arranged in an fcc packing in the direction [100]. One might mistake this for bcc packing on account of optical effects (bubble diameter = 0.5 mm).
[image:3.595.55.293.59.336.2] [image:3.595.322.537.59.220.2] [image:3.595.322.538.284.480.2]3. Terraces
The foam/air interface in our samples is generally quite smooth and flat, apart from slight height differences between grains of different orientation. In contrast to this the foam/liquid interface at the bottom of the sample generally consists of dense arrangements of terraces, associated with close-packed planes, angled with respect to the interface. In Fig. 10 sequences of up to seven fcc planes can be identified with the terraces.
7. Conclusion
Although our optical images reveal more details than the original ones of Bragg and Nye,5 and can be accurately interpreted, it remains the case that we can directly infer crystalline order only within a few bubble diameters of the surface. Intuitively the indirect evidence for bulk order seems compelling, especially when the terraces are considered, but an observation of the expected internal order is desirable and will be pursued by us, by cryo-microscopy and other methods.
There also remains the intriguing theoretical puzzle at the outset: why is so much order in this macroscopic system not to Fig. 6 Photograph of a surface divacancy in a (111) fcc packing
(bubble diameter = 250mm). There are two missing bubbles in the A layer, which sits on top of a complete B layer. The dotted lines indicate the unoccupied sites of the top A layer. One bubble resides in the central (C) position.
Fig. 7 Intrinsic stacking fault in an fcc packing. The computer simulation (a) shows the layers ABCA|CAB, which are viewed in the [100] direction in (b). In the experimental observation (c) the foam (bubble diameter = 350mm) the foam was contained in a Hele–Shaw cell with a spacing of 3 mm.
[image:4.595.64.264.60.244.2] [image:4.595.57.535.335.482.2] [image:4.595.56.534.537.710.2]be found (at least to our knowledge18) for particles of com-parable size?
The answer may lie in the particular form of the bubble–bubble interaction and the relation of its magnitude to that of gravity in this size range.
One direction for continued investigation lies in the simulation of the crystallisation process, using some appropriate form of interaction (see,e.g., ref. 19). This will be interesting in relation to the extent of crystallisation, the selection of particular structures, such as fcc and in particular the fcc (100) surface orientation, and the various defects observed.
We also intend to make direct observations of the surface structure during the dispensing of the foam (section 3). Even in the early stages of this process, as the foam emerges from the outlet
and becomes less wet, it is evident that substantial grains are formed and further development of the structure takes place primarily at their boundaries.
Given these interesting issues, it would seem the intriguing three-dimensional close-packed structures are unlikely to be neglected for so long this time around.
Acknowledgements
We wish to thank J. F. Nye for his advice and information on his remarkable early work. Reinhard Hoehler and Sophie Cohen-Adidas are thanked for introducing us to their work on similar systems, which stimulated our interest in their structures. AvdN thanks Anthony Saugey for modelling advice, Peter Whittaker for starting up the 3D studiomax simulations, and Gary Delaney for helpful discussions. We gratefully acknowledge stimulating discussions at the EPSRC-funded FRIT workshop in Aberystwyth, June 2005. Our work was supported by the European Space Agency (MAP AO-99-108:C14914/02/NL/SH, MAP AO-99-075:C14308/00/NL/SH), Enterprise Ireland (BRG SC/2002/011) and Science Foundation Ireland (RFP 05/RFP/PHY0016). WD is an IRCSET Postdoctoral Fellow.
References
1 D. Weaire and S. Hutzler, 1999, The Physics of Foams, Oxford University Press, Oxford.
2 S. Hutzler, D. Weaire and R. Crawford, Philos. Mag. B, 1997, 75, 845–857.
3 W. Drenckhan, S. J. Cox, G. Delaney, H. Holste, D. Weaire and N. Kern,Colloids Surf., A, 2005,263, 52–64.
4 M. E. Rosa, et al.,Eur. Phys. J. E, 2002,7, 129–140.
5 L. Bragg and J. F. Nye,Proc. R. Soc. London, Ser. A, 1947,90, 1023, 474–482.
6 A. Kader and J. C. Earnshaw,Philos. Mag. A, 1997,76, 1251–1260. 7 Y. Ishida,Grain Boundary Structure and Properties, ed. G. A. Chadwick
and D. A. Smith, Academic Press, London, 1976, ch. 3.
8 E. Fukushima and A. Ookawa, J. Phys. Soc. Jpn., 1955, 10, 970–981.
9 E. Fukushima and A. Ookawa,J. Phys. Soc. Jpn., 1953,8, 129–130. 10 E. Fukushima and A. Ookawa,J. Phys. Soc. Jpn., 1953,8, 609–614. 11 R. D. Heidenreich and W. Shockley,Report of Conference of Strength of
Solids, Physical Society, London, 1948, p. 57.
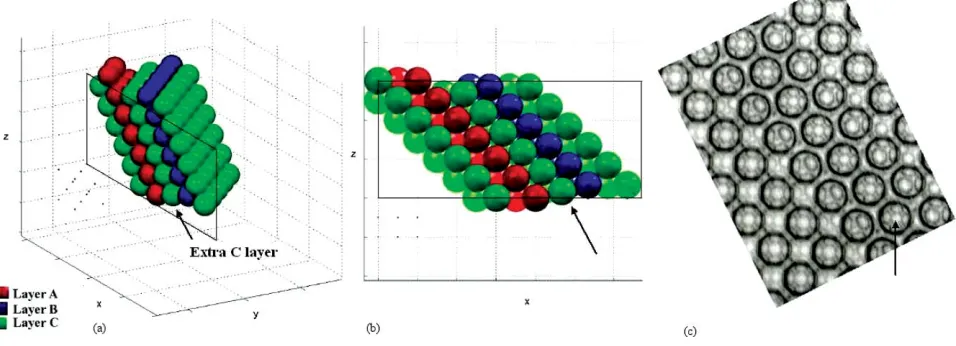
[image:5.595.65.543.60.233.2]Fig. 9 Intrinsic stacking fault in an fcc packing. The computer simulation (a) shows the layers ABCAB|ABC, which are viewed in the [1121] direction in (b). The corresponding experimental realisation is shown in (c) (bubble diameter = 350mm).
[image:5.595.57.292.282.515.2]12 D. J. Tritton and C. Egdell,Phys. Fluids A, 1993,5, 503–505. 13 J. M. Gordillo, Z. Cheng, A. M. Ganan-Calvo, M. Marquez and
D. A. Weitz,Phys. Fluids, 2004,16, 8, 2828–2834.
14 I. Cohen, H. Li, J. L. Hougland, M. Mrksich and S. R. Nagel,Science, 2001,292, 265.
15 A. S. Utada, E. Lorenceau, D. R. Link, P. D. Kaplan, H. A. Stone and D. A. Weitz,Science, 2005,308, 537.
16 W. Drenckhan, A. van der Net and L. Blondel, manuscript in preparation.
17 H. J. Scho¨pe,J. Phys.: Condens. Matter, 2003,15, L533.
18 T. Aste and D. Weaire,The Pursuit of Perfect Packing, Institute of Physics Publishing Ltd, Bristol, 2000.

![Fig. 9Intrinsic stacking fault in an fcc packing. The computer simulation (a) shows the layers ABCAB|ABC, which are viewed in the [1121] direction in(b)](https://thumb-us.123doks.com/thumbv2/123dok_us/973499.610715/5.595.57.292.282.515/intrinsic-stacking-packing-computer-simulation-layers-abcab-direction.webp)