Abstract: The dissimilar joint between aluminium alloy 6063 and aluminium has been made using the friction stir welding process. Three input parameters: tool rotational speed, feed rate and dwell time have been varied and their effect of the mechanical properties has been studied. Obtained weld joints have been characterized for tensile properties, hardness, and corrosion behavior. Effort has been made to study the in process force acting on the joint and establishing its dependence on the welding parameter. The use of full factorial design methodology brings out the contribution of input parameters and their effect on the output mechanical properties.
Keywords: aluminium alloy, dissimilar, factorial, friction stir welding.
I. INTRODUCTION
Friction Stir Welding often referred as FSW is a new and promising welding process that can produces low cost and high quality joints of heat treatable aluminium alloys because it does not need consumable filler material and can eliminate some welding defects such as crack and porosity. [1]. Friction Stir Welding was invented by The Welding Institute (TWI) in 1991 [2]. Since its invention a large number of researchers have applied the process of friction stir welding to the dissimilar metals including the 6000 Series aluminium alloys [3-7]. Solid state welding processes are ideally suited for the welding of dissimilar aluminium alloys. Because these processes do not involve melting and the issue of weld solidification cracking does not arise. Similarly solid state welding processes overcome a variety of other problems in comparison to fusion welding of Aluminium alloys such as porosity, segregation, brittle intermetallic formation and heat affected zone liquation cracking. FSW of dissimilar alloys has attracted extensive research interest due to potential engineering importance and problem associated with the conventional welding [8]. Friction Stir Welded aluminium joints have gained more
Manuscript received March 20, 2018, Date of Revised Paper submission: April 09, 2018.
Waris Nawaz Khan is with the Mechanical Engineering Department, Indian Institute of Technology Jodhpur, Rajasthan, India as PhD Research Scholar (Phone: +91-9871866984; e-mail: khan.3@iitj.ac.in).
Dr. Rahul Chhibber is with the Department of Mechanical Engineering, Indian Institute of Technology, Jodhpur, Rajasthan, India as an Assistant Professor(Phone: +91-9772523454, e-mail: rahul_chhibber@iitj.ac.in).
and more attention in the manufacture of lightweight structures for the automobile and the aircraft industry [9]. Several authors have conducted friction stir welding of wide range materials and have reported changing the tool geometry or varying the input process parameters. The effect of both of these has been studied on the mechanical properties and necessary relations have been established [8]. In this work the input parameters: tool rotational speed, feed and dwell time has been varied in two levels as per the full factorial method. The produced weld joints have been examined for various mechanical properties such as tensile strength, hardness and corrosion resistance. Also the influence of welding parameter on the force acting during the process has been investigated.
II. EXPERIMENTAL PROCEDURE
[image:1.595.349.528.557.687.2]This experiment uses AA6063 alloy and Aluminium received from manufacturer in the dimensions 100*25*6 mm. AA 6063 is an Al, Mg alloy, the composition of which is 0.7 Mn, 0.1 Cr, 7% SiC, 0.35 Fe. AA 6063 has a tensile strength of 124 MPa and an elongation of 14%. The experimental setup as shown in Fig 1 was made on a CNC machine and the joining plates were given proper backing so as to maintain equal pressure on both the sides during the course of welding can drag them to the first column. Make the graphic wider to push out any text that may try to fill in next to the graphic.
Fig 1: Experimental Set Up
Tool plays an important role in the fabrication of sound weld. The pin type tool made of EN 24 steel has been used in this work. The pin of the tool was tapered and threaded so as to have swift metal removal and to enable the quick transfer of heat from the metal. The tool was further heated
Friction Stir Welding of Dissimilar AA6063/Al
Joint
in Muffle Furnace up to a temperature of 850⁰C. The geometry of the tool is shown in Fig 2.
Fig 2: The tool geometry
[image:2.595.46.263.82.249.2]The matrix of experimentation obtained using the full factorial methods is shown in Table 1:
Table 1: Experiment Matrix
S.No Rotational Speed (RPM)
Feed (mm/min) Dwell Time (sec)
1 2500 2.5 , 5, 7.5 60
2 2500 5,10,15 60
3 3000 5,10,15 60
5 2500 5,10,15 90
6 2500 2.5 , 5, 7.5 90
7 3000 2.5 , 5, 7.5 60
8 3000 2.5 , 5, 7.5 90
The feed in each specimen was given three distinct values. This was to take care of the repulsive force offered by the displaced material while it is getting plasticized below the melting point. Hence every sample has three feed regions, namely the low feed region, medium and high feed region. The following Figure 3 represents the nomenclature and various feed regions present within a specimen.
Fig3: Specimen feed regions
III. REUSLTS AND DISCUSSION
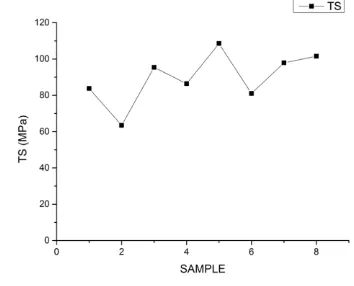
Tensile Test: The tensile strength at the center of weld is plotted for identifying the specimen with the best result. The comparative tensile strength of all specimens is plotted in Figure 4.
Fig 4: Tensile strength plot
[image:2.595.315.492.140.283.2]As evident from the above graph, Specimen 5 represents the weld center with maximum tensile strength. The associated parameters are tool rotational speed=2500 rpm, feed=5, 10, 15 mm/min A comparative graph shown in Fig 5 clearly shows that the region of weld with the low feed exhibits superior tensile strength averaging at 97.38 MPa than the region of medium feed with value 86.23 MPa, while the high feed is associated with the minimum tensile strength that comes out to be 73.41 MPa.
[image:2.595.53.284.645.736.2]Fig 6: Hardness Plot
[image:3.595.46.252.50.205.2]Observing the above graph it is clearly evident that the hardness is maximum in Specimen 3 with associated parameters : Tool rotational speed=300 rpm, feed=5,10,15 mm/min and a dwell time of 60 sec. Establishing the relation between the feed rate and the hardness obtained, a plot is made to depict their relation. The following graph (Fig 7) clearly shows that the region of medium feed is associated with the best hardness 138.98 BHN in the weld sample followed by medium feed region with hardness 138.06 BHN and the lowest feed comes out as the region of minimum hardness with 137.0375 BHN. Since the hardness of the feed regions is almost comparable thus it could be said that the feed variation does not has much impact on the hardness of the sample.
Fig 7: Comparison of Hardness with feed variation Corrosion Behavior: The produced welds are subjected to potentiostatic corrosion test to estimate their corrosion rate. Tafle plot (Fig 8) obtained at a scan rate of 1mV/s helps us to estimate the factors which decide the response of our specimen to the corrosive environment. The test is carried out in an electrolytic solution of 3.5% NaCl.
Potential
L
o
g
(C
u
rr
e
n
t
/A
)
Corrosion rate analysis
-1.0 -0.8 -0.6 -0.4 -0.2 V -5.8
[image:3.595.308.528.51.193.2]-5.6 -5.4 A
Fig 8: Tafel Plot
Mathematically the Tafel equation is given as:
V = A *
ln (I/ I
0) (1)
Where V is over potential, A is the tafel slope, I is the current density and Io is the exchange current density. Exchange current density is the current density in the absence of net electrolysis and zero over potential. The corrosion rate depends on kinetics of both anodic and cathodic reactions. According to Faraday’s Law there is a direct relationship between the corrosion rate (Rm) and the corrosion current (Icorr). Mathematically it is represented as:
(2)
Where; M is the atomic weight of the metal, P is the density, N is the charge number and F is the faraday constant (96.485 cal/mol)
The Tafel plot gave us data as shown in Table 2 which was further used to calculate the corrosion rate.
Table 2: Corrosion parameters
SAMPLE 1
Slope data Tafel data Model data
E. corr V 0.5 -0.1906 0.5
i cor. A 4.29E-06 0.5
I cor. A/cm^2 1.60E-06 0.5
Rp Ohm 0.5 -5.76E+06 0.5
ba V/dec 63851.018 0.5
bc V/dec -56.823 0.5
C. Rate mm/y 0.02275 0.5
[image:3.595.48.263.440.612.2]Fig 9: Comparative corrosion rate in mm per year
The data was obtained for all the eight specimen and comparative corrosion rate plot established that the sample 6 with parameters 2500 rpm rotational speed, 2.5,5,7.5 mm/min feed and 90 sec dwell time has minimum corrosion rate of 0.0171 mm/yr.
Force Measurement: Dynamometer was included in the setup to obtain the variation in the force acting on the plates to be joined during the process of welding. The result obtained shows a similar trend in each case. The force acting upon the weld increases directly with the increase in the feed. Since specimen has been divided into three feed region, hence the change in force magnitude is of three times when compared in the first and last region. Figure 10(a-b) exhibits similar trend for two different specimens.
Factorial Analysis: Tensile strength and hardness are analyzed using full factorial analysis to obtain the influence of individual input parameters and their interactions on the above mentioned properties. Analysis of hardness measured is presented in the Table 3.
Talking for the hardness, as per the obtained results the interaction of tool rotational speed and the dwell time has the maximum contribution in the enhanced hardness of weld joint. Whereas the individual contribution of dwell time and combined interaction of all three parameters has the least effect which is almost negligible. Therefore it is proposed that to have an appreciable hardness, the dwell time and the tool rotational speed should be chosen in an
appropriate manner. The mathematical equation relating hardness to input parameters is:
Hardness = (-554.25 + 0.27*A – 21.78*B + 10.70*C + 5.9E-003*AB – 4.167E-003*AC + 0.068*BC)
Similarly the contribution of parameters for tensile strength is represented in Table 4.
[image:4.595.326.522.170.500.2]Fig 10: (a) Force analysis of Specimen 3 (b) Force analysis of specimen 6
Table 3: Contribution of parameters in Hardness TERM Stdizd.
Effect
Sum of Squares
%Contribution
A= RPM 0.62 78.12 2.86
B= Feed -0.076 36.13 1.32 C=Dwell Time 0.68 10.13 0.37
AB 0.031 435.13 15.92
AC -0.73 1953.13 71.47
BC -0.060 210.12 7.69
ABC 0.10 10.12 0.37
a
[image:4.595.308.555.577.741.2]Table 4: Contribution of parameters in Tensile Strength TERM Stdizd.
Effect
Sum of Squares
%
Contribution
A= RPM -0.095 32.15 2.24
B= Feed -0.60 40.09 2.79 C= Dwell
Time
-0.19 9.25 0.64
AB 0.52 1.56 0.11
AC 0.10 722.67 50.28
BC 0.61 503.29 35.01
ABC -0.52 128.41 8.93
A maximized tensile strength function indicates that the interaction of tool rotational speed and dwell time along with the interaction of feed and dwell time have significant contribution. Here the interaction of tool rotational speed and the feed have minimum contribution.
The mathematical equation relating Tensile Strength to input parameters is:
Tensile Strength = (+323.95 - 0.048*A – 105.05*B – 3.36*C + 0.033*AB – 6.0706E-004*AC + 1.39*BC – 4.279E-004*ABC)
IV. CONCLUSION:
Sound weld joints have been obtained between Al6063/Al
Mechanical characterization including Tensile test, Hardness, Corrosion behavior has been performed. Dynamometer has been used to estimate the variation
in force acting on the joint during process and its variation with the feed.
Parameters associated with best properties have been identified.
Percentage contribution of input parameters and their interactions on the mechanical properties has been studied.
Mathematical relationship between input parameters, their interactions on the output properties of weld has been established using full factorial.
REFERENCES
[1] H. J. Liu, H. Fujii, M. Maeda, K. Nogi; Tensile properties
and fracture locations of friction-stir-welded joints of
2017-T351 aluminum alloy; Journal of Material Processing and
Technology (2003)
[2] Reynolds A.P Sci Tecnol Weld Joining 5(2):120 (2000)
[3] Thaiping Chen , Process parameter study on FSW joints of
dissimilar metal for aluminium steel alloys; Journal of
Material Science ; 44 (2009), 2573-2580.
[4] P. Venkateswaran, Z H Xu, X Li, A P Reynolds; “Determination of Mechanical properties of
Aluminium-Magnesium alloys dissimilar Friction Stir Welded interface
by indentation method; Journal of Material Science;
44:4140-4147 (2009)
[5] Takehiko Watanake, Hirofumi Takayama, Atsushi
Yanagisawa ; Joining of Aluminium Alloys to steel by
Friction Stir Welding; Journal of Material Processing
Technology; 178 : 342-349 (2006)
[6] J.Adamowski, C Gambaro, E.Lertora, M.Ponte, M Szkodo ;
Analysis of FSW welds made of aluminium alloy AW 6082-T6”, Archives of Material Science and Engineering, Vol 28,
Issue 8, (2007) 453-460
[7] B.Ashok Kumar, N Murugan; Optimization of Friction Stir
welding process parameters to maximize tensile strength of
stir cast AA6061-T6/AlNp composite ; Material and
Design;57:383-393 (2014)
[8] M Koilraj, V Sundareswaran, S.Vijayan, S R K Rao;
Friction Stir Welding of Dissimilar aluminium alloys
AA2219 to AA5083- Optimization of process parameter
using taguchi principle; material and Design; 42:1-7; 2012
[9] Z.L.Hu; The effect of post processing on tensile property
and microstructure evolution of friction stir welded
aluminium alloy joints; Material Characterization;
99:180-187 (2007)].
Dr. Rahul Chhibber graduated in Production Engineering from Punjab Technical University Jalandhar in 2001. He obtained M.Tech degree in Industrial Metallurgy from Department of Metallurgical and Materials engineering, IIT Roorkee in 2003 and Ph.D degree from Department of Mechanical and Industrial engineering at IIT Roorkee in 2008. His area of specialization is welding and joining of materials. He has worked as an Assistant Professor at Thapar University Patiala from June 2007 to December 2011. In January 2012 he joined IIT Jodhpur and is presently working there as an Assistant Professor in Mechanical Engineering. He has co-authored one book and supervised 20 Master student dissertations and has supervised four Ph.D thesis along with over 40 research publications. His current research interests lie in the field of Mechanical Behaviour of Dissimilar Material Joints, Welding consumable development and Arc Welding Technology