Abstract—SSMA (Spatial Singular Mode Angle) has been proposed as a bridge screening index. It can be calculated only by using data measured on a passing vehicle. The measured vehicle data are only vibration responses and positions. It is numerically found that SSMA is enough sensitive for the bridge damage detection. In this study, the laboratory experiment is carried out to examine the statistical validity. The histogram of SSMA changes after the bridge damage.
Index Terms—SHM, bridge screening, SSMA, vibration
I. INTRODUCTION
HILE an enormous number of civil structures are built, their maintenance is not popular. However, the lack of maintenance would cause fatal and injuring accidents finally. To prevent this problem, the maintenance system should be developed. One of the technical issue on social engineering is the lack of veteran engineers who can assess the structures.
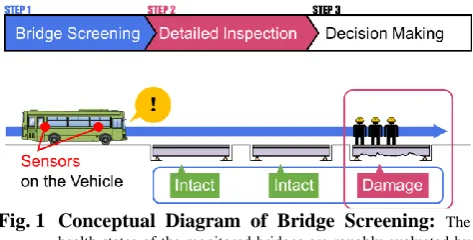
Bridges are one kind of the aging civil structures. They were mainly built during the beginning of motorization era from 1960s. Because of the large number of bridges, it can be expected that this aging problem will lead demand increase for the bridge inspections in spite of the lack of engineers. To deal with this problem that the demand would exceed the supply, it is efficient to allocate the limited human resources strategically by screening. In this study, as the screening technology, VRA (Vehicle Response Analysis) method is proposed. Its conceptual diagram is shown in Fig. 1.
Fig. 1 Conceptual Diagram of Bridge Screening: The health states of the monitored bridges are roughly evaluated by the vehicle passing, first. As the second step, veteran engineers would be sent to only the suspicious bridges for the inspections.
The prerequisites of bridge screening are rapidity, low cost and objectivity. Because of the large number of aging
Manuscript received March 6, 2017; revised April 12, 2017. This work was supported in part by JSPS’s Grant-in-Aid for Young Scientists (B): 25820200.
K. Yamamoto is an assistant professor of “University of Tsukuba”, Japan (phone: +81-29-853-5146; e-mail: [email protected], address: 1-1-1 Ten-No-Dai, Tsukuba, Ibaraki, Japan).
Y. Takahashi is a Ph.D. student of “University of Tsukuba”, Japan.
bridges, we cannot spend much time just for the primary screening. If you would install vibration sensors on each bridge, it is very time-consuming and costly. On the other hand, VRA method uses only the sensors on one passing vehicle with GPS. It enables us to reduce the time required and to suppress the cost at the expense of accuracy. The objectivity can be ensured by adopting vibration-based method to VRA. No matter who carries out the screening based on the proposed method, a result does not change. The veteran engineers can concentrate to check the suspicious bridges which VRA would select.
Generally, the sensors are installed on the bridge in the vibration-based SHM (Structure Health Monitoring), while in the proposed method, the sensors are installed on the vehicle passing over the bridge. This idea is inspired by the studies done by Yang et al.[1] They proposed the method to extract the bridge natural frequency from the Fourier’s power spectrum of vehicle acceleration. It is verified numerically [1],
[2], [3]
and experimentally [4]. Their method is efficient to estimate bridge natural frequencies. However, it is not so accurate to detect the damage. The natural frequency of damaged bridge is just slightly different from that of intact one. Xiang et al.[5], who is inspired by this approach, proposed a tap-scan method. In this method, not only a sensor but also an excitation system is installed on the vehicle. In the VBI (Vehicle Bridge Interaction) system, the excitation frequency changes only when the vehicle passes above the damage position. It can be detected easily from the spectrogram available from the STFT (Short-Time Fourier’s Transform) of the vehicle vibration. The tap-scan method, however, shows low applicability to the cases considering road roughness. Nguen et al.[6] proposes the method to apply CWT (Continuous Wavelet Transform) to vehicle vibration. This method also can show the damage position by peaks, though it still cannot consider the effect of road roughness. The time-frequency domain analyses, such as STFT and CWT, can catch the sign of bridge defects. The time domain is converted to the spatial domain through vehicle position which is the time function. The spatial domain is sensitive to the bridge damage because the bridge damage is generally local. According to the previous studies, the spatial index is feasible for the bridge screening.
The most popular spatial index is mode shape. Assuming that a bridge vibration can be expressed in the product of spatial and time functions, the formers are called mode shapes while the latters are basis coordinates. The local damage changes the local amplitudes of mode shapes. To estimate the mode shapes discretely, two sensors or more should be set on the monitored bridge. As for the bridge screening based on vehicle vibrations, the several sensors should be installed on the vehicle at least. The author and
Experimental Validation of Bridge Screening
Method based on Vehicle Response Analysis
Kyosuke Yamamoto and Yuta Takahashi
[image:1.595.48.285.527.647.2]Oshima et al.[7] proposed a method to estimate the bridge mode shapes from the vehicle vibrations measured by using several sensors. This method can eliminate the effect of road roughness, while it shows the low robustness. Besides, the process of estimation tends to become an ill-condition problem. A sensitive spatial index is the higher order of mode shape, while the increase of assumed measuring points on the bridge reduces the condition number of the process. Thus, the author and Ishikawa [8] has examined a new method which is applicable with considering the road roughness. This method estimates the bridge mode shape from the vehicle vibrations spatially corrected by the vehicle position. The estimated mode shapes do not accurately match the correct one, because the vehicle vibrations are different from the bridge ones. In this study, the estimated first mode shape is called Spatial Singular Mode, and the ratio of its amplitudes is used in the form of angle, called SSMA (Spatial Singular Mode Angle) as the index for damage detection.
II. BASIS THEORY OF THE PROPOSED METHOD A. Mode Shape Estimation of bridge vibrations
In traditional methods, it is on the presumption that bridge mode shapes are estimated by using sensors fixed on the monitored bridge, as shown in Fig. 2. In this figure, the bridge is excited by a moving vehicle.
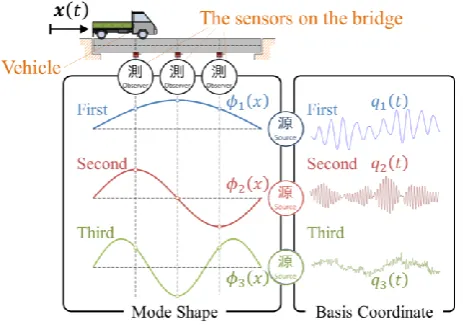
Fig. 2 Traditional Vibration-based SHM: The sensors are installed on the monitored bridge. The bridge vibrations can be mainly classified into two kinds: free vibration and transient. The most popular transient is the traffic-induced vibrations, which means bridge vibrations are excited by passing vehicles. Bridge vibrations can be decomposed into mode shape 𝜙𝑘 𝑥 and basis coordinate 𝑞𝑘 𝑡 .
The bridge vibration can be expressed in a function of position 𝒙 and time 𝑡. The position 𝒙 is a vector which is defined on a two-dimensional plane of which directions are horizontal bridge axis and its orthogonal. In modal analysis, the bridge vibration 𝑦(𝒙, 𝑡) can be decomposed into the 𝑘-th order of mode shape 𝜙𝑘 𝒙 and the basis coordinate 𝑞𝑘 𝑡 as
the following equation.
(1)
𝑦 𝒙, 𝑡 = 𝜙𝑘 𝒙 𝑞𝑘 𝑡
where 𝑘 is dummy index, ranging from 1 to infty. When 𝑛
sensors are installed at the position 𝒙𝑖 on the bridge, the obtained vibrations can be written in the form of vector 𝒚(𝑡)
as the following equation.
𝒚 𝑡 =
𝑦 𝒙1, 𝑡
⋮
𝑦 𝒙𝑛, 𝑡
=
𝜙1 𝒙1 ⋯ 𝜙𝑚 𝒙1
⋮ ⋱ ⋮
𝜙1 𝒙𝑛 ⋯ 𝜙𝑚 𝒙𝑛
𝑞1 𝑡
⋮
𝑞𝑚 𝑡
= 𝐀𝒒 𝑡
(2)
where 𝐀 is the mode shape matrix and 𝒒 𝑡 is the basis coordinate vector. The main target it to estimate the mode shape matrix 𝐀 in this problem. Now, 𝑚 is the maximum modal order to be considered. Assuming that 𝑚 = 𝑛, the mode shape matrix 𝐀 is an regular orthogonal matrix, namely
𝐀T𝐀 = 𝐀𝐀T = 𝐈, where I is the 𝑛 × 𝑛 unit matrix. The
orthogonality of the mode shapes comes from the definition in which 𝑘-th mode shape 𝜙𝑘 𝑥 is an eigen vector of the beam system in the state of free vibration.
Usually, the available vibration data is acceleration 𝒚 𝑡 . (3)
𝒚 𝑡 = 𝐀𝒒 𝑡
where denotes the second order derivative with respect to time 𝑡. To estimate the mode matrix 𝐀, SVD (Singular Value Decomposition) can be applied.
An arbitrary matrix 𝐗 ∈ 𝑅𝑎×𝑏 can be decomposed into
three matrix: An orthogonal matrix 𝐔 ∈ 𝑅𝑎×𝑎, a diagonal
matrix 𝚺 ∈ 𝑅𝑐×𝑐 and an orthogonal matrix 𝐕 ∈ 𝑅𝑏×𝑏, where
𝑐 = min 𝑎, 𝑏 .
(4)
𝐗 =
𝐔 𝚺 𝐎 𝐕T when 𝑎 ≤ 𝑏
𝐔 𝚺
𝐎 𝐕
T when 𝑎 > 𝑏
where 𝐎 is a zero matrix, and T denotes transposition. As
for the data matrix 𝐘 = 𝒚 𝑡1 ⋯ 𝒚 𝑡𝑁 , because the
data length 𝑁 > 𝑛, the SVD can be given by
(5)
𝐘 = 𝐔 𝚺 𝑶 𝐕T
= 𝐔𝚺𝐕T
where 𝐕 ∈ 𝑅𝑁×𝑛 is the part of the matrix 𝐕; 𝐕 = 𝐕 𝐎 . It
satisfies that 𝐕T𝐕 = 𝐈. In this case, 𝐔 can be the estimated
matrix for the mode shape matrix 𝐀, while 𝐐 ∈ 𝑅𝑛×𝑁
(= 𝚺𝐕T) denotes the estimated basis coordinates 𝒒 𝑡 in the
form of data matrix.
SVD assumes that the basis coordinate is non-correlation, namely 𝐐𝐐T= 𝚺2; 𝚺2 is a diagonal matrix. It is known that
this condition is exactly satisfied in three cases: free vibration state, stationary state and steady state due to white Gaussian noise inputs. On the other hand, the traffic-induced vibration does not always satisfy the condition of non-correlation on
𝒒 𝑡 . While its applicability to the traffic-induced vibrations
should be examined, the accuracy of mode shape estimation can be expected to be enough for many cases; as the first and low modes are predominant comparing with the high modes, the cross correlation (= 𝑞𝑘 𝑡 𝑞𝑙 𝑡 𝑑𝑡) is relatively very
small.
[image:2.595.47.279.377.542.2]are fixed on the structure. The sensors in the propose method, however, moves as the vehicle runs.
Assuming the moving observation points, Eq. (3) becomes
(6)
𝒚 𝑡 =
𝑦 𝒙𝟏 𝑡 , 𝑡
⋮
𝑦 𝒙𝒏 𝑡 , 𝑡
=
𝜙11 𝑡 ⋯ 𝜙1𝑛 𝑡
⋮ ⋱ ⋮
𝜙𝑛1 𝑡 ⋯ 𝜙𝑛𝑛 𝑡
𝑞 1 𝑡
⋮
𝑞 𝑛 𝑡
= 𝚽 𝑡 𝒒 𝑡
Where 𝒙𝒊(𝑡) is the position of 𝑖-th moving sensor and the
𝜙𝑖𝑗 𝑡 is the 𝑗-th order of the mode shape at the position of
𝒙𝒊(𝑡). The basis coordinate vector 𝒒 𝑡 in Eq. (6) is the same
with that in Eq. (3).
To apply SVD to Eq. (6), it is necessary to replace the un-known function matrix 𝚽 𝑡 with the product of a known function matrix 𝐍 𝑡 and the coefficient mixing matrix 𝐀. Therefore, Eq. (6) becomes
(7)
𝒚 𝑡 = 𝐍 𝑡 𝐀𝒒 𝑡
where the known function matrix 𝐍 𝑡 consists in 𝑛-th shape functions;
(8)
𝐍 𝑡 =
𝑁1 𝒙𝟏 𝑡 ⋯ 𝑁𝑛 𝒙𝟏 𝑡
⋮ ⋱ ⋮
𝑁1 𝒙𝒏 𝑡 ⋯ 𝑁𝑛 𝒙𝒏 𝑡
where 𝑁𝑗 𝑥 is the shape functions, and 𝑥𝑖 𝑡 is the position of 𝑗-th sensor. The shape functions are the functions which satisfy the following conditions:
(9)
𝑁𝑖 𝑥 𝑗 =
0 𝑖 ≠ 𝑗 1 𝑖 = 𝑗
𝑁𝑖 𝑥
𝑛
𝑖=1
= 1
where 𝑥 𝑗 is the position of 𝑗-th assumed fixed point on the
bridge. Lagrange’s interpolations is one of the most popular shape function. It is used for FEM (Finite Element Method), for example.
Once 𝒚 𝑡 and 𝐍 𝑡 are obtained, Eq. (6) can be linearized. (10)
𝒅 𝑡 = 𝐍−1 𝑡 𝒚 𝑡 = 𝐀𝒒 𝑡
where 𝒅 𝑡 is the estimation of the bridge vibrations 𝒚 𝑡 . Assuming that 𝒚 𝑡 which is the bridge vibrations at the moving points can be taken as the vehicle vibrations, SVD can be applied to 𝒅 𝑡 in the same way with Eq.(5). However, the vehicle vibrations are not always same with 𝒚 𝑡 , because the vehicle vibrations are predominantly affected by the road roughness and the vehicle body itself.
In this study, it is assumed that the observed vehicle vibrations can be taken for 𝒚 𝑡 despite the low accuracy. The road roughness is ignored. The accuracy of mode shape estimation is low, while this proposed method can be still applicable for the rough screening. When it is applied to the bridge damage detection, it is known that the estimated mode shape changes sensitively after the damage. In this aspect, it is possible to detect the bridge damage by comparing 𝐔0, which is the estimated mode shapes before the damage, with
𝐔1, which is that after.
C. Definition of SSMA
To avoid the ill-condition problem in Eq. (10), two sensors are installed at the front and rear axles. Fig. 3 shows the bridge mode shape estimated by using two sensors.
Fig. 3 The Installed and Assumed Sensors: The vibration sensors are installed only on the passing vehicle in the proposed method. To estimate the bridge mode shape, the measuring points fixed on the bridge are virtually assumed.
In this case, the shape function matrix 𝐍 𝑡 can be written in linear functions as the follow:
(11)
𝐍 𝑡 =
−3
𝐿 𝑥1 𝑡 −
2𝐿 3
3
𝐿 𝑥1 𝑡 −
𝐿 3
−3
𝐿 𝑥2 𝑡 −
2𝐿 3
3
𝐿 𝑥2 𝑡 −
𝐿 3
.
This equation satisfies the condition shown in Eq. (9). The estimated mode shape matrix can be given by
(12)
𝐔 = 𝑈𝑈11 𝑈12
21 𝑈22
where 𝑈𝑖𝑘 is the amplitude of 𝑘-th order mode shape at the position of 𝑥 𝑖; 𝑥 1= 𝐿 3 and 𝑥 2= 2𝐿 3. 𝐿 is the bridge span. To normalize 𝐔 so that its norm equals to one,
𝑈22= −𝑈11, 𝑈21= 𝑈12 and 𝑈𝑘12 + 𝑈𝑘22 = 1, SSMA 𝜃 can
be defined by the following equation.
(13)
𝜃 = tan 𝑈21
𝑈11 = tan −
𝑈12
𝑈22
where 0 ≤ 𝜃 ≤ 𝜋 2.
III. LABORATORY EXPERIMENT A. Models of Vehicle and Bridge Girder
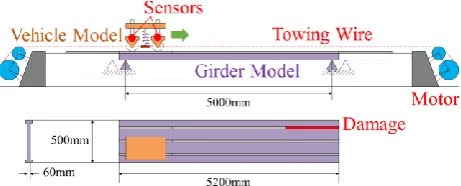
To validate the applicability of SSMA-based VRA to bridge damage detection, a laboratory experiment is carried out. The introduced models are shown in Fig.4.
[image:3.595.67.236.93.176.2] [image:3.595.318.522.117.262.2] [image:3.595.306.537.657.750.2]The vehicle model consists of a sprung-mass and two unsprung-mass plates, which are connected with four spring axes. These springs are the model of suspension. The photo of the vehicle model is shown in Fig. 5, while the bridge girder model is shown in Fig. 6.
Fig. 5 The Photo of the Vehicle Model: The vehicle model consists of the sprung and unsprung mass plates. Two unsprung mass plates are connected with sprung mass plate with four spring axes which is modeling the vehicular suspension.
Fig. 6 The Photo of the Bridge Model: The bridge girder model has three rails. Two of three are used for vehicle running. The damage is modeled by removing another rail. This model consists of the main girder and approach sections.
The accelerometers are installed on the unsprung-mass plates. It runs on rails by a towing wire. The span length is 5m. This model has three rails, of which two rails are used for vehicle running. The damage is modeled by removing another rail. Each rail has unevenness modeling the road roughness, shown in Fig. 7.
Fig. 7 The Road Roughness Model: The unevenness function is generated by Monte Carlo Simulation, based on an actual data.
B. Running Scenario
The running speed of the vehicle model is controlled by the rotation ratio of the towing wire’s motor. The running speed and repeat count for each scenario are shown in TABLE I.
TABLE I
Running Speed and Repeat Count for Each Scenario
Running Speed Repeat Count
Running Speed Repeat Count
rpm m/s rpm m/s
6.0 0.203 9 9.0 0.203 5
6.1 0.206 9 9.1 0.309 5
6.2 0.210 9 9.2 0.313 5
6.3 0.213 9 9.3 0.316 5
6.4 0.216 9 9.4 0.320 5
6.5 0.220 19 9.5 0.323 9
6.6 0.223 19 9.6 0.326 9
6.7 0.226 19 9.7 0.330 9
6.8 0.229 19 9.8 0.333 9
6.9 0.233 19 9.9 0.337 9
7.0 0.236 19 10 0.340 9
7.1 0.240 19 10.1 0.343 9
7.2 0.243 19 10.2 0.347 9
7.3 0.247 19 10.3 0.350 9
7.4 0.250 19 10.4 0.354 9
7.5 0.254 19 10.5 0.357 9
7.6 0.257 9 10.6 0.360 5
7.7 0.261 9 10.7 0.364 5
7.8 0.264 9 10.8 0.367 5
7.9 0.268 9 10.9 0.371 5
8 0.271 9 11 0.374 5
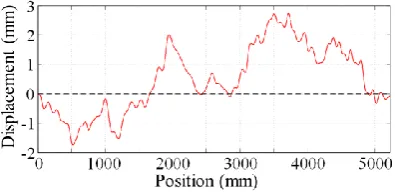
An example of the vehicle response for each case is shown in Fig.8. The running speed is 6.0 rpm (0.203m/s). The vehicle response doesn’t change after the bridge damage.
Fig. 8 The Acceleration Responses of the Front Axle of the Vehicle Model: Generally, the acceleration responses of the vehicle doesn’t change even after a great damage occurred. The blue curve indicates the vertical acceleration response of the front axle during passing over the intact bridge, while the red curve indicates that over the damaged bridge.
This tendency can be confirmed in the frequency domain. The Fourier’s Power Spectra of these responses are shown in Fig.9. The peaks and distributions of the responses before and after the damage are matching well.
Fig. 9 The Fourier’s Power Spectra of Responses of the Vehicle Model: A vehicle system is generally affected by road profile. The responses of the unsprung-mass of the vehicle model has the components ranging of 5-20Hz and 30-40Hz.
Because of these characteristics on vibration responses of a passing vehicle, it is generally difficult to detect or identify a
[image:4.595.48.280.114.286.2] [image:4.595.298.546.135.364.2] [image:4.595.45.281.352.532.2] [image:4.595.298.550.420.503.2] [image:4.595.312.520.604.730.2] [image:4.595.68.266.661.757.2]bridge damage from the vehicle responses.
C. Results and Discussions
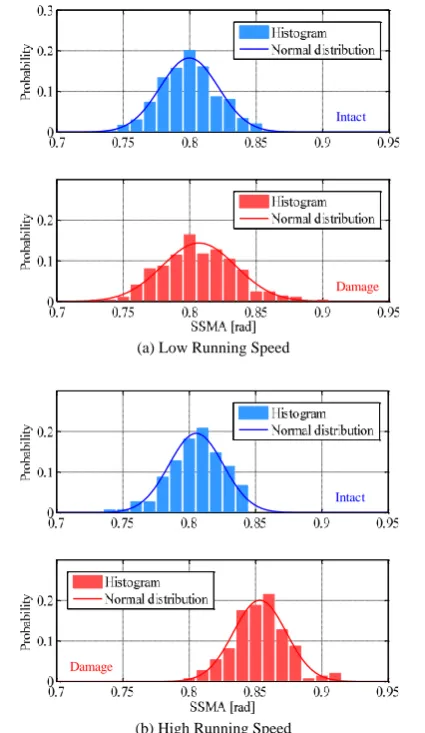
SSMA can be calculated by using the vehicle responses and positions. The histogram of SSMA before and after the damage was introduced on the bridge girder model is shown in Fig. 10.
(a) Low Running Speed
[image:5.595.308.543.60.520.2](b) High Running Speed
Fig. 10 The histogram of SSMA: When the vehicle runs over the bridge at higher speed, SSMA changes well. In this figure, when assuming that the distributions can be taken as normal distributions,
According to the previous study, it is necessary to fix the measuring environment including the running speed of the vehicle. Thus, to consider the effect of variety of speed, the result of SSMA frequency is summarized in one from the cases of distributed speed. Fig. 10 (a) indicates the frequency distribution of obtained SSMA in the cases of the running speed ranging from 6 rpm to 8 rpm. The number of samples is 299. In these cases, SSMA doesn’t change well. On the other hand, Fig. 10 (b) indicates those in the case of the running speed ranging from 9 to 11 rpm, and SSMA changes after the damage occurred on the bridge. It means that the applicability of SSMA depends on the running speed. The number of samples is 149 for the faster speeds.
Next, SSMA for each running scenario is shown in Fig. 11. The horizontal axis denotes SSMA while the horizontal does the running speed. Markers in the figure indicates obtained SSMA, and the polygonal lines do the average for each speed.
(a) Low Running Speed
[image:5.595.56.269.158.525.2](b) High Running Speed
Fig. 11 The obtained SSMA for each running scenario:
SSMA depends on the vehicle speed. It means that the SSMA accuracy of estimating the bridge mode shape is low because the mode shapes are independent from the vehicle parameters. On the other hand, the changes of SSMA is distinct, which means its high sensitivity to the damage.
According to these figures, SSMA changes distinctively after the damage in the cases of faster running speeds. This means that SSMA has the high sensitivity to the damage. It also shows that SSMA depends on the speed and the estimation accuracy itself for the bridge mode shape is very low. The applicability to the damage detection is enough, while that to the damage identification cannot be observed. In other words, we can know whether there is damage or not, by using SSMA, while we cannot identify where, what and how the damage is. However, this result satisfies our aim, in which SSMA-based VRA would be used for bridge screening.
IV. CONCLUSIONS
In this study, to examine the applicability of SSMA to
Intact
Damage
Intact
bridge screening, the model-based laboratory experiment is carried out. SSMA shows the high sensitivity to a bridge damage.
In the laboratory experiment, the vehicle and bridge girder models are used. The road roughness is introduced on the rails, by considering actual road profile. The vehicle runs over the bridge girder model in several count numbers. SSMA from the cases of varied speeds is summarized in one frequency distribution to consider the difficulty to fix the running speed in the actual measuring. The running speed affect the results of SSMA, so it is difficult to estimate bridge mode shapes accurately. Because of that, we cannot identify the damage location, severity and kinds. However, SSMA sensitivity is enough for rough screening.
In the future work, we will improve several characteristics. For example, in SSMA-based VRA, we need compare the obtained values with the intact ones, or with the reference values at least. However, it is difficult to monitor SSMA under the same measuring conditions. It is necessary to find the new method to assess bridges without the data in the intact cases.
REFERENCES
[1] Yang, Y.B., Lin, C.W., and Yau, J.D., “Extracting bridge frequency from the dynamic response of a passing vehicle”, Journal of Sound and
Vibration, Vol.272, pp.471-493, 2004.
[2] Yang, Y.B. and Chang, K.C., “Extracting the bridge frequencies indirectly from a passing vehicle”, Parametric study, Engineering
Structures, 31, pp.2448-2459, 2009.
[3] Y.B. Yang, K.C. Chang, “Extraction of bridge frequencies from the dynamic response of a passing vehicle enhanced by the EMD technique”, Journal of Sound and Vibration, 322, pp.718-739, 2009. [4] Ling, C.W. and Yang, Y.B., “Use of a passing vehicle to scan the
fundamental bridge frequencies: An experimental verification”,
Engineering Structures, Vol.27, pp.1865-1878, 2005.
[5] Xiang, Z., Dai, X., Zhang, Y. and Lu, Q., “The Tap-Scan Damage Detection Method for Beam Structures”, Advances Interaction &
Multiscale Mechanics, pp.541-553, 2010.
[6] Nguyen, K.V. and Tran, H.T., “Multi-cracks detection of a beam-like structure based on the on-vehicle vibration signal and wavelet analysis”, Journal of Sound and Vibration, Vol.329, pp.4455-4465, 2010.
[7] Oshima, Y., Yamamoto, K., Sugiura, K., “Damage assessment of a bridge based on mode shapes estimated by responses of passing vehicles”, Smart Structures and Systems, Volume 13, Issue 5, pp.731-753, 2014.