Graduate Theses and Dissertations Iowa State University Capstones, Theses and Dissertations
2017
Supply chain risk management: capabilities and
performance
Pam Manhart Iowa State University
Follow this and additional works at:https://lib.dr.iastate.edu/etd
Part of theBusiness Administration, Management, and Operations Commons, and the
Management Sciences and Quantitative Methods Commons
This Dissertation is brought to you for free and open access by the Iowa State University Capstones, Theses and Dissertations at Iowa State University Digital Repository. It has been accepted for inclusion in Graduate Theses and Dissertations by an authorized administrator of Iowa State University Digital Repository. For more information, please contactdigirep@iastate.edu.
Recommended Citation
Manhart, Pam, "Supply chain risk management: capabilities and performance" (2017).Graduate Theses and Dissertations. 16934.
Supply chain risk management: Capabilities and performance
by
Pam Manhart
A dissertation submitted to the graduate faculty in partial fulfillment of the requirements for the degree of
DOCTOR OF PHILOSOPHY
Major: Business and Technology (Supply Chain Management) Program of Study Committee:
Jennifer Blackhurst, Co-major Professor Frank Montabon, Co-major Professor
James Summers Scott Grawe Joey George
The student author and the program of study committee are solely responsible for the content of this dissertation. The Graduate College will ensure this dissertation is
globally accessible and will not permit alterations after a degree is conferred.
Iowa State University
Ames, Iowa
2017
DEDICATION
This dissertation is dedicated to my late Grandmother, Elizabeth Schlegelmilch, who was denied the opportunity to pursue her dream of a college education. Her high school principle discarded her college scholarship and acceptance letter because he didn’t believe women should go to college. She instilled her passion for college education in all of her children and grandchildren. I want to thank all of my family for their support,
TABLE OF CONTENTS
Page
LIST OF FIGURES ... v
LIST OF TABLES... vi
NOMENCLATURE……….. viii
ACKNOWLEDGMENTS ... ix
ABSTRACT………. ... x
CHAPTER 1 GENERAL INTRODUCTION ... 1
CHAPTER 2 RELATIONSHIPS BETWEEN SUPPLY CHAIN RISK MANAGEMENT CAPABILITIES AND PERFORMANCE……….………… 3
2.1 Introduction ... 3
2.2 Hypothesis Development ... 8
2.2.1 Paradox Theory. ... 8
2.2.2 Contingency Theory………. ... 14
2.3 Method………... ... 20
2.3.1 Selection Process……… 21
2.3.2 Coding of Variables……… 23
2.3.3 Meta Analytic Procedure……… 25
2.4 Results……… . 27
2.4.1 Paradox or Tradeoff……… 28
2.4.2 Potential Moderators……….. 33
2.5 Discussion……… . 40
2.5.1 Theoretical Contributions……… ... 40
2.5.2 Managerial Implications……… ... 41
2.6 Limitations……… .... 42
2.7 Future Research……… . 43
CHAPTER 3 SUPPLY CHAIN RESILIENCE: ORGANIZATIONAL LEARNING
FROM DISRUPTION…………..……… 45
3.1 Introduction ... 45
3.2 Organizational Learning and Supply Chain Resilience ... 47
3.2.1 Organizational Learning……… 47
3.2.2 Supply Chain Resilience………. 50
3.3 Method ... 51
3.3.1 Data Collection and Coding……… . 51
3.3.2 Within Case Analysis……… 55
3.3.3 Cross Case Analysis……… . 74
3.4 Discussion………... 84
3.4.1 Theoretical Contributions………. 84
3.4.2 Managerial Implications………. 86
3.5 Limitations………. 86
3.6 Future Research……….. 87
3.7 Summary ... 88
BIBLIOGRAPHY. ... 88
APPENDIX A: ADDITIONAL MATERIAL ... 111
LIST OF FIGURES
Page
LIST OF TABLES
Page
Table 1 Sample Selection……… 23
Table 2 Papers Used in Meta-Analysis ... 24
Table 3 Meta-Analysis Formulas ... 26
Table 4 Proactive and Reactive Effects on Performance ... 29
Table 5 Proactive and Reactive Regression Analysis ……….. 29
Table 6 Dual Capabilities Based on the SCRM Process……….. ... 30
Table 7 SCRM Relationships with Performance……….. 31
Table 8 Proactive and Reactive Classification……… .. 31
Table 9 Integration ... 35
Table 10 Organizational Culture……… ... 36
Table 11 Industry and Country ... 37
Table 12 Country Analysis………... 39
Table 13 Sources of Disruption ………. ... 40
Table 14 Participant Summary………. 54
Table 16 Organizational Learning Mechanisms……… .... 80
Table 17 Model of Organizational Learning From Disruption……… 81
Table 18 Bracketing Theoretical Framework……… . 83
NOMENCLATURE
CI Confidence Interval
CV Credibility Interval
SC Supply Chain
ACKNOWLEDGMENTS
My sincerest appreciation and gratitude extends to my committee chair, Dr. Jennifer Blackhurst for her relentless support and assistance throughout my graduate education. Despite obstacles and challenges she has continued to inspire, serve as mentor and friend, without whom, this achievement would not be possible. I would also like to thank Dr. Frank Montabon for graciously serving as co-chair in the middle of my program. His quick
transition and guidance enabled the timely accomplishment of my goals.
I would like to thank each and every one of my committee members, Dr. Jennifer Blackhurst, Dr. Frank Montabon, Dr. James Summers, Dr. Scott Grawe, and Dr. Joey George for their guidance and support throughout the course of this research. They have
generously shared their time and knowledge for which I am most grateful. More
importantly, their insight and feedback has improved my work immensely. In addition, I would also like to thank the supply chain PhD area committee for their faith in my potential: Dr. Jennifer Blackhurst, Dr. Frank Montabon, and Dr. Dave Cantor.
ABSTRACT
CHAPTER 1 GENERAL INTRODUCTION
A core tenet of supply chain management is maintaining a constant supply of goods and services through their networks. Despite their best efforts, however, supply risk and disruptions are inevitable. A supply chain disruption is an event which interrupts this flow. Managing this supply chain risk of disruption is increasingly challenging and of growing interest to researchers and practitioners.
Supply chain risk management has become increasingly challenging due to two factors. First, the environments in which supply chains operate has become increasingly dynamic and prone to disasters. One study reports that the top three disruptions are IT outages, natural disasters and supplier service issues (Glendon & Bird, 2013). At the same time, organizations are experiencing increasing competitive pressure, and engaging in more outsourcing and offshoring. This makes engaging and monitoring suppliers more difficult. This combination of factors make supply chain networks more vulnerable to disruptions (Blackhurst, Dunn, & Craighead, 2011; Bode, Wagner, Petersen, & Ellram, 2011; Christopher & Holweg, 2011; Craighead, Blackhurst, Rungtusanatham, & Handfield, 2007; Kim, Chen, & Linderman, 2015). This not only increases exposure to risk but propagation once a disruption occurs (Blackhurst, Craighead, Elkins, & Handfield, 2005; Craighead et al., 2007; Ponomarov & Holcomb, 2009). Propagation refers to the spread of a disruption, impacting dependent parties connected through supply chain networks.
to cultivate them. To make matters worse, due to environmental dynamism, the strategies and capabilities which maintain supply today may not be adequate tomorrow. Firms must remain vigilant and constantly adapt to their changing environment. Contingencies such as these impact the effectiveness of various capabilities.
This study attempts to contribute to the understanding of what capabilities are most important in managing supply chain risk and how to develop them. Chapter 2 is a meta-analytic study of the existing empirical supply chain risk management research. This is a quantitative literature review showing which capabilities are the most effective for supply chain risk management, and which combinations are complementary or tradeoffs. It also identifies which constructs would be fruitful avenues for future research. Chapter 3 is a qualitative study describing how firms can improve their resilience to a disruption through organizational learning. Specifically, we address the questions of how organizations
CHAPTER 2 RELATIONSHIPS BETWEEN SUPPLY CHAIN RISK MANAGEMENT AND
PERFORMANCE: A META ANALYTIC INVESTIGATION
Pam Manhart, Dr. James Summers, Dr. Jennifer Blackhurst
2.1 Introduction
Supply chain risk is the susceptibility to a supply chain disruption which is an interruption in the flow of materials (Craighead et al., 2007). The supply chain risk management process has been described with varying numbers of steps but they all have three basic phases in common: 1) prevention and preparation, 2) the disruption
occurrence, and 3) response and recovery. Several mitigation capabilities have been identified to prepare for and prevent supply chain disruptions: contingency planning (Christopher & Lee, 2004), information sharing (Brandon‐Jones, Squire, Autry, & Petersen, 2014), postponement (Boone, Craighead, & Hanna, 2007), supplier monitoring (Blackhurst et al., 2011), trust (Bode et al., 2011) and redundancies such as dual sourcing (Chopra & Sodhi, 2004), safety stocks (Manuj & Mentzer, 2008a) and excess capacity (Peck, 2005).
occurs in the marketplace and reputations are damaged with suppliers. Internally, employees can lose faith in their supply chain.
Mitigation capabilities have also been identified to respond and recover from a disruption: agility (Christopher & Towill, 2001), bridging linkages (Bode et al., 2011), communication (Manuj & Mentzer, 2008b), coordination (Kleindorfer & Saad, 2005), early detection (Craighead et al., 2007), flexibility (Skipper & Hanna, 2009), and root cause analysis (Elkins, Handfield, Blackhurst, & Craighead, 2005) to name a few.
Reactive supply chain risk management capabilities are important because firm losses have greater impact as disruptions propagate through the network over time. Firms with superior supply chain risk management can experience shorter recoveries with reduced losses. Likewise, when a disruption impacts an industry, it can be a source of competitive advantage for the firm recovering first (Craighead et al., 2007; Fiksel, Polyviou, Croxton, & Pettit, 2015; Greening & Rutherford, 2011; Skipper & Hanna, 2009). Similarly, marketing research has found that some firms can gain stronger relationships by
responding well to a breach of trust as opposed to no event occurring (Aaker, Fournier, & Brasel, 2004).
The literature in supply chain risk management reveals a lack of consensus. One sign of lack of consensus is the inconsistent use of definitions. For example, Hohenstein et al. (2015) discovered 46 unique definitions of supply chain resilience. What resilience definitions have in common is the capability to manage flow, either preventing or quickly recovering from a supply chain disruption. Similarly, supply chain resilience has been Brandon‐Jones et al. (2014) describe resilience and robustness as a continuum from
overall supply chain risk management capability balancing proactive and reactive capabilities with robustness as a proactive dimension.
Clearly these factors need more precise and parsimonious meanings. When definitions are inconsistent they vary in operationalizations. Consistency is required to identify significant relationships among variables (O'Leary-Kelly & J. Vokurka, 1998; Schwab, 1980). Likewise, ambiguity results in confusing and contradictory outcomes and lack the capability to advance theory (Flynn & Flynn, 2004; Rosenzweig & Roth, 2004).
We find evidence of contradictory results in relationships between supply chain risk management capabilities and supply chain risk management For example, integration has been considered key to supply chain risk management (Frohlich & Westbrook, 2001; Leuschner, Rogers, & Charvet, 2013; Manuj & Mentzer, 2008b; Ponomarov & Holcomb, 2009) yet contrary evidence was found by Wieland and Wallenburg (2013). They found that only communication and cooperation were necessary. They operationalize integration as distinct from communication and cooperation, however, while other studies
operationalize communication and cooperation as dimensions of integration (Flynn, Huo, & Zhao, 2010; Leuschner et al., 2013).
Precise and parsimonious construct definitions are required for accurate measurement of variables and their relationships (O'Leary-Kelly & J. Vokurka, 1998;
Schwab, 1980). The inconsistency in definitions and operationalization of supply chain risk management constructs has likely contributed to the contradictory research results. In fact, in their review of supply chain resilience, Hohenstein et al. (2015) found the lack of
Similarly, links between supply chain risk management and performance outcomes are not well understood. Traditional manufacturing efforts focus on productivity and efficiency sometimes at a contrast to marketing or business strategy (Skinner, 1969). For instance, Simchi-Levi, Schmidt, and Wei (2014) found that firms often prioritize their supply chain risk management by annual spend, although spend is not correlated with company performance. Firms then remain vulnerable, because low cost commodity
suppliers were overlooked. Traditional cost calculations consider proactive capabilities as costly when an incident does not occur. However, when factoring in the avoidance of losses, the lack of any disruption could be considered savings. In fact a recent study found that obtaining top management support for investments is one of the key challenges to supply chain risk management (Glendon & Bird, 2013). Prior disruption experience has been shown to improve supply chain risk management performance suggesting that firms must endure a disruptive event prior to recognizing its value (Bode et al., 2011).
Once a firm recognizes the need for supply chain risk management, they lack
understanding in practice of which capabilities have the greatest effect. Elkins et al. (2005) found firms consistently stated the need for processes dealing with disruptions. More recently, a 2011 study found that still only 10% of firms had specific plans for mitigating a supply chain disruption (Black et al.). Firmly establishing empirical links between supply chain risk management capabilities and performance outcomes may help gain the strategic recognition it needs for appropriate top management support.
(Durach et al., 2015; Ponomarov & Holcomb, 2009; Sodhi et al., 2012) but no systematic quantitative review has yet been conducted.
We argue that the supply chain risk management field needs a quantitative
synthesis of empirical studies in order to generate consensus and point future work toward areas which can resolve these issues (Humphrey, 2011; Hunter & Schmidt, 2004). Thus, the purpose of this study is to clarify the lack of consensus regarding which constructs are the most effective to supply chain risk management, the relationships among them, and which combinations are positively related to performance. It is by understanding the
interrelationships that will help practitioners and academics transition from conducting risk management activities to improving resiliency (Van Der Vegt et al., 2015). The research questions, therefore, are which capabilities have the greatest effect on supply chain risk management performance? Which combinations lead toward superior firm performance?
We therefore undertake a meta-analysis of empirical supply chain risk management work. It focuses on the direction and magnitude of effects, not the statistical significance. A meta-analysis can help gain consensus, resolve conflicts and increase generalizability by aggregating multiple individual studies (Hunter & Schmidt, 2004). It provides direction for future streams of research by pointing to gaps in the literature and identifying the presence of unknown moderators.
This research makes several contributions. First we study the classification of capabilities of and relationships between proactive and reactive supply chain risk
chain risk management and firm performance. Lastly, future work is identified to help drive future work in those areas of need.
[image:19.612.86.536.174.384.2]2.2 Hypothesis Development
Figure 1: Supply Chain Risk Theoretical Model
2.2.1 Paradox theory
We utilize paradox theory to analyze capabilities and their relations. Figure 1 above illustrates the overall theoretical model. A paradox is an condition based upon two
2000). By simultaneously engaging in contradictory strategies, firms may gain synergies between them (March, 1991).
We classify supply chain risk management capabilities according to proactive and reactive capabilities. We hypothesize that capabilities in the preparation and prevention phase of the supply chain risk management process enable greater supply chain risk management. Preparation and prevention of a supply chain disruption will preclude associated losses and improve supply chain risk management performance. Qualitative literature reviews have summarized anticipation and resistance (Kamalahmadi & Parast, 2016) and readiness (Ho, Zheng, Yildiz, & Talluri, 2015) to enable supply chain resilience. More specifically, Tukamuhabwa, Stevenson, Busby, and Zorzini (2015) identifies 17 proactive capabilities for supply chain resilience in their literature review.
H1: Proactive risk management capabilities have a positive relationship to supply chain risk management performance.
H2: Reactive risk management capabilities have a positive relationship to supply chain risk management performance.
We also hypothesize that supply chain risk management will enable greater firm performance. Successful management of supply chain risks should increase revenues because disruptions to the marketplace are fewer and of less significant impact. Likewise, successful management of supply chain risks should decrease expenses as recovery costs are minimized. Wieland and Wallenburg (2012) examined both proactive (robust) and reactive (agile) capabilities and their relationship with supply chain risk management and business performance found that only proactive (robust) capabilities had a statistically significant relationship. The literature review by Ho et al. (2015) find that significant relationships exist between supply chain risk management processes and call for work incorporating multiple components. Ghadge, Dani, and Kalawsky (2012) also note the need for holistic work including both proactive and reactive strategies.
H3: Supply chain risk management has a positive relationship with firm performance.
Tradeoffs
Although studies acknowledge that some level of both proactive and reactive strategies may need to be employed they are not recognized as potential
complementarities and often framed as tradeoffs to be compromised (Chopra & Sodhi, 2004; Norrman & Jansson, 2004; Thun & Hoenig, 2011; Yang & Yang, 2010). In a tradeoff, one is at the expense of the other (Skinner, 1969). Tradeoffs occur when competing
when a disruption does not occur, therefore, some firms rely on responses to actual disruptions (Christopher & Peck, 2004). Inefficiencies or compromises are expected to occur when conducting both (Fiksel, 2003; Pettit, Fiksel, & Croxton, 2010; Wagner & Bode, 2008; Yang & Yang, 2010).
Plants have limited resources so managers attempt to maximize efficiency by
choosing to focus on the development of a few selected capabilities (Hayes & Wheelwright, 1984; Norrman & Jansson, 2004). Imagine a potential supplier selection decision. A firm with a proactive strategy may select the most reliable supplier to prevent a disruption. A firm with a reactive strategy, on the other hand, may select the lowest cost supplier so that safety stock inventories can be maintained. Tradeoffs are demonstrated by a recent study on the relationship between collaboration and flexibility (Scholten & Schilder, 2015).
Relation specific investments in mutually dependent relationships enable collaboration and increased supply chain resilience. However, this increases costs of the flexibility in utilizing an alternative supplier. We therefore test paradox theory by exploring the alternative potential of tradeoffs between risk management capabilities and outcomes.
H4a: Proactive risk management capabilities have a negative relationship to reactive risk management capabilities.
Complementarities
making consistent with the alignment of both domains (Smith, 2014). Paradox theory explains complex systems better than contingency theory which focuses on a small number of variables, because paradox theory assumes that tensions exist in complex systems (Smith, 2014). Echoing the call of Matthews, Power, Touboulic, and Marques (2016) for greater use of a paradox lens, supply chain risk management research may develop further by examining the dualities as opposed to attempting to capture all of the contingencies involved in complex systems.
Some research has attempted to combine seemingly opposing supply chain risk management capabilities through a temporal lens based on their application in the supply chain risk management process. Ponomarov and Holcomb (2009) developed the most parsimonious capability model with three phases of readiness, response and recovery. Others have elaborated four (Hohenstein et al., 2015), five (Manuj & Mentzer, 2008b; Sáenz & Revilla, 2014), and eight separate phases (Sheffi & Rice Jr, 2005) to classify and integrate supply chain risk management capabilities. The problem with these, as Tukamuhabwa et al. (2015) points out is that several capabilities may be planned proactively yet enacted
reactively making process-based, temporal classifications “gray” or confusing. Research has considered the potential complementarity of supply chain risk management capabilities. After conducting a literature review, Ghadge et al. (2012)
risk management processes are inter-related and a comprehensive review of strategy selection and joint impact is needed.
Wieland and Wallenburg (2013) found synergies between proactive and reactive strategies from supply chain visibility. In addition to supply chain risk management, Norrman and Jansson (2004) noticed that tools developed for supply chain risk
management were being used for other business purposes providing more firm benefits. These initial findings support the argument based in paradox theory. A holistic approach to risk management which embraces paradoxical tensions may reveal the complementarities of constructs resulting in even greater resiliency.
Paradox theory has rarely been applied in supply chain but a well-known example from other domains is ambidexterity. Ambidextrous firms simultaneously engage in
exploration and exploitation (Ashforth, Rogers, Pratt, & Pradies, 2014; Tushman & O Reilly, 1996). The most innovative firms view exploitation of existing resources and exploration of new opportunities both as necessary and thus jointly manage (Andriopoulos & Lewis, 2009). We similarly argue that supply chain resiliency requires the joint management of both proactive and reactive risk management capabilities. We therefore test paradox theory by exploring the potential complementarity between proactive and reactive supply chain risk management capabilities and outcomes.
2.2.2 Contingency theory
Contingency theory proposes that no best practice is universally applicable. Firm differences are due to contextual contingencies in the firm environment. The role of management, according to contingency theory, is that of choosing strategies appropriate for their unique situation (Ketokivi, 2006). Managerial choice in strategy is the means by which a firm can control its environment (Doty, Glick, & Huber, 1993). Superior firm performance is associated with the firm whose strategies enable the best fit with their contextual contingencies (Lawrence & Lorsch, 1967). Insights into firm differences can therefore be gained by looking at the effect of contextual differences on various strategies (Hofer, 1975).
The impact of supply chain risk management on firm performance varies so we use contingency theory to investigate contextual differences affecting that relationship. We explore integration, firm culture, industry clockspeed and disruption types as potential moderators of the relationship between supply chain risk management and firm
performance.
Integration
Wallenburg (2013) found that it is the relational aspect of information sharing that is more important than integration. Alternatively, visibility of information has been cited as the most beneficial. Lack of visibility to supplier information resulted in capacity related disruptions hampering the ability to grow the business (Panchak, 2013).
Network collaboration and coordination could help predict and identify capacity constraints. Collaboration has been defined as a mutual process of shared understanding and vision to integrate resources for accomplishing shared goals (Richey, Adams, & Dalela, 2012). Thus, collaboration and coordination by all network partners is necessary in order to be effective. This requires a match in understanding, needs and capabilities and makes achieving collaboration so challenging (Richey et al., 2012). Collaboration has been found to enable the coexistence of both cooperation and competitive behavior which enabled greater information sharing simultaneously with greater vigilance towards opportunism (Majchrzak, Jarvenpaa, & Bagherzadeh, 2014).
Bridging is a similar term for comprehensive boundary spanning actions which link firms with an exchange partner. Boundary spanning actions attempt to reduce information uncertainty (Bode et al., 2011). These linkages have been shown to improve visibility, agility, supply chain performance, and mediate supply chain risk (Barratt & Oke, 2007; Brandon‐Jones et al., 2014; Christopher, 2000; Mabert & Venkataramanan, 1998).
Integration in moderate levels is expected to enable collaborative supplier relations, facilitate information sharing and visibility, thereby reducing uncertainty of supplier risks. We hypothesize, however, an inverted U shaped relationship. Insufficient levels of
expected to hamper the ability of supply chain risk management to improve firm
performance. Low levels of integration lack the joint coordination necessary for efficient and effective response to disruption (Scholten & Schilder, 2015). Likewise, very high levels of integration may create excessive supplier dependencies and rigidities reducing the flexibility and agility of supply chain risk management. In fact, Villena, Revilla, and Choi (2011) found an inverted U shape in buyer-supplier relationships. Very high levels of integration are expected to hamper the ability of supply chain risk management to improve firm performance.
H5: Integration has a moderating relationship between supply chain risk management and firm performance.
H5a: Moderate levels of integration will have a positive moderating effect on the relationship between supply chain risk management and firm performance.
H5b: High and low levels of integration will have a negative moderating effect on the relationship between supply chain risk management and firm performance.
Organizational culture
Organizational culture partly determines the flexibility, responsiveness and agility which organizations utilize to mitigate and respond to supply chain disruptions
(Braunscheidel & Suresh, 2009). For example, firms may focus supply chain risk
management on key suppliers as opposed to balancing efforts across more regularly used low cost commodities (Simchi-Levi et al., 2014).
(Blackhurst et al., 2011; Christopher & Peck, 2004; Sheffi, 2005). This requires commitment from leadership encouraging change capabilities and innovation and has been
demonstrated to impact firm performance (Akgün & Keskin, 2014; Ates & Bititci, 2011; Camisón & Villar López, 2010; Demmer, Vickery, & Calantone, 2011; Golgeci & Ponomarov, 2013). Similarly, culture can impact the valuation of tradeoffs between investment in flexible capabilities and their associated costs which is critical in determining the level of commitment toward supply chain risk management (Christopher & Holweg, 2011; Elkins et al., 2005; Kamalahmadi & Parast, 2016).
Other capabilities the organization has committed to develop can also influence supply chain risk management such as the ability to process information, continuously improve and innovativeness (Elkins et al., 2005; Skipper & Hanna, 2009). In fact, Fine (2000) argues that the capabilities a firm chooses to develop is the most important competitive strategy. Senge (1999) argues that unless organizations have the motivation and capacity to change they will not address deeper issues and crises will be repeated. Similarly, organizational culture can impede collaboration (Richey et al., 2012). Motivation and capability to change stem from cultural norms about appropriate levels of risk and spending (Senge, 1999; Zsidisin & Wagner, 2010). Leadership commitment is required for effective implementation (Durach et al., 2015).
Decentralized firms with excess capacity experience shorter internal capacity related disruptions and develop fewer prevention capabilities (Kim & Tomlin, 2013) which may make them more vulnerable to supplier related disruptions. In fact, they suggest that decentralized firm cultures are more tolerant of exposure to externally related disruptions as they perceive diffused responsibility and involvement.
In summary, organizational culture has the capacity to affect strategies, capability development, norms, and leadership commitment. The influence of various organizational cultures has the ability to strengthen or weaken the ability of supply chain risk
management to effect firm performance.
H6: Organizational culture types a) centralization b) continuous improvement c) flexible d) innovation e) learning and f) supply chain risk management have a positive moderating relationship between supply chain risk management and firm performance.
Industry clockspeed
The industry environment influences the strategies of firms competing in that environment (Fine, 1998). Clockspeed is an environmental characteristic described as the industry rate of product, process, and structural change (Fine, 1998). Industry rate of change includes both internal and network partners. Product change is the pace of new product introductions and technological innovation. Process change includes lean
Supply chain risk management is impacted by contingencies in environmental characteristics (Kleindorfer & Saad, 2005). The relationship between customers and suppliers increases with higher rates of industry clockspeed and improves performance (Chavez, Gimenez, Fynes, Wiengarten, & Yu, 2013). Inventory buffers are used more frequently in higher clockspeed industries (Meijboom, Voordijk, & Akkermans, 2007). Likewise, lean practices were found to be efficient and have a positive impact on flexibility under conditions of low clockspeed (Meijboom et al., 2007).
Managers often use industry clockspeed to benchmark the acceptable level of firm change (Carrillo, 2005). The planned rate of mitigation, however, may not be appropriate for the rate of change required during a disruption (Greening & Rutherford, 2011). If the industry pace of change outpaces firm adaptation capability, it will be less likely to successfully recover from disruptions.
High industry clockspeed introduces higher rates of change into the supply chain environment. Higher rates of change in a supply chain network corresponds with more turbulence and vulnerability to supply chain disruptions. Turbulence can negatively impact supplier relations, require higher safety stocks and make lean practices inefficient. Higher turbulence requires greater adaptive capabilities of supply chain risk management.
H7: High industry clockspeed has a negative moderating relationship between supply chain risk management and firm performance.
Disruption classification
catastrophic risks are both less frequent and more severe. Wagner and Bode (2008) found catastrophic events to have an insignificant impact on supply chain performance and suggested focusing on the more frequent “every-day” supply chain disruptions which are more significant to supply chain performance. “Every-day” supply chain disruptions are more commonly associated with issues regarding demand uncertainty (Kleindorfer & Saad, 2005).
High and low impact disruptions have been shown to impact firms differently. While effective resource management may mitigate low impact disruptions, high impact
disruptions require the capability to quickly adapt and reconfigure resources (Ambulkar, Blackhurst, & Grawe, 2015). Catastrophic disruptions, therefore, are expected to have a negative effect because most supply chains are designed for efficient “every-day” operation and lack the capabilities to quickly adapt (Christopher & Holweg, 2011; Hendricks &
Singhal, 2005; Sáenz & Revilla, 2014). In fact, Greening and Rutherford (2011)
operationalize disruption by the development of a post event change in network structure. H8: Severe (a) and uncontrollable source (b) disruption types have a negative moderating relationship between supply chain risk management and firm performance.
2.3Method
for and gather studies 2) extract and code information from studies and 3) apply meta-analysis to the extracted information.
2.3.1 Selection process
The search process gathered studies through a Thomas Reuter’s Web of Science all database search. Due to an interest in being comprehensive and inconsistencies in
determining quality, all journals were included, not just the upper echelon (Lipsey & Wilson, 2001). No time constraints were imposed. The following search terms were used: “supply chain agility”, “supply chain disruption”, “supply chain flexibility”, “supply chain glitch”, “supply chain disruption recovery”, “supply chain mitigation”, “supply chain resilience”, “supply chain resiliency”, “supply chain risk”, “supply chain robustness”, and “supply chain vulnerability”. A dissertation search was conducted in ABI Inform. Manual searches were also conducted by reviewing citation lists and related meta-analyses on supply chain integration and flexibility. The compiled search returned an initial sample size of 1,221 studies.
The first step of the selection process was paper availability. Due to the inclusion of all journals, 68 papers were unable to be located with the aid of interlibrary loan library services.
All available studies were reviewed for the content. We removed 1,049 papers which had no empirical data on the constructs and relationships of interest. This eliminated simulations, patents, meta-analysis, multivariate analysis, conceptual
risk management antecedents which related directly to firm performance and not supply chain risk management. This resulted in 104 plausible studies.
It is the standardization from using a common effect size statistic which allows for the meta-analysis because they are interpretable in a consistent fashion. The pooled estimate provides greater statistical power than the individual studies. Therefore data were scrutinized closer for common data. Only correlational data or data convertible to r were considered. Studies were required to contain the number of participants so that effect sizes could be weighted. Reliability data is needed to correct for sampling and
measurement error. Common data requirements eliminated 17 studies.
Four redundant studies were also rejected. When dissertations or conference proceedings were later published in a peer reviewed journal, the journal paper was retained and the earlier work eliminated. A sample size of 83 were coded.
Correction for artifacts cannot be conducted on single papers. Therefore, if a relationship was expressed in only one study, those relationships and corresponding studies were excluded. This final selection step disqualified another 41 studies. The final sample size was reduced to 42. The sample selection results are displayed in table 1. Great care was taken to capture all relevant studies and any omission is unintentional.
Table 1: Sample Selection
2.3.2 Coding of variables
The second meta-analysis step was to extract coded variables from the remaining studies which pertain to the research question and possessed the necessary data. These descriptive statistics can then be combined to reveal essential relationships of accumulated data. A total of 395 item level variable codes were initially created. Two categorical
variables were created for industry and country.
Individual items were aggregated represent broader, related constructs. These broader constructs enable greater generalization than the context specific individual studies. The coding protocol was performed jointly by two authors with subject matter expertise. In the occasion when an items name and operationalization resulted in two different categorizations, the actual measurement was used for coding. This reduced the constructs to 106 unique aggregate variables. Supply chain risk management performance
Data Plausibility
•1,221 Initial sample size •(68) Unavailable papers
•(1,049) Lack of empirical data on constructs of interest
Data Commonality
•104 Plausible papers
•(17) Lack of participant numbers, correlational or data convertible to r, and reliability data
•(4) Redundant papers
Data Sufficiency
•83 Unique papers with data
was conceptualized as supply chain risk, resilience, robustness and disruption management performance. Disruption management was operationalized as frequency of disruption and negative impact. Since disruption management was operationalized as a negative
[image:35.612.75.448.258.721.2]relationship it was reverse coded to aggregate with the other positive relationships. Firm performance was conceptualized as firm, market and profit performance. Table 2 lists the papers used and which aggregations were created.
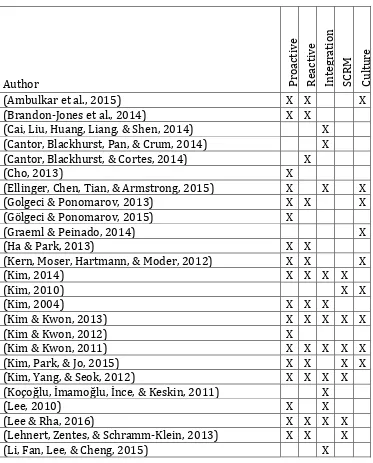
Table 2. Papers Used In Meta-Analysis
Author Pro
act ive Rea ctive Int egr at ion SC RM Cultu re
(Ambulkar et al., 2015) X X X
(Brandon‐Jones et al., 2014) X X
(Cai, Liu, Huang, Liang, & Shen, 2014) X (Cantor, Blackhurst, Pan, & Crum, 2014) X (Cantor, Blackhurst, & Cortes, 2014) X
(Cho, 2013) X
(Ellinger, Chen, Tian, & Armstrong, 2015) X X X
(Golgeci & Ponomarov, 2013) X X X
(Gölgeci & Ponomarov, 2015) X
(Graeml & Peinado, 2014) X
(Ha & Park, 2013) X X
(Kern, Moser, Hartmann, & Moder, 2012) X X X
(Kim, 2014) X X X X
(Kim, 2010) X X
(Kim, 2004) X X X
(Kim & Kwon, 2013) X X X X X
(Kim & Kwon, 2012) X
(Kim & Kwon, 2011) X X X X X
(Kim, Park, & Jo, 2015) X X X X
(Kim, Yang, & Seok, 2012) X X X X
(Koçoğlu, İmamoğlu, İnce, & Keskin, 2011) X
(Lee, 2010) X X
(Lee & Rha, 2016) X X X X
(Lehnert, Zentes, & Schramm-Klein, 2013) X X X
Table 2 continued
(Merschmann & Thonemann, 2011) X X
(Park, 2011) X X X
(Riley, 2013) X X X X X
(Rosenzweig, Roth, & Dean, 2003) X
(Sanchez Torres, 2012) X X X
(Shao, 2013) X X X
(Su, 2011) X
(Sylla et al., 2014) X
(Viswanathan, 2011) X X
(Voss & Williams, 2013) X X
(Wagner & Bode, 2008) X
(Wieland & Wallenburg, 2012) X X X
(Wieland & Wallenburg, 2013) X
(Yang, 2014) X
(Yang, Wu, & Li, 2009) X X X
(Zhao, Huo, Sun, & Zhao, 2013) X
(Zsidisin & Wagner, 2010) X X
2.3.3 Meta-analytic procedure
The third step applied the meta-analytic procedure to the extracted and coded information. The Hunter and Schmidt method progressively makes corrections for
The Hunter and Schmidt method utilize these measures over significance testing which does not describe if the variance is large enough to worry about or distinguish between variance due to uncorrected artifacts or moderators. Moderator variables were analyzed by a Chi-Square test for systemic variation and the 75% rule of thumb. Error variances explained by artifact correction < 75% are considered to indicate missing moderators (Hunter & Schmidt, 2004). Formulas are displayed in table 3.
Data were first manually analyzed with Excel to become familiar with the detailed data. Then, established scripts (Field & Gillett, 2010) of the Hunter and Schmidt method were run through SPSS for effect size estimates and magnitude of differences for
moderator analysis. Study output results in a population estimate and both credibility and confidence intervals.
Analysis was conducted in three stages. The first stage analyzed items relating to supply chain risk management performance. The second stage analyzed supply chain risk management performance to broader firm performance outcomes. The third stage
[image:37.612.76.469.572.711.2]conducted subgroup analysis with a random effects regression analysis and chi square test for potential moderators.
Table 3. Meta-Analysis Formulas Correction for Sampling Error:
Weighted Mean Effect Size (r̅w)
Total Observed Variance
Table 3 continued
Residual Population Variance
Upper and Lower Credibility Intervals
Correction for Measurement Error: Attenuation Factor
A = Corrected Estimated Population Mean (r̅c)
Corrected Standard Deviation of Population Correlation
Upper and Lower Confidence Intervals
Measurement Error Variance S22 = Var(r̅c*A) Moderator Identification:
Explained Variance ((σ2e+ S22)/S2r̅) * 100%
Chi-Square Homogeneity
2.4 Results
For each meta-analysis we present the following results: the number of independent samples (k), uncorrected sample-weighted mean effect size (r), the combined total sample size (n), corrected effect size (ρ), credibility intervals using standard deviation (CV),
than 0.4 are largely significant (Cohen, 1977, 1988). Credibility intervals express
magnitude of the population variance and indicate there is an 80% chance the mean lies within the interval. Wider CVs are less reliable. Confidence intervals reflect precision of the mean and indicate the range of the mean true score. Intervals containing zero are
considered to potentially have a true mean effect of zero and are therefore not supported. Explained variances above 75% are generally considered free from large moderator effects (Hunter & Schmidt, 2004). Those less than 75% indicate that other variables contributing to outcomes are missing. Most of the relationships in this study have %ARTV less than 75% suggesting that more complex relationships should be studied in the future.
2.4.1 Paradox or tradeoff
The division of capabilities to proactive or reactive strategies was made according to previous work utilizing that classification. These studies are summarized in table 8
Table 4. Proactive and Reactive Effects on Performance
Proactive (ρ = .461) and reactive (ρ = .413) correlations have about the same effect on supply chain risk management performance. This would indicate that neither is
preferable to the other but both can have a positive effect on supply chain risk management performance. Additionally, a regression analysis (β= .416) indicates that the relationship between proactive and reactive strategies are positive (table 5). This indicates they are not tradeoffs, but together both contribute to supply chain risk management performance. Therefore, hypothesis 4a is not supported. Consistent with paradox theory, hypothesis 4b is supported.
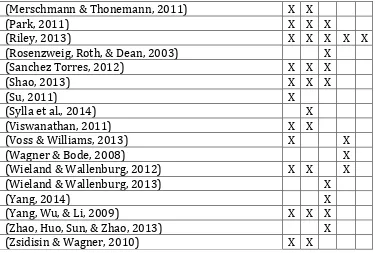
Table 5. Proactive and Reactive Regression Analysis
The credibility intervals are also very similar and nearly overlap (CV = .26-.51 & .24-.49) indicating a lack of distinction between the two groups. Lack of discriminant validity is further supported by the poor model fit of the regression analysis, in table 5 (p = .272, p = .161, p = .625). P values of .00 - .01 are generally considered desirable (Griffeth, Hom, & Gaertner, 2000; Kong, Dirks, & Ferrin, 2014). One reason for the striking similarity between proactive and reactive is that many capabilities have been operationalized as proactive by some authors and reactive by others. Capabilities classified as both: agility, collaboration, communication, flexibility, redundancies, supplier development and visibility. This can be
Bivariate Antecedent Relationships with SCRM Performance
k N r ρ Lower
80% CV Upper 80% CV
Lower 95% CI
Upper
95% CI % ARTV
Proactive strategies with SCRM performance 105 18,124 0.383 0.461 0.26 0.51 0.18 0.75 10.7 Reactive strategies with SCRM performance 55 10,266 0.361 0.413 0.24 0.49 0.09 0.75 7.5
[image:40.612.72.544.440.495.2]observed from the summary of past classifications (table 8.) Proactive strategies have been considered to be both capabilities to prevent supply chain disruption but also capabilities to reduce the impact of a disruption (Grötsch, Blome, & Schleper, 2013). Likewise, reactive strategies can be implemented before a disruption (Grötsch et al., 2013). Analysis revealed that capabilities classified as dual had a stronger effect size than either exclusively
[image:41.612.74.539.296.367.2]proactive or exclusively reactive capabilities (ρ= .475>). Firms may benefit most by focusing on dual capabilities.
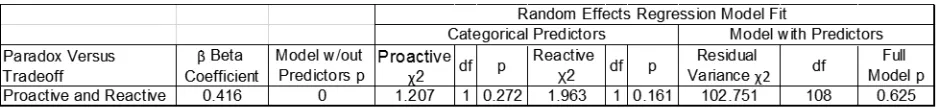
Table 6. Dual Capabilities Based Upon SCRM Process
We argue that although the proactive and reactive classification has been a popular description of supply chain risk management capabilities (Grötsch et al., 2013), it may hamper progression of the field due to its lack of clarity and distinction. The fact that many variables overlap probably contributes to the synergistic nature of supply chain risk management. For example, supplier communication is likely to enable many firm capabilities such as cost and lead time reductions, and new product manufacturability. Although effect sizes are similar, we have studied proactive capabilities significantly more than reactive. Therefore, more research in responses to disruption would be important. The variance explained by most of the artifacts is less than 25% which indicates low heterogeneity and a large degree of unidentified potential moderators.
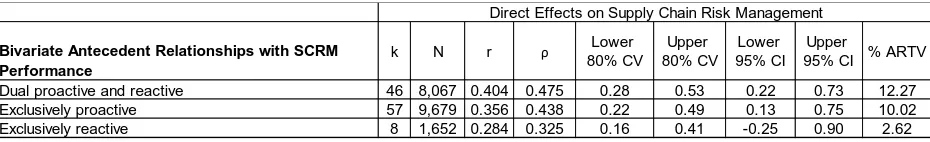
Results in table 7 indicate that supply chain risk management strategies have a large and positive effect on business performance (ρ=.393) providing support for hypothesis 3.
Bivariate Antecedent Relationships with SCRM Performance
k N r ρ Lower
80% CV Upper 80% CV
Lower 95% CI
Upper
95% CI % ARTV
Dual proactive and reactive 46 8,067 0.404 0.475 0.28 0.53 0.22 0.73 12.27 Exclusively proactive 57 9,679 0.356 0.438 0.22 0.49 0.13 0.75 10.02 Exclusively reactive 8 1,652 0.284 0.325 0.16 0.41 -0.25 0.90 2.62
Surprisingly, however, the association with overall business performance (ρ= .393) was stronger than the association with supply chain performance (ρ = .243). These results suggest that supply chain risk management enables the avoidance of firm losses resulting in greater overall business performance. Firms cannot operate when the flow of products or services is interrupted. This positions supply chain risk management as a strategic core competency providing more value to the firm than to supply chain performance alone. This further supports the paradox theory of cumulative benefits of supply chain risk
management capabilities. The almost perfect degree of variation attributed to the artifact (98.9% ARTV) likely indicates that supply chain performance is consistently
operationalized across studies such as on time delivery. The fact that the effect size was moderate (ρ= .243) may indicate that on time delivery is an insufficient metric for
explaining supply chain performance. For example many inefficiencies can be accrued in perfecting on time delivery.
[image:42.612.74.556.560.689.2]Table 7: Supply Chain Risk Management With Performance
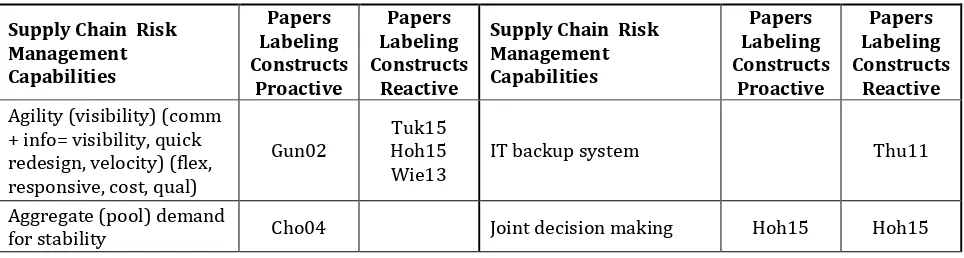
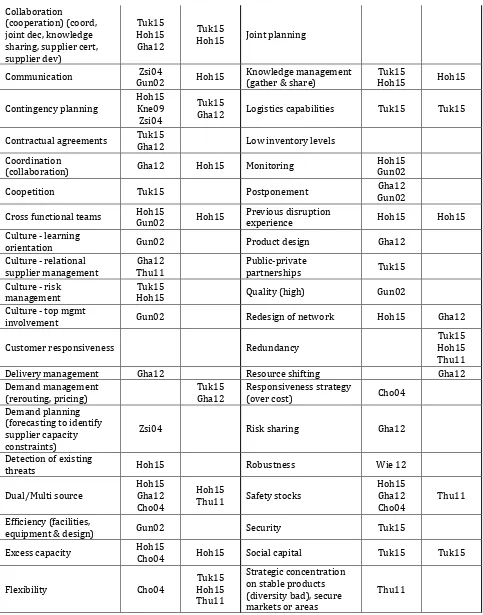
Table 8. Proactive and Reactive Classification
Supply Chain Risk Management Capabilities Papers Labeling Constructs Proactive Papers Labeling Constructs Reactive
Supply Chain Risk Management Capabilities Papers Labeling Constructs Proactive Papers Labeling Constructs Reactive Agility (visibility) (comm
+ info= visibility, quick redesign, velocity) (flex, responsive, cost, qual)
Gun02 Tuk15 Hoh15
Wie13 IT backup system Thu11
Aggregate (pool) demand
for stability Cho04 Joint decision making Hoh15 Hoh15
Bivariate Antecedent Relationships with SCRM Performance
k N r ρ Lower
80% CV Upper 80% CV Lower 95% CI Upper
95% CI % ARTV
SCRM performance with Business performance 9 2,175 0.354 0.393 0.24 0.46 0.17 0.61 11.6 SCRM performance with SC performance 5 1,440 0.201 0.243 0.09 0.31 0.23 0.25 98.9
Table 8 continued
Collaboration
(cooperation) (coord, joint dec, knowledge sharing, supplier cert, supplier dev)
Tuk15 Hoh15 Gha12
Tuk15
Hoh15 Joint planning
Communication Gun02 Zsi04 Hoh15 Knowledge management (gather & share) Hoh15 Tuk15 Hoh15
Contingency planning Hoh15 Kne09 Zsi04
Tuk15
Gha12 Logistics capabilities Tuk15 Tuk15
Contractual agreements Tuk15 Gha12 Low inventory levels
Coordination
(collaboration) Gha12 Hoh15 Monitoring Hoh15 Gun02
Coopetition Tuk15 Postponement Gha12 Gun02
Cross functional teams Hoh15 Gun02 Hoh15 Previous disruption experience Hoh15 Hoh15 Culture - learning
orientation Gun02 Product design Gha12
Culture - relational
supplier management Thu11 Gha12 Public-private partnerships Tuk15
Culture - risk
management Tuk15 Hoh15 Quality (high) Gun02
Culture - top mgmt
involvement Gun02 Redesign of network Hoh15 Gha12
Customer responsiveness Redundancy Hoh15 Tuk15
Thu11
Delivery management Gha12 Resource shifting Gha12
Demand management
(rerouting, pricing) Tuk15 Gha12 Responsiveness strategy (over cost) Cho04 Demand planning
(forecasting to identify supplier capacity constraints)
Zsi04 Risk sharing Gha12
Detection of existing
threats Hoh15 Robustness Wie 12
Dual/Multi source Hoh15 Gha12 Cho04
Hoh15
Thu11 Safety stocks
Hoh15 Gha12
Cho04 Thu11
Efficiency (facilities,
equipment & design) Gun02 Security Tuk15
Excess capacity Hoh15 Cho04 Hoh15 Social capital Tuk15 Tuk15
Flexibility Cho04 Tuk15 Hoh15
Thu11
Strategic concentration on stable products (diversity bad), secure markets or areas
Table 8 continued
Flexible labor Gun02 Hoh15 Supplier certification Hoh15 Thu11
Zsi04 Hoh15
Flexible multipurpose
machinery Supplier development
Tuk15 Hoh15 Gha12 Thu11 Zsi04
Hoh15
Flexible order fulfillment Supplier dispersion (multiple locations) Hoh15
Flexible manufacturing Gun02 Hoh15 Supplier evaluations Zsi04
Flexible mix Supplier selection Tuk15 Thu 11
Flexible supply base
(switching) Hoh15 Supply chain network design Tuk15
Flexible logistics Hoh15 Sustainability compliance Tuk15
Flexible volumes Hoh15 Temporary alliances Gun02
Identify & assess
vulnerabilities Kne09 Training & education Hoh15 Gun02 Hoh15
Information sharing (quality, relevance)
interpretation? Hoh15 Transparency (RFID) Thu11
Innovativeness Tuk15 Velocity (speed) Hoh15
Integration Gun02 Visibility (demand & inv) (comm & info sharing) Tuk15 Hoh15
Inventory management Tuk15 VMI Gha12
IT use Tuk15 Gun02 Tuk15 What if analysis scenarios Zsi04 Gha12
2.4.2 Potential moderators
Integration
exchange of data including databases and aligned goals. Combined integration was coded as integration, communication, collaboration and information sharing. None of the
relations explained more than 75% of the variation, indicating that there are potential moderators excluded. Table 9 provides detail for aspects of integration as potential
moderators. The greatest effect was found between integration and both supply chain risk management (ρ= .687) and supply chain performance (ρ = .546). This is consistent with findings from Flynn et al. (2010) that all of the dimensions of integration must be
considered together because they each impact performance in a different way. Significant positive relationships were also found between overall factors such as combined
integration and combined performance (ρ= .487) as well as more detailed factors of collaboration and supply chain risk management (ρ= .53). Collaboration was commonly defined as developing and executing plans and by relational variables such as teamwork, confidence, and trust. Collaboration had the greatest effect on supply chain risk
management, supply chain and business combined performance (ρ= .572). This is likely due to the ability of collaboration to impact other aspects of the business besides supply chain risk management. Information sharing had smaller effects than either collaboration, integration or the combination of factors. The operationalization for information sharing included communication but emphasized a constant flow of data. There was insufficient data to test communication. Despite the difficulty in distinguishing collaboration and integration, they provide value to the firm above and beyond their relationship with supply chain risk management. This provides further support for firm synergies of risk
Table 9. Integration
Organizational culture
Data was insufficient to test hypothesis 6 as a moderator, however, data was
available to test direct effects. Not surprisingly, a culture of supply chain risk management is the strongest relationship to supply chain risk management performance (ρ = .651). Combining supply chain and innovation cultures had an effect second only to supply chain risk management (ρ = .481) with no interval containing zero (CV = .33 - .53; CI = .29 - .67). This suggests that a culture of supply chain innovation may be an enabler of supply chain risk management. This is consistent with findings by Akgün and Keskin (2014) that innovativeness moderates the relationship between resilience and firm performance. Cultures associated with lean (learning, innovation and supplier relations) (Bortolotti, Boscari, & Danese, 2015; Dodgson, 1993) also had a strong effect on supply chain risk management (ρ = .439). This is interesting given that the low redundancies associated with lean have often been framed as a tradeoff with supply chain risk management (Ghadge et al., 2012; Tukamuhabwa et al., 2015; Wagner & Neshat, 2010). These findings indicate that other firm cultures to enable supply chain risk management. Consistent with paradox theory, this could be due to cumulative properties.
Bivariate Relations with Integration and Performance
k N r ρ Lower
80% CV Upper 80% CV
Lower 95% CI
Upper
95% CI % ARTV
Integration with SCRM Performance 8 1,637 0.564 0.687 0.47 0.66 0.55 0.83 22.2 Integration with SC Performance 7 1,690 0.43 0.546 0.33 0.55 0.35 0.74 17.0 Combined integration with SCRM Performance 19 3,619 0.451 0.540 0.34 0.56 0.32 0.76 13.8 Collaboration with SCRM Performance 4 538 0.455 0.530 0.32 0.59 0.47 0.59 72.0 Combined integration with SC Performance 11 2,176 0.402 0.505 0.28 0.52 0.21 0.80 9.9 Combined integration with Firm Performance 13 2,883 0.377 0.432 0.26 0.49 0.09 0.77 5.9 Information Sharing with SCRM Performance 7 1,444 0.322 0.385 0.20 0.44 0.24 0.53 29.3 Information Sharing with Firm Performance 4 944 0.254 0.066 0.13 0.37 -0.03 0.60 7.6
Firm culture is a moderator of supply chain risk management and should be explored further in future work. Future research in this area could help identify more synergies and moderators of supply chain capabilities. In addition to the limited number of cultural variables noted here, there may be other cultural variables moderating the
[image:47.612.73.543.297.384.2]relationship of supply chain risk management and performance such as continuous improvement, decentralization, empowerment, flexibility, leadership involvement or risk tolerance.
Table 10. Organizational Culture
Industry clockspeed
Although no relevant studies specific to industry clockspeed were found to test hypothesis 7, we have coded categorical industry control variables. Ten different dummy variables were created to represent various industries and an eleventh to represent mixed results from pooled industries. A random effects regression analysis was performed on the Fisher transformed means. Contrary to expectations, none of the models were improved by including the categorical variable industry. None of the p values for industry were in the desired range less than or equal to .05. One possible explanation is that many of the studies reported pooled results from all industries diluting the detail. Another possible explanation is that many disruptions could equally impact multiple industries. Examples include
natural disasters, port labor strikes, carrier bankruptcies or changes is trade regulations.
Bivariate Relations with Culture and Performance
k N r ρ Lower
80% CV Upper 80% CV
Lower 95% CI
Upper
95% CI % ARTV
SCRM Culture with SCRM Performance 4 810 0.565 0.651 0.47 0.66 0.35 0.96 5.1 Innovation and SC Culture with SCRM Performance 4 1,012 0.431 0.480 0.33 0.53 0.29 0.67 13.6 Learning, Innovation and Supplier Relations 9 1,265 0.36 0.439 0.22 0.50 0.24 0.63 25.4 Market and SC Culture with SCRM Performance 3 686 0.359 0.396 0.25 0.47 0.29 0.50 36.6 Innovation and Market Culture with SCRM Performance 7 746 0.28 0.349 0.10 0.46 0.26 0.44 72.2
Table 11. Industry and Country
Country additional analysis
Although not hypothesized we analyzed the available categorical information on country and found significant data (table 11). Similar to the industry data many studies ported results from pooled country data. Fourteen dummy variables were created to
represent the 13 specific countries and mixed data. Country codes with sufficient data to be analyzed individually are presented in table 12. Similar to industry data, we might expect insignificance due to dilution of aggregated data, however, Wowak, Craighead, Ketchen, and Hult (2013) found the relationship between supply chain knowledge and performance with data collected in multiple countries stronger than with data collected from a single country. Contrary to the meta-analysis conducted by Wowak et al. (2013), we found insignificant effects in the mixed country data.
A significant difference (table 11 ρ= .004) was found for country effects of proactive strategies effect on supply chain risk management performance. Interestingly given the similarities between proactive and reactive capabilities, there was no significance in reactive capabilities by country moderators (table 11 p = 0.078 > 0.05). This may indicate that there are very strong country differences in a firm’s ability to implement proactive risk management strategies. All capabilities were then combined and the effect of country
Chi Square Test for Homogeneity with Potential Moderators
Model w/out
Predictors p Country χ2 df p Industry χ2 df p
Residual
Variance χ2 df Full Model p
SCRM performance with Business Performance 0.000 1.3 3 0.718 0.2 1 0.694 7366.0 8 0.498
Proactive strategies with SCRM Performance 0.000 19.0 6 0.004 1.9 3 0.589 94.8 95 0.487
Reactive strategies with SCRM Performance 0.000 10.7 6 0.099 2.3 3 0.505 45.3 45 0.46
Flexible strategies with SCRM Performance 0.000 11.4 5 0.044 1.4 3 0.713 35.5 34 0.397
Combined integration with Combined Performance 0.000 6.9 6 0.332 4.9 3 0.178 37.4 35 0.358
Aggregate Practices with SCRM Performance 0.000 15.7 6 0.016 4.0 3 0.262 102.7 102 0.461
Model with Predictors Categorical Predictors
remained significant (p < 0.016). This indicates that dual capabilities not exclusive to one classification are significantly moderated by country.
Upon finding significance by country we analyzed country specific data. Results are shown in table 12. We isolated each country individually and compared aggregate practices to the rest of the countries. Although none of the models were a good fit with industry predictors, they had significant group differences between each individual country. The greatest significant effects were from Korea (ρ= .003), Germany (ρ= .005), the US and UK (ρ= .013) and China (ρ= .038). We also assess each individual country in one model. Similarly, the model was a poor fit, but the country differences were the most significant (p= 0.000).
Country differences could potentially be due to economic development, legal/regulatory, geographical or accessibility differences. Country differences were demonstrated in purchasing due to short/long term and individualist/collectivist
Table 12. Additional Country Analysis
Disruption types
Disruption type data was insufficient for moderation testing of both hypothesis 8a and 8b. Risk source disruption data were available for direct effects and results are summarized in table 13. They are classified according to a framework of controllable, partially controllable and uncontrollable sources for each internal and external risks (Wu, Blackhurst, & Chidambaram, 2006). Controllable sources of risk had a small effect, however it is unreliable as the confidence interval includes 0. Partially and uncontrollable sources had even weaker effect sizes and zero in both their credibility and confidence intervals.
When intervals contain zero it indicates that sometimes the relationship is positive and sometimes it is negative. Given the severity of differences in outcomes, it would be an important avenue of research to identify the moderator which determines the direction of effects. Future research should investigate potential contingencies which may result in differing direction of effects. For example, Brandon-Jones, Squire, and Van Rossenberg (2015) investigated the different placement of buffers to find that safety stock held at the supplier had positive effects on plant performance and disruptions while safety stock held at the plant had the opposite effects.
Chi Square Test for Homogeneity with Potential Moderators
Model w/out
Predictors p χ2 df p
Residual Variance χ2 df
Full Model p Aggregate Practices with SCRM Performance All Countries 0.000 35.7 5 0.000 125.5 126 0.496 Aggregate Practices with SCRM Performance & S Korea 0.000 8.6 1 0.003 131.9 130 0.437 Aggregate Practices with SCRM Performance & Germany 0.000 8.4 1 0.004 132.0 130 0.435 Aggregate Practices with SCRM Performance & US 0.000 6.2 1 0.013 136.0 130 0.341 Aggregate Practices with SCRM Performance & UK 0.000 6.2 1 0.013 140.1 130 0.257 Aggregate Practices with SCRM Performance & S Korea 0.000 4.5 1 0.035 137.3 130 0.313 Aggregate Practices with SCRM Performance & China 0.000 4.3 1 0.038 137.7 130 0.305 Aggregate Practices with SCRM Performance & Mix 0.000 3.7 1 0.056 136.8 130 0.324 SCRM with Business Performance 0.000 1.5 3 0.678 8.1 9 0.52
It is interesting that controllable and partially controllable sources of risk had a negative relationship with performance while uncontrollable sources had a positive relationship with performance. Although the results are unreliable and should be
[image:51.612.74.542.311.381.2]interpreted with caution, one explanation could be that firms successfully utilize buffers when they recognize uncontrollable risk more than they do for sources they feel they have some control over. Properly identifying risk is therefore likely a strong antecedent to successful supply chain risk management.
Table 13. Sources of Disruption
2.5 Discussion
2.5.1 Theoretical contributions
This study provides support for use of Paradox Theory in the domain of supply chain risk management. The paradox lens highlights the lack of distinctiveness in the common classification of proactive and reactive capabilities. An adequate classification is needed to develop new insight and progress the field of supply chain risk management.
We find dual capabilities of agility, collaboration, communication, flexibility, redundancy and visibility, to have the most significant effect on supply chain risk management. We also find the construct of integration to provide the largest effect on supply chain risk management of any single capability. This helps to resolve the conflict
Bivariate Relations with Integration and Performance
k N r ρ Lower
80% CV Upper 80% CV
Lower 95% CI
Upper
95% CI % ARTV
Controllable sources with SCRM SC performance 2 913 -0 -0.216 -0.30 -0.08 -0.48 0.05 9.4 Partially controllable sources with SCRM & SC performance2 1,520 -0.02 -0.027 -0.09 0.05 -0.14 0.09 20.8 Uncontrollable sources with SCRM & SC performance 4 3,040 0.043 0.051 -0.03 0.05 -0.05 0.15 24.0
effect of integration on supply chain risk and firm performance. This also points to the most significant variables to clearly operationalize and develop discriminant validity.
Contingency Theory provides the framework for applying contextual differences to broader theories. This study demonstrates that capabilities leading to supply chain risk management and firm performance vary by firm culture, country and many other
unidentified moderators. This study supports the contention of Contingency Theory that a blanket application of supply chain risk management capabilities cannot be prescribed for supply chain risk management performance, especially in a global context. While these contributions are significant, it is important to note the extent of unexplained moderators in the analysis. For example, relationships which contain zero in the intervals are
sometimes positive and sometimes negative. The contingencies which determine the direction of effect should be investigated as the outcome differences are significant.
Results also show the synergy created for overall firm performance by supply chain risk management, especially dual capabilities. The effect of supply chain risk management is stronger for firm performance than supply chain performance. The avoidance of
corresponding losses should be considered cost savings. Supply chain risk management should be given higher strategic priority.
2.5.2 Managerial implications
increase vulnerability. Reorienting firm culture to a resilience approach based on the joint management of tensions may result in firm competitive advantage. This is supported by the strong effect of a supply chain risk management to firm performance.
Based upon the correlations of integration with performance it would appear that the linkages between firms and suppliers may be as important as supply chain risk
management to performance. Global firms must select supply chain capabilities specific to each country. The benefits of supply chain risk management to firm performance will be more universal.
Firms may also find benefit in re-analyzing risk which they feel they have control or partial control over. Evidence suggests that firms may be overconfident in their ability to control supply chain risk. Additional strategic benefits may be found by incorporating a lean culture and supply chain innovation. Managers should not focus on actions to be taken in each step of the risk management process. We suggest a shifting perspective from action processes to decision making processes.
2.6 Limitations