Estimating spectral irradiance from measurements in seven
spectral bands
E.M. Rollin† and E.J. Milton
†NERC EPFS
School of Geography, University of Southampton,
Highfield Southampton
SO17 1BJ United Kingdom
E-mail: E.M.Rollin@soton.ac.uk, E.J.Milton@soton.ac.uk
Abstract
Accurate measurement and characterisation of fluctuations in the irradiance environment is important for many areas of optical remote sensing. This paper reports a method of estimating spectral irradiance over the VNIR region (400 - 1100nm) from the radiance of a calibrated reference panel, measured in seven narrow (10nm) spectral bands. Earlier work established the potential for estimating spectral irradiance from multi-band data using a neural network technique (Milton et al., 2000). The approach described here uses linear regression analysis to regenerate the irradiance spectrum from data in seven reference wavelengths. The method was tested using data from a specially designed multiband radiometer – the INdependent SPectral IRradiance Estimator (INSPIRE). The irradiance spectrum was partitioned into a number of distinct regions within each of which the spectral irradiance was estimated from irradiance measured at one of the reference wavelengths. The precision of the method was found to be better than ±5% over most wavelengths from 400nm to 1100nm. Furthermore, the slope coefficients of the individual regression models were found to be sensitive to the sky radiance conditions, especially over the region 600-760nm, and improvement in the precision of the predicted spectrum (to within ±3%) was obtained by taking the diffuse-to-global (D:G) irradiance ratio at the time of measurement into account.
1
Introduction
image acquisition and at a spectral resolution corresponding with that of the remote sensor, and for these purposes a simple, low-cost means of estimating the irradiance spectrum is very desirable.
The spectrum of incident global irradiance is dominated by the direct beam which is primarily a function of the solar spectrum, modified by absorption and scattering by atmospheric gases, water vapour and other aerosol particles. There is a high degree of autocorrelation in high spectral resolution measurements of irradiance, partly because of the measuring devices commonly used (CCD arrays) have spectral bandwidths broader than the spectral sampling interval. However, it is a characteristic of the global irradiance spectrum itself that systematic relationships exist between irradiance at different specific wavelengths. For example, previous work has found variation in the flux around the oxygen absorption feature at 762nm to correlate with variations around the atmospheric water vapour absorption feature around 940nm. In contrast, the flux around 880nm remains largely independent of these variations.
Earlier research has demonstrated the principle of using calibrated measurements in a small number of narrow, carefully positioned spectral bands in order to estimate the complete spectrum of global irradiance (Milton and Goetz, 1997, Milton et. al., 2000). In those ‘proof of concept’ studies, an artificial neural network technique was successful in estimating the full irradiance spectrum from data measured in seven narrow bands, for a range of sky conditions and for a single sensor data set. The aim of this work is to further validate the method using a separate, calibrated, seven-band device alongside a calibrated spectroradiometer. Whereas the earlier method was limited to use with the same multiband instrument as that used to derive the artificial neural network, the method described here is independent of the instrument as it relies upon absolute calibration.
The overall objective of the work is to develop a robust method of deriving the full irradiance spectrum from measurements obtained with a calibrated seven-band instrument. Such an instrument might then be routinely deployed for a wide range of remote sensing applications where irradiance measurements are required but no calibrated high spectral resolution instrument is available and to supplement field spectral measurement of reflectance.
2
Methodology
2.1
Phase 1- testing the linear regression model on single sensor data
The first phase of the research was to characterise the degree of correlation between (a) the spectral irradiance measured with the spectroradiometer at any given wavelength and (b) irradiance at each of the seven reference wavelengths. The bands selected for this work are positioned at: 430nm, 500nm, 780nm, 820nm, 830nm, 880nm and 950nm. These are referred to here as the reference wavelengths. Figure 1 shows the bands in relation to a spectrum of global irradiance.
least 80 spectra were obtained at a sampling interval of between 1 minute and 5 minutes and covering a period of between 30 minutes and 2 hours. Table 1 summarises the spectroradiometer data sets.
Each data set was dealt with separately, the raw spectra being initially calibrated to irradiance using instrument specific functions of calibration coefficients. In all cases the sensor was fitted with a cosine corrected hemispherical receptor which measured the incident irradiance flux directly and was calibrated to irradiance. All the sensor irradiance calibrations were derived by laboratory calibration against the EPFS in-house irradiance standard, an Optronics Laboratory 1000W FEL lamp, calibrated by the UK National Physical Laboratory (NPL). Data from the GER1500 and the ASD FieldSpec Pro were interpolated to 1nm after application of the irradiance calibration while those from the Spectron SE590 remained at the original sampling resolution of (nominally) 3nm.
0 200 400 600 800 1 00 0 1 20 0 1 40 0
3 00 4 00 5 00 6 00 7 00 8 00 9 00 1 00 0 1 10 0
S
pe
ct
ru
m
o
f G
lo
ba
l I
rr
ad
ia
nc
e
(m
W
m
-2 n
m
-1 )
W a ve le ng th (n m )
FIGURE 1 Reference band positions in relation to a spectrum of global irradiance.
Date Instrument/ Serial No Bandwidth/
Sampling Interval Interpolated to 1nm
21May99 Spectron SE590 / 2002 10nm/3nm
24July 01 ASDFieldSpec Pro / 6239 1.5nm
18June 02 GER1500 / 2003 1.5nm
28June 02 GER1500 / 2003 1.5nm
16April03 Spectron SE590 / 2002 10nm/3nm
29May03 Spectron SE590 / 2002 10nm/3nm
[image:3.612.152.449.260.508.2]16June03 Spectron SE590 / 2002 10nm/3nm
Once the data were calibrated, the irradiance values at the seven reference wavelengths were extracted from all the scans in each data set. Product moment correlation coefficients were then derived for the irradiance at each instrument channel against the irradiance measured in all seven reference wavelengths (Figure 2).
0.96 0.97 0.98 0.99 1
300 400 500 600 700 800 900 1000 1100 Simplified Correlation Spectrum
430nm 500nm 820nm C or re la tio n C oe ff ic ie nt Wavelength (nm) 0.96 0.97 0.98 0.99 1
300 400 500 600 700 800 900 1000 1100 Simplified Correlation Spectrum
780nm 830nm C or re la tio n C oe ff ic ie nt Wavelength (nm) 0.96 0.97 0.98 0.99 1
300 400 500 600 700 800 900 1000 1100 Simplified Correlation Spectrum
880nm 950nm C or re la tio n C oe ff ic ie nt Wavelength (nm)
FIGURE 2: Example of product moment correlation coefficient between irradiance at the spectroradometer wavelengths and irradiance at each reference wavelength for the single sensor data. The simplified correlation spectrum shown beneath identifies the spectral region where irradiance is generally most highly correlated with irradiance at the specified reference wavelength.
Comparison of the correlation spectra for all the data sets revealed a high degree of consistency in the pattern across dates and instruments. A simplified peak correlation spectrum was derived to summarise the dependence of irradiance at any specific wavelength on irradiance at one of the reference wavelengths (Figure 2).
[image:4.612.96.281.131.516.2] [image:4.612.323.505.137.306.2]seven reference wavelengths. Variation in the slope coefficient between dates are most marked in the region 600-760nm. This reflects the lower correlation coefficient found for that region (see Figure 2) in most data sets. Also, the wavelength at which the peak correlation changed from the 500nm band to the 820nm band also varied between data sets, so the use of the simplified correlation spectrum may be not be ideal for this region. Further work is planned to determine whether the changeover position is related to some other factor, for example sky radiance distribution.
0 0.5 1 1.5 2 2.5 3
30 0 4 0 0 5 0 0 6 0 0 7 0 0 8 0 0 90 0 1 0 0 0 1 1 0 0
2 4 Ju ly0 1 1 8 Ju n e 0 2 2 8 Ju n e 0 2 2 1 M a y9 9 1 6 A p ril0 3
2 9 M a y0 3
1 6 Ju n e 0 3
S
lo
pe
C
oe
ff
ic
ie
nt
W a v e len g th (n m )
FIGURE 3: Comparison of slope coefficients from seven dates for linear regression of irradiance at spectroradiometer wavelengths as a function of irradiance at the reference wavelength specified by simplified correlation spectrum.
2.2
Phase 2 – the seven band instrument
The second phase of the project was to apply the linear regression model to a separate multi-band instrument working alongside the spectroradiometer. A dedicated
instrument was designed and developed in-house. This instrument – the INdependent SPectral IRradiance Estimator (INSPIRE) – measures radiance in seven narrow spectral bands, positioned at the key reference wavelengths. The instrument uses seven silicon photodiodes fitted with narrow-band (less than 10nm FWHM) spectral filters. The operational version of the instrument functions as a radiometer, measuring the radiance of a calibrated Spectralon panel, with all seven bands recorded
[image:5.612.152.468.172.426.2]scan triggering and data logging for the seven band instrument was done via a Delta-T DL2e data logger.
Four data sets have so far been obtained using the INSPIRE in conjunction with a Spectron Engineering SE590 spectroradiometer. In all cases the SE590 sensor was fitted with cosine corrected hemispherical receptor to measure the incident irradiance flux synchronised with the seven band radiometer panel radiance measurements. Each data set includes at least 100 scans obtained at (nominally) 1 minute intervals over a period of at least 60 minutes.
Data processing was undertaken as follows. The SE590 data were calibrated to irradiance units by application of the calibration function. The INSPIRE data were initially calibrated to radiance, then a panel correction was applied to account for the spectral reflectivity of the Spectralon panel used. This factor varies with wavelength. The panel radiance values were then multiplied by π to obtain the equivalent incident irradiance flux value.
The radiometric calibration of both sensors was validated using a field technique. For all four data sets simultaneous measurement of the radiant flux of a calibrated Spectralon panel with a third instrument provided independent validation of the radiometric calibration of the INSPIRE data. On the 16 April 2003 a GER1500 sensor fitted with 3° field-stop was used, while on the other three dates a Spectron SE590 sensor fitted with 15° field-stop was used. Synchronised measurements with these sensors and the INSPIRE enabled normalisation of the seven band radiance data to those of the other system.
Three of the data sets (collected on 16 April, 29 May and 16 June 2003) were used to repeat the correlation and regression analysis described in section 3.1, but this time correlating the seven-band radiometer measurements (converted to irradiance) with the high spectral resolution irradiance data obtained with the spectroradiometer. The simplified correlation spectrum established in phase 1 and shown in Figure 2, was used to define the linear regression relationship between the irradiance at any given wavelength in the complete spectrum and that measured at the appropriate reference wavelength with the INSPIRE. The slope coefficients obtained for all three data series are presented in Figure 4.
0 0.5 1 1.5 2
30 0 40 0 50 0 60 0 70 0 80 0 90 0 10 00 11 00
16 A p ril03
29 M a y0 3
16 Ju n e0 3
S
lo
pe
C
oe
ff
ic
ie
nt
[image:7.612.155.474.66.329.2]W av eleng th (nm )
FIGURE 4: Slope coefficients for the relationship between spectral irradiance and irradiance measured at the reference wavelength with the INSPIRE instrument.
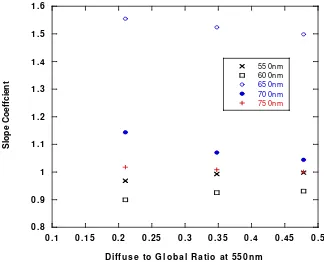
0.8 0.9 1 1.1 1.2 1.3 1.4 1.5 1.6
0.1 0 .15 0.2 0.25 0.3 0.35 0 .4 0.45 0.5
55 0n m 60 0n m 65 0n m 70 0n m
75 0n m
S
lo
pe
C
oe
ff
ci
en
t
D iffu se to G lob al R a tio at 55 0nm
FIGURE 5: Diffuse-to-Global ratio at 550nm measured with the spectroradiometer plotted against the slope coefficient at selected
[image:7.612.143.467.387.649.2]16April2003 29May2003 16June2003
[image:8.612.152.480.80.109.2]D:G at 550nm 0.21 0.48 0.36
TABLE 2 Diffuse-to-Global Irradiance Ratio at 550nm
2.3
Phase 3 – testing the empirically derived model
Results so far indicate that the empirically derived slope coefficients define the relationship between the seven band irradiance measurements and the irradiance spectrum (at the resolution of the spectroradiometer system). The validity of using the ‘common’ slope coefficient for predicting the irradiance spectrum was tested as follows. First, the mean slope for three data sets shown in Figure 4 was calculated. The mean slope values were then applied to a separate data set (the fourth series) obtained on 13 June 2003, to estimate the spectroradiometer irradiance spectrum from the irradiance measured simultaneously with the INSPIRE.
In addition, because Figure 5 suggests that the common slope coefficients include some sensitivity to the sky radiance distribution, the irradiance was estimated was using the slope coefficients for the ‘clearest’ day (16April 2003) and the ‘haziest’ day (29 May 2003). These are subsequently referred to as clear and hazy respectively. On 13 June 2003, atmospheric turbidity was very low with the D:G at 550nm measured as 0.15.
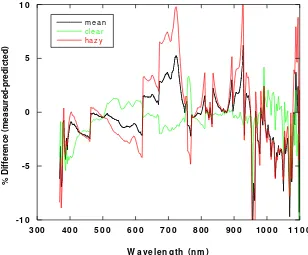
Results of applying then mean slope and the two extreme slope coefficients to the INSPIRE data collected on 13 June 2003 are shown in Figure 6 for a representative spectrum and in comparison to the irradiance spectrum measured with the spectroradiometer at the same time as the INSPIRE measurements. The percentage difference between measured and predicted was calculated according the Equation 1:
100 • −
measured predicted measured
(1)
0 500 1000 1500 2000
300 400 500 600 700 800 900 1000 1100
Measured Predicted Mean Predicted Clear Predicted Hazy
S
pe
ct
ra
l I
rr
ad
ia
cn
e
(m
W
m
-2 n
m
-1 )
[image:9.612.150.465.72.339.2]Wavelength (nm)
FIGURE 6: Measured and predicted irradiance spectrum from 13 June 2003. Prediction is based on mean slope coefficients for the three dates shown in Figure 5, the coefficient for the clear day and those for the hazy day.
-10 -5 0 5 10
30 0 4 0 0 5 0 0 60 0 70 0 80 0 90 0 10 00 1 1 0 0
m e a n
cle ar h a zy
%
D
iff
er
en
ce
(m
ea
su
re
d-pr
ed
ic
te
d)
W av elen g th (nm )
[image:9.612.151.459.418.673.2]3
Conclusions
Preliminary results from the newly-developed INSPIRE instrument indicate the viability of a method of estimating the full spectrum of global irradiance (over the VNIR wavelengths) from measurements obtained with a calibrated seven-band radiometer, and empirically derived slope coefficients. Using the mean slope coefficients derived from three separate days resulted in realistic estimates of the spectral irradiance collected with the INSPIRE on a different date. However, sensitivity of the slope coefficients to the sky radiance distribution meant that the best estimates of spectral irradiance (within ±3% of the measured value) were obtained by using slope coefficients derived under similar D:G conditions. This was especially true of the 600-760nm region. Future work planned for summer 2003 will, a) refine how the model incorporates sky radiance (D:G) information and b) improve field inter-calibration procedures, both of which are expected to significantly improve the accuracy of the retrieved spectrum as well as help establish the limits of the technique in terms of sky conditions.
4
Acknowledgements
The authors gratefully acknowledge the help of Bill Damon, who designed and constructed several prototypes of the INSPIRE instrument and, together with Karen Anderson and Sally-Beth Kelday, assisted with data collection. The support of Natural Environment Research Council for access to the spectroradiometers and calibration facilities is acknowledged. Thanks are due to GeoData Institute, University of Southampton for funding the development of the prototype INSPIRE instrument.
5
References
Milton, E.J., Emery, D.R. and Lawrance, D.J., 2000. A new dual beam technique for precise measurements of spectral reflectance in the field. International Symposium
on Remote Sensing of Environment, ERIM, Michigan, USA (CD ROM).
Milton, E.J. and Goetz, F.H., 1997. Atmospheric influences on field spectroscopy: observed relationships between spectral irradiance and the variance in spectral reflectance. Seventh International Symposium on Physical Measurements and
Signatures in Remote Sensing (ISPRS), Courchevel, France, 109-114.
Milton, E.J., Rollin, E.M. and Emery, D.R., 1995. Advances in field spectroscopy. In: