developed countries during the second half of the 20th Century but within these nations pronounced inequalities in perinatal mortality remain between different socio-economic groups (Antonovsky and Bernstein, 1977; Leon et al., 1992; Pensola and Valkonen, 2000). Research in the Irish context has also reported differentials. Based on data from the late 1980s, Nolan and Magee (1994) estimated that the unskilled manual socio-economic group (SEG) in Ireland had a 99 per cent higher risk of perinatal mortality compared to professional and intermediate non-manual groups. In the late 1980s when the data were collected Irish gross national product (GNP)2was less than 60 per
cent of the European average. Following a period of intense economic growth in the 1990s (the “Celtic Tiger” period) Irish GNP rose to over 110 per cent of the European average by 2006. Ireland was clearly a more affluent country in the latter period but had the earlier socio-economic differentials in perinatal mortality lessened with economic growth? The relationship between income inequality and infant mortality is very much debated. Several papers have presented evidence of a strong causal positive relationship with higher income inequality associated with higher infant mortality rates (Pritchett and Summers, 1996; Baird et al., 2007). This has been disputed by others such as Jamison et al. (2004) and Deaton (2006) who argue that the relationship actually reflects variables omitted from the analysis such as the quality of medical and social care services and level of female education. Whatever the cause of the relationship between income and infant mortality at the level of the state, there is a large amount of evidence that lower socio-economic position of mother is a risk factor for perinatal mortality at the individual level in richer countries (Leon et al., 1992). However, research does suggest that even in richer countries, higher income inequality within a society is associated with higher infant mortality (Waldman, 1992; Wilkinson, 1996; Marmot, 2004).
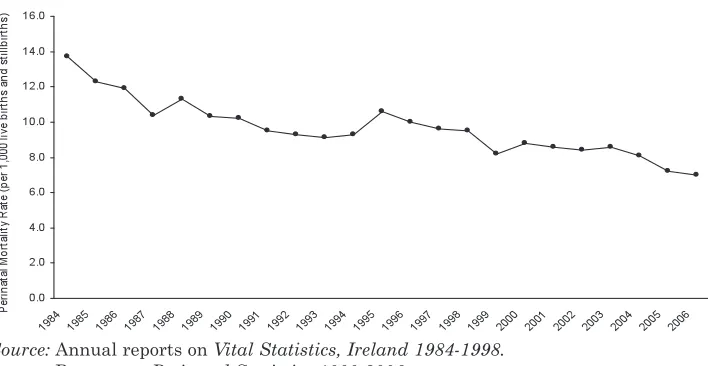
Analysis of household income data from Ireland for the period from 1987 to 2005 shows that overall household income rose by 349 per cent over the period with the incomes of the lowest income group rising by 343 per cent. Given that prices increased by 68 per cent over the same period this would suggest that real incomes rose significantly for all groups.3 Figure 1 shows
that income inequality between the bottom and top of the income distribution rose somewhat over the period (indicated by the increasing p90/p10 ratio)4
2GNP is used rather than GDP as Ireland has a particularly large proportion of domestic income repatriated as profit to overseas companies and organisations.
with the increase largely occurring before the period of growth in the 1990s. Inequality between the top and middle of the distribution actually decreased (the decreasing p90/p50) over the period of the boom.
Figure 1: Income Inequality in Ireland 1987-2005
So Ireland experienced both income growth across the total population and some increase in income inequality over the period from the late 1980s to the mid-2000s between the top and bottom of the income distribution but changes were small and actually occurred before the period of economic boom. These developments make Ireland over this period an interesting context within which to examine the impact of increasing affluence and inequality on perinatal mortality rates. If the attainment of a minimum standard of living/level of income impacts on perinatal mortality, perhaps via its influence on material environment, we might expect that growing Irish affluence may lessen socio-economic differentials as a growing proportion of the population reach this standard. On the other hand, if income inequality is a more powerful driver of differentials in mortality rates we may find relative stability in differentials or even increases between the 1980s and 2000s. In this paper we aim to measure trends in perinatal mortality differentials between socio-economic groups between the 1980s and 2000s.
We use data from the Irish National Perinatal Reporting System (NPRS) to examine developments in perinatal mortality. Nolan and McGee (1994) used data collected between 1984 and 1988 to examine perinatal mortality
Year
Ratio
1987 1994 2001 2005
4.5
4
3.5
3
2.5
2
1.5
1
0.5
differentials and we compare their findings to our own analyses using data from 1999–2006 to examine trends between the periods. Specifically, we examine whether differentials in perinatal mortality rates of babies born to fathers in different socio-economic groups changed between the two periods with particular reference to the outcomes of the unskilled manual and unemployed group relative to the professional group. The influence of mother’s age and parity will also be examined. We do not attempt to relate developments in Irish perinatal mortality rates to economic growth over the period or levels of inequality. Our aim is less ambitious and we aim simply to measure whether socio-economic differentials in perinatal mortality changed between the 1980s and 2000s.
Our task is made more complex by socio-demographic trends in Ireland between the two periods. As elsewhere in Europe, Ireland has witnessed a steep increase in cohabitation in recent decades. This means that an increasing proportion of women are not married at the time of their child’s birth. This should not be a problem for analysis but mothers who are not married are not required to provide information on the occupation of the father. This means that father’s SEG is significantly less likely to be captured in the Irish system if the mother is unmarried. This situation is exacerbated by the fact that women from the unskilled manual group are less likely to be married than women from other SEG groupings leading to a systematic bias in the data. We adopt a simulation approach to analyse socio-economic inequalities in perinatal mortality controlling for missing data. Comparisons between the 1980s are also complicated by the changing pattern of immigration to Ireland across the periods. Net outflows from Ireland in the late 1980s turned to net inflows of around 70,000 people a year by 2006 with migrants increasingly coming from Eastern Europe. We analyse SEG inequalities in mortality both with and without controls for mother’s nationality.
II DATA AND METHODOLOGY
The data used in this analysis have been compiled by the National Perinatal Reporting System (NPRS). The NPRS was introduced in the 1980s by the Department of Health and Children and since 1999 the collection, coding, processing and reporting of data has been the responsibility of the Health Research and Information Division at the Economic and Social Research Institute (ESRI). The NPRS collects administrative, demographic and clinical information on all births in the republic of Ireland. These data are collected as part of the birth registration system, whereby all births are registered and notified using a standard 4 part Birth Notification Form (BNF). Part 3 of this form is submitted to the NPRS. Linking the NPRS data collection to the birth registration process ensures complete coverage of all births. Unfortunately, only data from the point at which the NPRS system moved to the ESRI are available for analysis (1999-2006). This means that micro data from the 1980s are not available to us but detailed analyses of these data are available in a paper by Nolan and Magee (1994). Direct comparisons to differentials over the period 1984-1988 are made in this paper by replicating the analyses in Nolan and McGee (1994).
Following WHO guidelines, standard definitions of live birth, stillbirth and early neonatal deaths (death within the first week of life) are adopted here.5 To facilitate comparison to earlier findings, the same categories
employed by Nolan and Magee (1994) are replicated for mother’s age and parity and are as follows:
Mother’s age:Under 20, 20-24, 25-34, 35 years and over.
Parity (number of previous births):No previous births, 1 previous birth, 2 previous births, 3 or more previous births.
Traditionally, father’s occupation was used as a measure of socio-economic status as mother’s labour market participation rates were relatively low in Ireland. Mother’s occupation has been collected since 1999 by the NPRS but for comparison purposes to Nolan and Magee (1994), father’s occupation is used as the measure of socio-economic status here. Father’s occupation is coded and grouped following the Central Statistics Office system of Socio-economic Groups (SEGs) utilised by Nolan and Magee.6
5For the precise definitions employed see the Annual Report on Perinatal Statistics 2006 Appendix A. In line with WHO guidelines, births weighing less than 500 grammes are not included in the statistics.
The groups are as follows:
Father’s Socio-economic Group (SEG):
(i) Farmers, farm labourers and fishermen. (ii) Professional.
(iii) Intermediate non-manual. (iv) Skilled/semi-skilled manual. (v) Unskilled manual/unemployed.7
Following Nolan and McGee (1994) our analyses are restricted to singleton births only8and, since the number of perinatal deaths in any year is relatively
few (less than 400 stillbirths and 200 early neonatal deaths), we have made use of eight years of data from 1999 to 2006. Where information was missing on one of the independent variables, those cases were excluded from the analysis. Arising from this, 327,590 (70.2 per cent) of all singleton births reported to the NPRS over the period were available for analysis. There were 3,502 singleton perinatal deaths over the entire 1999–2006 period and 2,111 (60 per cent) are included in this analysis. Of these, 1,410 were stillbirths and 701 were early neonatal deaths.
The cases omitted from this analysis are not random; in fact 99 per cent of these were omitted on the basis of father’s occupation being missing. The high proportion of missing father’s occupation can be explained in part by the requirements of the birth registration process. If a mother records her marital status as anything other than married, father’s details are not mandatory for the registration process and are often, therefore, not provided. Roughly 30 per cent of mother’s in the period 1999-2006 did not record themselves as married and therefore were not obliged to provide father’s details. Within the NPRS system, father’s occupational status is designated as “not applicable” where a mother is not married and father’s details are not given. Since the 1980s there has been a substantial increase in the number of non-married mothers giving birth in Ireland which has ramifications for the comparability of this analysis. 7These consist of the following SEGs as defined by the CSO: (i) is SEG 0 farmers and farm managers and 1, other agricultural occupations and fishermen; (ii) is SEG 2 higher professional, and 3 lower professional; (iii) is SEG 4 employers and managers, 5 salaried employees, 6 intermediate non-manual workers, and 7 other non-manual workers; (iv) is SEG 8 skilled manual workers and 9 semi-skilled manual workers; and (v) is SEG 10 unskilled manual workers plus the unemployed in SEG 11. For the coding procedures followed by the NPRS please see the Annual Report on Perinatal Statistics 2006 Appendix C. It could be argued that SEG 4, employers and managers should be grouped with professionals in groups 1 and 2. However, for consistency with Nolan and McGee we group them with 5, 6 and 7.
As a result of the omissions, certain groups are under-represented within the data for 1999–2006. Just under 90 per cent of all cases where father’s SEG was missing were to single mothers. Younger mothers, who are predominantly single, are as a consequence, particularly under-represented, with only about 16 per cent of births to mother’s aged under 20 included. This must be kept in mind when interpreting the results, particularly as the perinatal mortality rate for the cases included in this analysis are less than the total for that age range.9Older mothers (35 years and over), were well represented with 86 per
cent of cases available in this age range. Unsurprisingly, first births are also under-represented in the analysis as a high proportion of first births are to single mothers. However, the problem is much less pronounced than with young mothers, with some 60 per cent of all first births available for analysis.
It is highly likely that the exclusion of births to women without a partner’s SEG from our analyses will impact on our results and specifically the differential between the unskilled/unemployed category and other SEG groupings. For example, whereas 8 per cent of women who are themselves higher professional are deemed not applicable in terms of partners’ class, this is true of 35 per cent of mothers who are unskilled manual and 65 per cent who are unemployed. Previous analyses for Ireland have shown that women with unskilled and unemployed partners have the highest risks of perinatal mortality (Nolan and Magee, 1994). Analyses for this paper show that women who are themselves registered as unskilled/unemployed are most likely to be unmarried at the birth of their child. Given this, it is highly likely that an increasing proportion of the women whose partners cannot be attributed an SEG come from the highest risk group which itself would lead to a decrease in the SEG differential over time.
Adjusting for Demographic Change
The extent of missing data on father’s SEG seriously hampers trend analysis. There are a number of approaches that could be taken to adjust for the problem that would allow comparisons. One approach would be to reweight those cases that remain so that the SEG composition of the data replicates the known population distribution. Whilst this may have some effect it cannot correct for the fact that the cases missing from the analysis may be systematically different from those who are included and thus may have a different level of risk. We showed above that the missing cases are more likely to come from higher risk groups (as indicated by mothers SEG) but given that they differ in terms of their propensity to marry, it may be that they
are also different in terms of their risk of perinatal mortality. In this case, reweighting existing cases would not correct for the underlying bias.
A second approach that could be used is direct data imputation at the individual level using regression analysis. This is standard practice in survey research where the predictors of a particular characteristic Y for cases where Y is known are used to predict the value of Y in cases where it is missing. This has the advantage that it produces values at the individual level that can then be used for analysis. Unfortunately, the number and type of variables in the NPRS data set makes it less than ideal for predicting father’s SEG.10Tests
showed that this approach introduced a significant degree of error into the adjustment process.
A third approach, and the one we adopt here, is an aggregate level approach based on simulation. Rather than attempting to estimate the missing father’s SEG group at the individual level, we simulate the impact on aggregate SEG differentials in perinatal mortality that would result if we were to reallocate cases missing father’s SEG group back into the data structure. To do this we need to estimate the “real” numbers of individuals in each father SEG group (the denominator) and the mean mortality risk for each SEG (the numerator). To estimate the denominator we reallocate cases where father’s SEG is missing according to the proportions observed in the cases where both mother’s and father’s SEG is known. For example, if 70 per cent of mother’s with a farming or agricultural occupation have a partner in the same SEG where both are known, we reallocate 70 per cent of cases where father’s SEG is unknown, but mother’s SEG is farming or agricultural. Once all cases where father’s SEG is missing are reallocated we have an estimate of the “true” distribution of father’s SEG.
We estimate the numerator (i.e. the risk of perinatal mortality) for cases where father’s SEG is unknown by regressing the probability of mortality on mother’s and father’s SEG including a category of “missing” father’s SEG. This “missing” SEG category is interacted with mother’s SEG to produce an estimate of the risk of perinatal mortality faced by these cases (conditional on age and parity). The risk of perinatal mortality where father’s SEG is known are drawn from the econometric analyses in Section IV.
The “adjusted” risk for each father’s SEG is thus the sum of the risks faced by the groups where father’s SEG is known and unknown. We can represent the adjusted SEG perinatal mortality rate as:
Yˆi =
(βFsegi* Ni) + ((βMsegi +βINTsegi)*σNi)Where Yˆi, the adjusted mortality rate for SEG i, is the sum of regression coefficients for father’s SEG i by number of cases in known father’s SEG i, (βFsegi*Ni) plus the sum of the fraction of “not applicable” cases reallocated to father’s SEG i(signified by sigmaNi) by the imputed coefficient for these cases which is estimated using the interaction of known mother’s SEG (βMsegi) with missing father SEG istatus (βINTsegi).
The Impact of Immigration
The NPRS has collected data on mother’s and father’s nationality since 2004. For the purpose of the Birth Notification Form, nationality is defined as country of birth and as such, does not capture ethnicity. The main limitation of using nationality defined as country of birth for analysis is that it is restricted to this generation. First and second generation ethnic groups born in Ireland would be grouped as Irish, nonetheless, it serves as a good starting point to examine the differences that may occur in birth outcomes in Ireland. For this analysis, nationality has been grouped as follows:
Mother’s Nationality: (i) Republic of Ireland. (ii) United Kingdom.
(iii) EU27 (excluding Republic of Ireland and UK). (iv) Other European.
(v) African.
(vi) Other (including mixed-nationality, no nationality etc).11
The relatively small number of perinatal deaths for some nationalities means that rather broad aggregations are used in our analyses. Of the 181,700 cases registered between 2004–2006, 130,684 (72 per cent) have full information available for analysis. Of these, 519 were stillbirths and 253 early neonatal deaths. Just over 14 per cent of these births were to mothers who were born outside of Ireland and the UK. Of those cases that were excluded, 95 per cent were on the basis of SEG being missing. These omissions impact across all the nationality groupings but are particularly heavy among African women (with 60.1 per cent available) and EU27 (with 61.7 per cent available). In terms of maternal age, only 22 per cent of all under 20s are available for analysis with the African and Republic of Ireland groups particularly under represented here with just 19.9 per cent of African and 20.1 per cent of women under 20 from the Republic of Ireland included. In terms of parity, 64 per cent of first
time mother’s are included in this analysis. The issue of under representation is less pronounced in terms of parity with the least represented group once again being African first time mothers with 50 per cent of cases in this sub-group available for analysis.
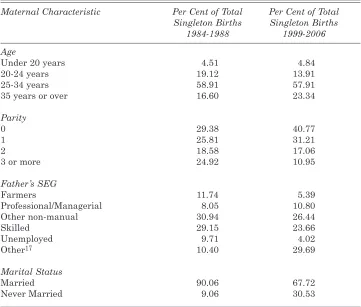
[image:10.556.108.462.294.477.2]III PERINATAL MORTALITY RATES AND DEMOGRAPHIC CHANGE Infant mortality has been falling in Ireland for at least half a century. Figure 2 gives the perinatal mortality rate in Ireland over the period 1984–2006 and shows that the rate has been declining steadily since 1984 reaching a low of 7.0 per 1,000 live births and stillbirths in 2006.12
Figure 2: Perinatal Mortality Rate, Ireland: 1984–2006
Source: Annual reports on Vital Statistics, Ireland 1984-1998.
Reports on Perinatal Statistics 1999-2006.
Although there were some fluctuations over the period, the general trend has been towards a decrease in the overall rate.13 Based on the available
singleton births data from 1999–2006, the perinatal mortality rate was 6.4 per 1,000 live births and stillbirths. Table 1 provides a summary of the distribution of births, perinatal deaths and perinatal mortality rates by each of the three independent variables of mother’s age, parity and father’s socio-economic group and also presents the perinatal mortality rates reported for these categories for the period 1984–1988.
12See Annual Report on Perinatal Statistics 2006.
Table 1: Perinatal Mortality Rate by Mother’s Age, Parity and Male Partner’s Socio-economic Group, Ireland 1999–2006 and 1984–1988
Maternal Characteristic Births Perinatal Perinatal Perinatal 1999–2006 Deaths Mortality Mortality
1999–2006 Rate Rate
(per 1,000) (per 1,000) 1999–2006 1984–1988 Age
Under 20 years 3,674 32 8.63 13.29
20-24 years 21,069 145 6.84 10.39
25-34 years 207,622 1,206 5.78 10.33
35 years or over 93,114 728 7.76 15.69
Number of Previous Births
0 113,425 763 6.68 12.31
1 108,825 579 5.29 8.70
2 63,784 377 5.88 9.36
3 or more 39,445 392 9.84 14.65
Male Partner’s Socio-economic Group
Farmers, farm labourers and
fishermen 24,954 180 7.16 10.34
Professional/managerial 50,045 282 5.60 9.21
Intermediate non-manual 122,466 734 5.96 10.21
Skilled/semi-skilled manual 109,492 721 6.54 10.95
Unskilled manual/unemployed 18,522 194 10.37 19.29
Total 327,590 2,111 6.44 11.36
Overall there has been a 43 per cent decrease in the perinatal mortality rate from 11.36 per 1,000 live births and stillbirths for the period 1984–1988, to 6.44 for the period 1999–2006. The distribution of rates within the categories has changed very little over time. The conventional “J-shaped” age distribution found for the period 1984-1988 is still evident in the later period although the oldest age group now exhibit the highest rates.14Parity follows a
more conventional J-shape pattern with rates highest for mothers with 3 or more previous births followed by those with no previous births. Perinatal mortality rates for SEG have also retained the same pattern of distribution. The rate remains highest for the unskilled manual/unemployed group and
lowest for the professional group although the differential between them has narrowed significantly, on a bivariate level at least. In the 1980s data the ratio of the rates for professional and unskilled manual/unemployed groups for perinatal mortality stood at 2.09; for the 1999–2006 period the ratio falls to 1.85.
Table 2: Perinatal Mortality Rate by Mother’s Nationality, 2004-2006
Nationality Births Perinatal Perinatal
Deaths Mortality Rate (per 1,000)
Republic of Ireland 149,984 966 6.40
UK 5,866 38 6.44
EU27 6,427 36 5.57
Rest of Europe 2,965 20 6.70
African 8,283 79 9.45
Other 6,988 48 6.82
Total 180,513 1,187 6.53
Table 2 shows the perinatal mortality rate by mother’s nationality. The perinatal mortality rate for the available data for the period 2004–2006 was 6.53 per 1,000 live births and stillbirths. Mother’s with an African nationality recorded the highest perinatal mortality rate at 9.45 per 1,000 live births and stillbirths. The lowest rate was reported for mothers with an EU27 (excluding the Republic of Ireland and UK) nationality with 5.57 per 1,000 live births and stillbirths.
professional/managerial group, 38.4 per cent of births were to first time mothers. Cross-classification involving nationality reveals that mothers with a Republic of Ireland nationality have a rate of 8.73 for being aged under 20 years, 8.39 for being in the unskilled manual/unemployed group and 8.93 for having 3 or more previous births.
Demographic Changes
In the early 1980s the Irish birth rate began to fall from 21.8 per 1,000 in 1980 to 15.3 per 1,000 in 1988.15This downward trend continued until the late
1990s when the rate began to climb again, reaching a recent high of 15.4 per 1,000 population in 2006.16While the birth rate is returning to 1980s levels,
there has been a marked change in the underlying demographic profile of women giving birth over the period which in turn impacts on the meaningfulness of the comparisons outlined above. A summary of the main changes is provided in Table 3.
The most influential change in demography relates to a change in marital status. As previously stated, the proportion of women stating that they are married at the birth of their child has decreased dramatically between the two periods. Throughout the 1980s, never married mothers accounted for just under 10 per cent of all mothers giving birth. In the current data, never married mothers account for some 31 per cent of all mothers giving birth. As noted in Section II, this has resulted in a decrease in the availability of father’s details as non-married mothers are not legally required to provide this information and in many instances, it is not requested. As demonstrated in Table 3 the group “Other”17 has increased dramatically, accounting for just
under 30 per cent of all singleton births in 1999–2006, compared with 10 per cent for 1984–1988. Within the NPRS system father’s occupational status is designated as not applicable if mother is not married and father’s details are missing. The growth in this not applicable category is the driving force behind the increase in the “Other” category, and as discussed previously, this is the primary reason why only roughly 70 per cent of all data for 1999–2006 could be used in this analysis.
In terms of the age profile of mothers, the highest proportion of babies born was to women aged 25–34 years throughout both time periods. The proportion of babies born to women in their early twenties has decreased with a corresponding increase in the proportion where mothers were aged 35 and over. There was little change in the proportion of babies born to teenage mothers (aged less than 20 years). The increase in maternal age is common to 15Report on Perinatal Statistics 1988.
16 Report on Perinatal Statistics 2006.
most developed countries but Ireland has been found to have one of the highest proportions of mothers aged over 35 years in Europe.18The impact of
[image:14.556.102.463.130.437.2]the increase in maternal age profile on pregnancy outcomes is debated but there is a general consensus that increasing maternal age is associated with an increased risk of pregnancy complications and adverse outcomes such as chromosomal abnormalities, perinatal mortality, preterm delivery, caesarean section, diabetes, and hypertension. Multiple births, which again carry a greater risk of complication, are also more common with increased age, most likely due to the role of fertility treatments.19
Table 3: Changes in Maternal Characteristics
Maternal Characteristic Per Cent of Total Per Cent of Total Singleton Births Singleton Births
1984-1988 1999-2006
Age
Under 20 years 4.51 4.84
20-24 years 19.12 13.91
25-34 years 58.91 57.91
35 years or over 16.60 23.34
Parity
0 29.38 40.77
1 25.81 31.21
2 18.58 17.06
3 or more 24.92 10.95
Father’s SEG
Farmers 11.74 5.39
Professional/Managerial 8.05 10.80
Other non-manual 30.94 26.44
Skilled 29.15 23.66
Unemployed 9.71 4.02
Other17 10.40 29.69
Marital Status
Married 90.06 67.72
Never Married 9.06 30.53
Source: Perinatal Statistics 1984-1988,Department of Health.
Report on Perinatal Statistics 1999-2006,ESRI.
18European Perinatal Health Report(2008).
In terms of parity, there has been a sizeable increase in the proportion of births to first time mothers. This has been accompanied by a corresponding decrease in the proportion of babies born to women with three or more previous births. The effect of parity on perinatal outcomes differs depending on the number of previous births. Both women experiencing their first birth and those having their third or higher child have an elevated risk of pregnancy complications such as perinatal deaths, hypertension, eclampsia and pre-term birth over women having their second child plus some different risk factors.20 The change in average number of previous births therefore has a
mixed impact. There are fewer women having three or more children but this reduction in population risk is counterbalanced, to a certain extent, by an increase in the proportion of women having their first child and growth in the proportion of older first time mothers in particular.
Differences in perinatal mortality rates have been found between racial and ethnic groups in a number of countries.21The role of ethnicity in Ireland
has become more relevant as Ireland becomes less culturally homogenous. In 2006, there were 420,000 non-nationals living in Ireland, accounting for roughly 9 per cent of the total population.22In the same year, 12,048 (18.6 per
cent) of singleton births occurred to mothers who gave a nationality other than the Republic of Ireland making nationality an important demographic feature to incorporate into our analyses.
IV ECONOMETRIC ANALYSES
To examine the net impact of mother’s age and parity and father’s SEG we fitted a series of logit models of the probability of a perinatal death. The dependent variable takes the value 1 in the case of perinatal death and 0 otherwise. The independent variables are all categorical and entered into the equation in the form of dummy variables. Appendix Table 1 gives the full definition and construction of the variables used and the reference categories.
Our model can thus be represented as:
Y= α +β1A +β2P +β3SC
Where A: age of mother; P: parity of the birth; SC: father’s SEG.
20See for example Bai et al.(2002); Roman et al.(2004).
T
able 4:
Odds Ratios for Logit Models of Perinatal Death NPRS Data, 1999–2006
Model 1 Model 2 Model 3 Model 4 Odds t-stat Odds t-stat Odds t-stat Odds t-stat Ratio Ratio Ratio Ratio
Age Under 20 years
1.09 0.46 1.12 0.58 1.28 3.1 1 1.14 0.86
Age 20-24 years
Ref.
Ref.
Ref.
Ref.
Age 25-34 years
0.94 –0.71 0.92 –0.89 0.97 –0.48 0.86 –1.54
Age 35 or Over
1.23 2.2 1.13 1.2 1.23 2.8 1.08 0.61
Parity 0 (No Previous Births)
1.3 4.65 1.22 3.23 1.24 4.36 1.20 2.19 Parity 1 R ef. Ref. Ref. Ref. Parity 2 1 .06 0.84 1.07 1.03 1.07 1.21 1.04 0.4
Parity 3 or More
1.63 7.17 1.67 7.44 1.64 8.27 1.54 4.17 Father Farmer
, Farm Labour or
Fisherman Ref. Ref. Ref. Ref. Father Professional 0.81 –2.17 0.81 –2.16 0.81 –2.17 0.78 –1.61 Father Inter
. Non Manual
0.88 –1.57 0.88 –1.56 0.88 –1.56 0.68 –2.78 Father Skilled/Semi-Skilled 0.97 –0.39 0.97 –0.39 0.97 –0.37 0.81 –1.55 Father Unskilled/Unemployed 1.45 3.48 1.45 3.37 1.45 3.52 1.03 0.15
Father SEG Not
Applicable
1.33
3.42
1.02
0.13
Parity 0 and
Age 35 years or Over
1.30 2.5 1.23 2.28 1.21 1.28 Mother Ireland Ref. Mother UK 0.97 –0.19
Mother Other EU
0.86
–0.86
Mother Other European
1.07
0.31
Mother African
1.42
2.59
Mother Other Nationality
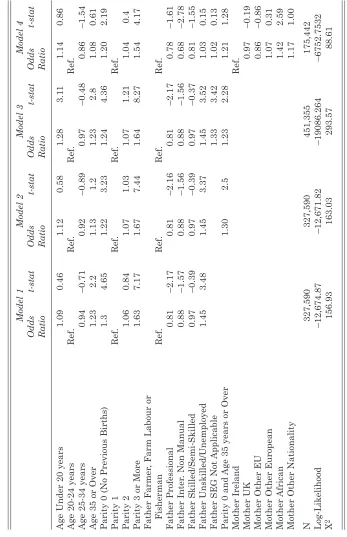
We begin analysis by examining a model of perinatal mortality which is directly comparable to that estimated by Nolan and Magee (1994) and which does not attempt to adjust for the increase in missing father SEGs. This is shown in Table 4, Model 1. The odds ratios for age 35 years and over, parity 0, parity 3 or more and unskilled manual/unemployed occupational group are all significant at the 95 per cent level and greater than unity, indicating that compared to the reference categories, each is associated with a higher probability of perinatal death. The odds of less than unity for professional fathers indicates a lower probability than the reference group (agricultural and fisheries workers). The odds of 1.45 for father unskilled/unemployed represents a 45 per cent greater risk for these cases relative to the reference group. The results for age and parity largely concur with Nolan and Magee (1994) using data from 1984-1988. The results for other father SEG groups on the other hand, are somewhat different. Nolan and Magee found a significant and positive effect for the skilled/semi-skilled grouping and no significant effect for the professional grouping compared to farmers. Their unskilled/ unemployed coefficient suggested a 99 per cent higher risk for this group relative to farmers. The fall to a 45 per cent higher risk in 1999–2006 suggests a significant reduction in differentials. To test for two-way interactions between our variables, interaction effects were estimated between variables and their contribution to the model assessed using likelihood-ratio tests. These tests indicated that the interaction between age and parity and specifically, between having no previous births and being age 35 years, added significantly to the explanatory power of our model. This term is fitted in Table 4, Model 2.
As we would expect, these changes have important effects on the odds ratios over Model 2. Whereas mother being aged under 20 years was non-significant in Models 1 and 2, it increases in size and becomes very non-significant in Model 3. The odds ratio implies an increase in risk of 28 per cent for these mothers compared to those aged 20 to 24 years. The term for mothers aged 35 years or more now regains significance and increases from 1.13 to 1.23 even with the inclusion of the interaction term. Although the coefficients for father’s SEG do not change (as we would expect), those women whose partner’s SEG is classified as “not applicable” have a 33 per cent higher chance of perinatal mortality compared to farming and fisheries groups.
To be able to compare to the analyses of Nolan and McGee (1994), Table 4 used father’s SEG in the analysis of perinatal mortality. Appendix Table 2 shows the results of identical models which substitute mother’s SEG for father’s. Results are, for the most part, very similar for variables other than SEG. For SEG itself there is a steeper gradient to mother’s SEG than father’s. For example, unskilled/unemployed mothers have a 63 per cent greater probability of perinatal mortality than the reference group of agricultural and fisheries workers compared to a 45 per cent difference when the father’s SEG is used. However, the mother’s SEG group difference proves not to be significant across all of the models.
Maternal Nationality
To assess the impact of nationality on perinatal mortality additional logit models were estimated which is identical to Model 3 in Table 4 except for the addition of mother’s nationality (see Table 4, Model 4). As this variable is only available within the NPRS data file from 2004 onward our sample size falls to 175,442 compared to 451,355 in Model 3. Mothers from the Republic of Ireland form the reference category for the nationality variable. The results for this model are displayed in Table 4, Model 4. Mother being 35 years or over and all of the father’s SEG categories now become non-significant except for the term for intermediate non-manual father. All the nationality variables are insignificant at the 95 per cent level except for that for African mothers which increases the risk of perinatal mortality by 42 per cent compared with Republic of Ireland nationals. Estimating Model 4 with the restricted sample but without the nationality variable produces almost identical results to those in Table 4. This would suggest that it is the difference between Models 3 and 4 is almost entirely due to restriction of the data to the period from 2004 to 2006 and the smaller sample of births.23
Comparing Perinatal Mortality Rates
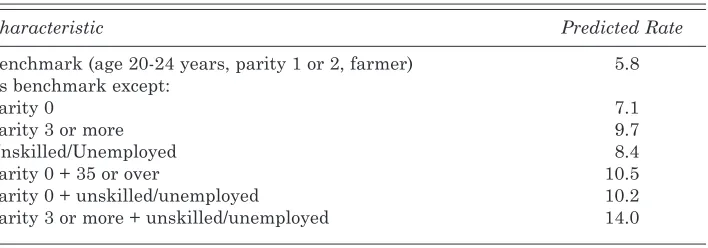
We calculated the predicted probability of perinatal death for different combinations of the independent variables to illustrate their impact individually and together.24The results of this exercise are shown in Table 5.
[image:19.556.101.455.334.458.2]In the case of a mother aged 20-24 years, parity 1, father farmer, the predicted risk from Model 2 of Table 4 is simply the intercept, which converts to a value of 0.0058, or a perinatal mortality rate of 5.8 per 1,000. If the only change in characteristic is that the mother has had no previous births, the predicted rate rises to 7.1 per 1,000. For a mother with a parity of 3 or more, this rises again to 9.7 per 1,000. Parity zero with mother’s age 35 years plus leads to an overall rate of 10.5 per 1,000, which is an 81 per cent increase in risk over the benchmark group. Unskilled manual/unemployed father SEG has a predicted rate of 8.4 per 1,000. For this group, when there are no previous births the rate increases to 10.2 per 1,000 and increases again to a high of 14 per 1,000 with a parity of 3 or more.
Table 5:Predicted Perinatal Mortality Rate by Characteristic
Characteristic Predicted Rate
Benchmark (age 20-24 years, parity 1 or 2, farmer) 5.8
As benchmark except:
Parity 0 7.1
Parity 3 or more 9.7
Unskilled/Unemployed 8.4
Parity 0 + 35 or over 10.5
Parity 0 + unskilled/unemployed 10.2
Parity 3 or more + unskilled/unemployed 14.0
Note:Predicted from Model 2, Table 4.
A number of issues emerge from the preceding analysis and comparison of risk factors associated with perinatal mortality. The overall perinatal mortality rate has decreased by almost half from the 1980s figure of 11.4 per 1,000 live births and stillbirths to 6.44 (not controlling for population characteristics). This decrease is visible across all the variables under study and in general the pattern of distribution remains the same with having a parity of 3 or more or being from the unskilled/unemployed group continuing to attract the highest rates for perinatal mortality. Comparison to Nolan and Magee (1994) shows that the falls in risk since the 1980s have not been
uniform across groups controlling for compositional change. Using Model 1 from Table 4 (to facilitate comparison) we find that the unskilled/unemployed and professionals have experienced the largest fall in estimated risk at 41 per cent (13.7 per 1,000 in 80s to 8.1 per 1,000 in 00s for the unskilled and followed by professionals where risk fell by 33 per cent (6.9 per 1,000 in the 80s to 4.6 per 1,000 in 00s). Taken together, these factors indicate a general improvement in perinatal mortality overall and a decline in the differential between the professional and the unskilled/unemployed SEG groups.
Adjusting Perinatal Mortality Rates for Demographic Change
The last section found a decreasing differential across SEG groups but as shown in Section III, there has been a significant change in the proportion of women who are married when giving birth which could influence this result. This section applies the simulation approach discussed in Section II to adjust for these changes. To carry out the simulation we require two pieces of information: first, how those cases with an unknown father SEG are to be distributed across father SEG groups and second, coefficients expressing their risk of perinatal mortality (see Section II).
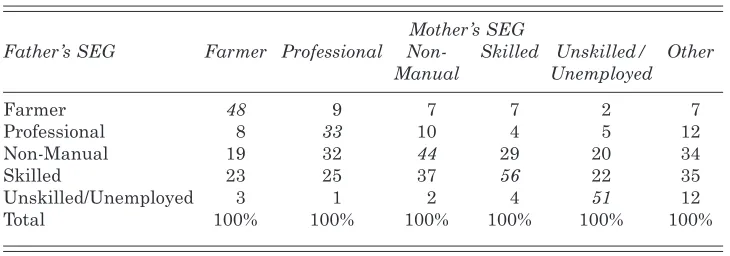
[image:20.556.101.466.489.617.2]The distribution of father’s SEG for each mother’s SEG group for those cases where we have information on both parents SEG are given in Table 6. This shows a good degree of correlation between partner’s SEGs as shown by the high proportions across the diagonal (italicised). For example, 56 per cent of mother’s classified as skilled or semi-skilled have partners in the same position. Forty-eight per cent of mother’s classified as farmer’s have farming partners. This correlation means that 30 per cent of partner’s are in the same SEG for those where both are known.25
Table 6: Distribution of Father’s SEG Groups Across Mother’s SEG for NPRS Sample 1999–2006 Where Both Are Known (N=327,590)
Mother’s SEG
Father’s SEG Farmer Professional Non- Skilled Unskilled/ Other
Manual Unemployed
Farmer 48 9 7 7 2 7
Professional 8 33 10 4 5 12
Non-Manual 19 32 44 29 20 34
Skilled 23 25 37 56 22 35
Unskilled/Unemployed 3 1 2 4 51 12
Total 100% 100% 100% 100% 100% 100%
To derive proxy coefficients for those cases where fathers SEG was “not applicable” we first replaced missing father’s SEGs for the “not applicable” group with mother’s SEG where known. We then estimated a logit model fitting mother’s age, parity, father’s SEG (including a term for “not applicable”) and the interaction of “not applicable” with father’s SEG. This allowed us to quantify the effect of substituting mother’s SEG for each father SEG group and calculate the additional risk for these groups. Table 7 shows the results of this model and shows that births where father’s SEG was “not applicable” carried a significantly higher risk on average. This confirms the need to adjust for differential risk as well as the distribution of cases.
Table 7: Results for Logit Model of Perinatal Death NPRS Data 1999–2006 – Mother’s SEG Substituted for Father’s Where SEG “Not Applicable”
Odds Ratio t-stat
Age Under 20 years 1.20 2.17
Age 20-24 years Ref.
Age 25-34 years 1.00 0.02
Age 35 years or Over 1.35 4.55
Parity 0 (No Previous Births) 1.31 5.98
Parity 1 Ref.
Parity 2 1.05 0.86
Parity 3 or More 1.58 7.65
Father Farmer, Farm Labour or Fisherman Ref.
Father Professional 0.81 –2.23
Father Inter. Non Manual 0.88 –1.59
Father Skilled/Semi-Skilled 0.97 –0.36
Father Unskilled/Unemployed 1.48 3.74
Father SEG Not Applicable 1.51 4.47
Father SEG “NA” + Professional (Mother) 1.62 3.36
Father SEG “NA” + Int. Non Manual (Mother) 1.34 4.33
Father SEG “NA” + Skilled/Semi-Skilled (Mother) 1.31 2.28
Father SEG “NA” + Unskilled (Mother) 1.09 0.78
N 451,355
Log-Likelihood –19,079.769
X2 306.56
professionals, non-manuals and skilled manual groups. Crucially, it rises most among the unskilled/unemployed where the rate increases from 8.1 per 1,000 to 8.5 per 1,000.
This confirms our earlier contention that those groups removed from the denominator by demographic change carried a higher level of risk. This adjustment in rates means that whereas with the unadjusted figures the ratio between the professional SEG and unskilled manual SEG had decreased between the 1980s and the later period from 1.99 to 1.79 before adjustment, after adjustment it rises to 1.88.
V SUMMARY AND CONCLUSIONS
The main aim of this paper has been to assess trends in the perinatal mortality differential between socio-economic groups in Ireland between the 1980s and 2000s. This was a period of intense economic and social change in Ireland and real incomes across all sectors of Irish society increased. Yet, although living standards were improving across the period Ireland remained a relatively unequal country in a European context. It is not possible in this paper to provide any causal analysis of the relationship between perinatal mortality trends and economic change but the period from the 1980s to the 2000s does provide an interesting context within which to examine the impact of increasing affluence and inequality.
[image:22.556.100.463.137.273.2]We analysed the factors associated with perinatal mortality using NPRS data for the years 1999–2006 and compared these findings to similar analysis for the years 1984–1988 carried out by Nolan and McGee (1994). The perinatal mortality rate has declined substantially over the periods from 11.4 per 1,000
Table 8: Estimated SEG Perinatal Mortality Rates for 1984–1988 and Unadjusted and Adjusted for 1999–2006
1984–1988 1999–2006
Rate/1000 Ratio to Unadj. Adjusted Ratio to Ratio to 1984-88 Prof Rate/1000 Rate/1000 Prof. Prof.
(Unadj.) (Adj.)
Farmer 6.9 1 5.6 5.7 1.23 1.25
Professional 6.9 1 4.6 4.5 1.00 1.00
Non-Manual 6.9 1 5.6 5.0 1.23 1.10
Skilled 7.9 1.15 5.6 5.5 1.23 1.22
Unskilled/
live births and stillbirths for 1984–1988, to 6.4 for 1999–2006. The perinatal mortality rate continues to be high for older mothers aged 35 years or more and those mothers who have not had previous children or who already have 3 or more children. Socio-economic group also continues to have a substantial bearing on outcomes. Those women whose partner’s are classified as unskilled/unemployed have perinatal mortality rates 79 per cent higher than women with partners classified as professional once we control for the distribution of maternal age and parity. This compares to a 99 per cent differential in the late 1980s in work by Nolan and Magee (1994). If correct, such a decrease in socio-economic differentials would suggest that the period of unprecedented economic growth between 1994 and 2007, the “Celtic Tiger” years was accompanied by a significant reduction in perinatal mortality differentials even as overall income inequalities marginally increased.
However, specific demographic changes plus birth registration techniques in Ireland cast some doubt on the veracity of this decrease in inequalities. From the 1980s to the 2000s in Ireland, there has been a significant decrease in the proportion of women who are married at the time of childbirth. Mothers who are not married are not required to provide information on the occupational grouping of their partner and this has meant that an increasing proportion of male partners are “not applicable” and cannot be used for analysis. Since working class women are both least likely to be married at the birth of their child and have the highest risk of perinatal mortality it is likely that this change may well have impacted on socio-economic differentials in perinatal mortality. The central aim of this paper was to adjust for the increasing level of missing data on father’s occupational grouping so that direct analyses could be made of trends in perinatal mortality differentials across socio-economic groups since the late 1980s.
Applying a simulation procedure to adjust for the impact of changing demographic trends moderates the decrease in differential between professional and unskilled manual/unemployed groups that occurred between the 1980s and 2000s from 1.79 to 1.88. Differentials have clearly reduced since the 1980s but by less than was initially found.26
examine trends in the factors associated with perinatal mortality and how these differ between socio-economic groups so as to shed light on the actual processes that differentiate groups. A clearer understanding of the factors that lead to worse outcomes for working class groups may help us to develop effective policies to reduce the risk of poor outcomes for these groups still further.
Although we have developed a method for adjusting for the information on father’s occupational group lost from the NPRS database by the current registration process, this is not an ideal situation. The proportion of mothers who are not married at the time of their child’s birth has been increasing steadily since the 1980s and this trend is likely to continue. A simple change in the registration process would significantly improve the data available for analysis and policy development.
REFERENCES
ANTONOVSKY, A. and J. BERNSTEIN, 1977. “Social Class and Infant Mortality”,
Social Science and Medicine,Vol. 11, pp. 453-470.
BAI, J., F. W. S. WONG, A. BAUMAN and M. MOHSIN, 2002. “Parity and
Pregnancy Outcomes”, American Journal of Obstetrics and Gynecology,Vol. 186,
pp. 274-278.
BAIRD, S., J. FRIEDMAN, N. SCHADY, 2007. “Infant Mortality over the Business Cycle in the Developing World”, Policy Research Working Paper 4346, New York: The World Bank.
CENTRAL STATISTICS OFFICE, 2008. Census 2006 Non-Irish Nationals Living in
Ireland, Dublin: The Stationery Office.
CENTRAL STATISTICS OFFICE, 2000. Vital Statistics Reports 1984-1998, Dublin:
The Stationery Office.
CENTRAL STATISTICS OFFICE, 1986. Census of Population 1981, Vol. 7, Dublin: The
Stationery Office.
CLEARY-GOLDMAN, J., et al., 2005. “Impact of Maternal Age on Obstetric Outcome”,
Obstetrics and GynecologyVol. 105, pp. 983-990.
CONFIDENTIAL ENQUIRY INTO MATERNAL AND CHILD HEALTH (CEMACH).
2008. Perinatal Mortality 2006: England, Wales and Northern Ireland, CEMACH:
London.
DEATON, A., 2006. “Global Patterns of Income and Health: Facts, Interpreta tions, and Policies”, WIDER Annual Lecture, Helsinki, September 29.
DEPARTMENT OF HEALTH, Perinatal Statistics 1985-1988, Dublin: Stationery
Office.
EURO-PERSTAT PROJECT, 2008. “European Perinatal Health Report”, Available: www. europeristat. com
FRETTS, R. C., J. SCHMITTDIEL, F. H. MCLEAN, R. H. USHER and M. B.
GOLDMAN, 1995. “Increased Maternal Age and the Risk of Fetal Death”, New
HESSOL, N. A. and E. FUENTES-AFFLICK, 2005. “Ethnic Differences in Neonatal
and Postneonatal Mortality”, Pediatrics, Vol. 115, pp. e44-51.
HEALTH RESEARCH AND INFORMATION DIVISION, 2008. Perinatal Statistics
Report for 2006, Dublin: The Economic and Social Research Institute and Department of Health and Children.
JAMISON, D. T., M. E. SANDBU and J. WANG, 2004. “Why has Infant Mortality Decreased at Such Different Rates in Different Countries?” Working Paper No. 21, Bethesda, MD: Disease Control Priorities Project.
LAYTE, R., C. T. WHELAN and B. NOLAN, 2004. “Explaining Poverty Trends in
Ireland During the Boom”, Irish Banking Review, Summer.
LEON, D. A., D. VÅGERÖ and P. O. OLAUSSON, 1992. “Social Class Differences in
Infant Mortality in Sweden: Comparison with England and Wales”, British
Medical Journal, Vol. 19, No. 305(6855), pp. 687-691.
LUKE, B. and M. B. BROWN, 2007. “Elevated Risks of Pregnancy Complications and
Adverse Outcomes with Increasing Maternal Age”, Human Reproduction, Vol. 22,
No. 5, pp. 1264-1272.
MACDORMAN, M. F. and M. S. MATHEWS, 2008. Recent Trends in Infant Mortality in
the United States, NCHS Data Brief, No. 9. Hyattsville, MD: National Center for Health Statistics.
MAHER, J. and A. MACFARLANE, 2004. “Inequalities in Infant Mortality: Trends by Social Class, Registration Status, Mother’s Age and Birthweight, England and
Wales, 1976-2000”, Health Statistics Quarterly,Vol. 24, pp. 14-19.
MARMOT, M., 2004. Status Syndrome: How Your Social Standing Directly Affects Your
Health, London: Bloomsbury.
MUKTAR, A. H., H. M. SALIHU, L. G. KEITH, J. E. EHIRI, M. A. ISLAM and P. E.
JOLLY, 2005. “Extreme Parity and the Risk of Stillbirth”, Obstetrics & Gynecology,
Vol. 106, No. 3, pp. 446-453.
NOLAN, B. and H. MAGEE, 1994. “Perinatal Mortality and Low Birthweight by
Socio-Economic Background: Evidence for Ireland”, The Economic and Social Review,
Vol.25, pp. 321-341.
PENSOLA, T. H. and T. VALKONEN, 2000. “Mortality Differences by Parental Social
Class from Childhood to Adulthood”, Journal of Epidemiology and Community
Health,Vol. 54, No. 7, pp. 525-529.
PRITCHETT, L. and L. H. SUMMERS, 1996. “Wealthier is Healthier”, Journal of
Human Resources, Vol. 31, No. 4, pp. 841-868.
ROMAN, H., P-Y. ROBILLARD, E. VERSPYCK, T. C. HULSEY, L. MARPEAU and G. BARAU. 2004. “Obstetric and Neonatal Outcomes in Grand Multiparity”,
Obstetrics and Gynecology,Vol. 103, pp. 1294-1299.
WALDMANN, R. J., 1992. “Income Distribution and Infant Mortality”, The Quarterly
Journal of Economics, Vol. 107, No. 4 (Nov.), pp. 1283-1302.
WILKINSON, R. G., 1996. Unhealthy Societies: The Afflictions of Inequality,
Appendix Table 1:Variables Definitions
Age (Reference category = age 20 to 24 years)
< 20 years =1 if aged <20 years
25-34 years =1 if aged 25-34 years
35 years and over =1 if aged 35 years and over
Parity of Birth (Reference category =1 previous birth)
Parity 0 =1 if first birth
Parity 2 =1 if 2 previous birth
Parity 3 or more =1 if 3 or more previous births
Father’s Occupational Class (Reference category = Farming)
Professional =1 if Father professional
Intermediate Non-Manual =1 if Father Intermediate Non-Manual
Skilled/Semi-skilled Manual =1 if Father skilled Semi-skilled Manual
Unskilled/Unemployed =1 if Father unskilled/unemployed
Not Applicable =1 if Father SEG not applicable (ie., not married)
Mother’s Occupational Class (Reference category = Professional)
Farming =1 if Mother Farmer or other Agricultural
Intermediate Non-Manual =1 if Mother Intermediate Non-Manual
Skilled/Semi-skilled Manual =1 if Mother skilled Semi-skilled Manual
Unskilled/Unemployed =1 if Mother unskilled/unemployed
Other =1 if Mother SEG none of above
Mother’s Nationality (Reference Category=Ireland and UK)
UK =1 if UK
EU Other EU before and
after 2003 =1 if EU27 & not UK or Ireland
Rest of Europe =1 if European but not EU27
African Country =1 if African
Other (including US, Canada etc and mixed or no
Appendix T
able 2:
Odds Ratios for Logit Models of Perinatal Death NPRS Data 1999–2006
Model 1 Model 2 Model 3 Model 4 Odds Odds Odds Odds Ratio t-stat Ratio t-stat Ratio t-stat Ratio t-stat
Age Under 20 years
1.22 1.69 1.23 1.74 1.21 2.34 1.06 0.41
Age 20-24 years
Ref.
Ref.
Ref.
Ref.
Age 25-34 years
0.88 –1.94 0.87 –2.06 0.92 –1.49 0.86 –1.74
Age 35 years or Over
1.22 2.5 1.15 1.5 1.15 1.98 1.06 0.51 Parity 0 1 .33 5.28 1.29 4.33 1.33 5.89 1.29 3.16 Parity 1 R ef. Ref. Ref. Ref. Parity 2 1 .00 0.02 1.01 0.15 1.01 0.1 0.99 –0.08
Parity 3 or More
1.46 4.23 1.49 4.37 1.55 7.48 1.51 4.18 Mother Farmer
, Farm Labour or Fisherman
Ref. Ref. Ref. Ref. Mother Professional 0.96 –0.12 0.96 –0.1 1 0.96 –0.12 1.33 0.4 Mother Inter
. Non Manual
1.10 0.27 1.10 0.28 1.10 0.28 1.54 0.61 Mother Skilled/Semi-Skilled 1.28 0.73 1.28 0.73 1.29 0.74 1.60 0.65 Mother Unskilled/Unemployed 1.63 1.41 1.62 1.4 1.65 1.47 1.76 0.78
Mother SEG Not
Applicable
1.56
1.32
2.15
1.08
Parity 0 and
Age 35 years or Over
1.13 1.17 1.27 2.71 1.21 1.29 Mother Ireland Ref. Ref. Ref. Ref. Mother UK 0.95 –0.3 Mother EU27 0.84 –1.01
Mother Other European
0.94
–0.29
Mother African
1.30
2.15
Mother Other Nationality