Abstract—The Interactive Voice Response Units (IVRUs) have been used in call centers widely in recent years. In this paper, we study a call center made up of trunk lines, IVRUs and Customer Service Representatives(CSRs). We discuss partial closing rules, calls’ impatience and feedback phenomena in a call center. A call enter the call center whenever a trunk line is available, otherwise it is lost. Once a trunk line is seized, the call is served by the IVRUs first; then the call may leave the center or be routed to an available CSRs. If all CSRs are busy, the call is queued at the automatic call distributor until one line is free. While waiting for CSRs, calls may abandon the queue if their waiting time becomes unreasonably long. We assume that each call abandons the queue independently of each other when waiting for CSRs. From the perspective of the queuing theory, we present some significant performance measures for the system in steady-state. Finally, numerical results are presented with the focus on the effects of different parameters.
Index Terms—Call center, partial closing rules, impatient, feedback, the Interactive Voice Response Units (IVRUs)
I. INTRODUCTION
call center is a place where large numbers of calls are processed and information services are provided by telephones. Call center business is developing rapidly and studied by many authors [1-9]. Call centers have become a preferred and prevalent approach for companies to communicate with their customers.
Several researchers [4-10] considered the call centers with calls' impatience, catastrophe and retrial phenomena. They obtained the stationary distribution of the system and other performance measures, but they did not consider the call centers with the Interactive Voice Response Units (IVRUs). It is reported that almost 60-80% of the operational costs for a call center involves personnel expenses [11]. Therefore, an efficient deployment of Customer Service Representatives (CSRs)keeping a high quality of service is indispensable for reducing operational expenses in a call center. In order to improve this trade-off, most companies install IVRUs [12], which is a method of customer self-service. Once arriving calls enter the call center, they first receive service by IVRUs, and then some of them can further receive service by agents. If all agents are busy, the calls who want further service are queued at the automatic call distributor (ACD). Once a call
Manuscript received January 2, 2015; revised October 7, 2016. This work was supported in part by China Post-Doctoral Fund (2015M572327), Natural Science Foundation of Anhui (KJ2014A174, KJ2015A270 and 1608085QA 03). It is also supported by Scientific Research Fund of Chaohu University. Y. Chen and Y. Zhu are with Faculty of Science, Jiangsu University, Zhenjiang, Jiangsu, 212013, China.
P. Chen is with School of Applied Mathematics, Chaohu University, Chaohu, Anhui 238000, China (corresponding author, e-mail: cps8@sina. com).
completes its transaction with an agent, it releases both the truck line and the agent simultaneously. Srinivasan [13] took into account the call centers with the IVRUs. By using flow controlled Jackson networks method; they obtain the explicit expressions for the stationary distribution of the system and other performance measures, and provide a way to calculate the number of trunk lines and the number of agents required simultaneously to meet some pre specified service levels. Sometimes, all the agents may be busy upon the caller's arrival after his IVRUs process. In practical situations, a caller will wait a limited time in the queue at ACD. If he can get the service before his patience expires, then he is routed to the available agent via ACD. Otherwise, he will leave the agent area and lost. Wang [14] took into account the call centers with the IVRUs and impatient customers. By using flow controlled Jackson networks method; they obtain the explicit expressions for the stationary distribution of the system, blocking probability, abandonment probability and other performance measures. Zhang[15] took into account the call centers with the IVRUs and calls' impatience, retrial and got some performance measures. Chen [16] considered a call center with a closing rule, impatient customers and IVRUs. They derived some performance measures and investigated the impact of various parameters on the performance measures.Inspired by new Internet technology, nowadays CSRs are not necessarily concentrated in the same place. They can work in any place where Internet connection is available allowing a more flexible work style for CSRs. Hashizume [17] focus on a two-stage tandem queue with retrials for Internet-based call centers with IVRUs. They formulated the queueing model using a level-dependent QBD process and derived performance measures.
In view of the customers who dissatisfied with the service can return back for service again. In this paper, we will investigate the combination of the calls (abandonment and feedback) and the role of the service channel (
CSR
and the IVRUs) in a call center and the research on this aspect has not found at present.In this paper, the call center with partial closing rules, calls’ impatience and feedback is discussed. This model is more close to widely used call centers. Based on queuing model, some significant performance measures for the system in steady-state have been presented, and some numerical examples are given.
The remainder of the paper is organized as follows. In Section 2, we present the model description. In Section 3, we develop some significant performance measures for the system in steady-state. In Section 4, some numerical examples are given and conclusions are presented at last in this paper.
Analysis of a Call Center with Partial Closing
Rules, Feedback and Impatient Calls
Yan Chen, Peishu Chen*, Yijuan Zhu
A
IAENG International Journal of Applied Mathematics, 46:4, IJAM_46_4_24
II. MODEL DESCRIPTION
In this paper, we consider a call center which is made up of telephone trunk lines, an automatic call distributor (ACD) together with the IVRUs and
CSRs
(or agents). Readers can see the operation process of a call center in Figure 1. The first one represents the IVRUs; the second queue represents the calls which will be served by agents. We assume that:(1) The call center consists of N trunk lines, S
CSRs
(agents). (SN).This call center with IVRUs can handle at most N calls at a time, where N represents the total number of truck lines available. Arriving calls can enter the call center only when the total number of calls at the call center with IVRUs and theagents’ pool is strictly less than the number of truck lines; otherwise, the call is lost. There is no queue at the IVRUs, whereas some calls may have to wait for an agent at ACD if all the
CSRs
are busy. The arrival process of incoming calls is a Poisson process with constant rate. A call enters the call center whenever a trunk line is available; otherwise it is lost. Once a trunk line is seized, the call is served by the IVRUs first; then the call may leave the call center with probability 1p or be routed to an available agent with ratep. If allCSRs
are busy, the call is queued at the ACD until one agent is free; while waiting for the services, calls may abandon the queue if their waiting time becomes unreasonably long. We assume that each call abandons the queue independently of each other while waiting for services. Customers’ patience time is exponential distribution with rate. The processing times of the IVRUs are independent and identically distributed exponential random variables with rate1, and the agents’ service times are independent andidentically distributed exponential random variables with rate2.
(2) Once a call completes its services by an agent, it may releases both the truck line and the
CSR
simultaneously (leaving the call center) with probability 1 or may hold the truck line andreleases theCSR
(feedback to the IVRUs) with probability .(3) The partial closing rule is as follow: Once the system is no calls, the system will shut down S-C servers simultaneously for a random time (1 C S N ), the shutdown time is exponential distributed with rate. If any trunk line is seized before the end of the shutdown, S-C servers return to the system. Otherwise, these servers take another shutdown and continue until they find calls in the trunk lines.
(4) All above random variables in our model are mutually independent.
Fig. 1. The operation process in a call center
III. RESULTS
We formulate the call center with IVRUs by a two-stage queueing system. The first-level queue represents the calls at the IVRUs, the IVRUs can handle at most N calls at a time; the second-level queue represents the calls needing agents’ service (Including the waiting and being serviced calls). Let
( )
N t : = The number of calls at the IVRUs at time ;t
( )
K t : =The number of calls needing agents’ service at time ;
t
( )
I t :=Servers statuses at time ,t where I t( )0 means Cservers are open orI t( )1means all servers are open.
Note that N t( )+K( )t Nfor allt0.
It is easy to proof that the system has only a finite number of states and all random variables are independent and exponentially distributed, so
N t K t I t( ), ( ), ( ) :t0
is an irreducible finite state Markov chain. The state space is defined as
n k i, , | 0 k n, N, 0 k n N i, 0,1 .
Then we can find the stationary distribution of the system by quasi birth and death (QBD) method. For more details of this method, reader can refer to the literature [17].
Let ( , , )n k i : = a steady state probability, when the system have ncalls in the first-level queue and k calls in the second-level queue,the servers in state i,(0k n, N,
0 k n N,i0,1). We further define:
0 ( (0,0,0), (0,1,0), (0,1,1),... (0, ,0)N , (0, ,1)N ),
( ,0,0) ( ,0,1) ( ,1,0) ( ,1,1) ( , ,0) ( , ,1)
( , , , ,... , );
j j j j j j N j j N j
(j1, 2,...N).
Then we can define the stationary probability vector as
0 1 2
( , , ,... N),
which is uniquely determined by solving the equation 0
Q
and the normalization condition T 1,
where T is a column vector of ones.
That is 0 1 2
( , ,0) ( , ,1) (0, ,1)
0 0 1 0 1
( , , ,... ) 0,
1.
N N N m N N m N
m n m n n
m n m n n
Q
(1)
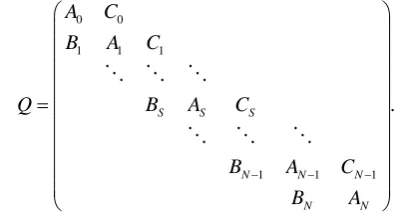
where Q in the above equation is the infinitesimal generator as follow.
0 0
1 1 1
1 1 1
.
S S S
N N N
N N
A C
B A C
Q B A C
B A C
B A
. The Q matrix above is based on the first coordinate horizontal transfer of the steady state probability vector,
IAENG International Journal of Applied Mathematics, 46:4, IJAM_46_4_24
[image:2.595.322.524.627.735.2]which has the block tridiagonal form. The details of elements in Q are expressed below.
n
A (n0,1,...,N)is the lower block tridiagonal form as follow. 00 10 11 21 22 1 , n n n n n n n n
N n N n N n N n
A
A A
A A A
A A
we define
1 1 min(k, ) 2 max ( ), 0 ,
n k
a n C kC
2 1 min( , ) 2 max[( ),0] ,
n k
a n k S kS
(n0,1,... ;N k0,1, 2,...Nn), then the sub-matrix of Anis as follows.
1 2
1
2
( ) 0
, , . 0 , 0 0 n n k kk n k n k n k
if n k
a
A if n k N
a
n k N a if n k a
We further define
3 min( , ) 2(1 ) max ( ), 0 ,
n k
a k C kC
4 min( , ) 2(1 ) max[ ), 0] ,
n k
a k S (kS
(n0,1,...,N k; 1, 2,...,Nn), then
2 2 1 3 4 (1 ) , 1 (1 ) . 0 , 1 0 n kk n k n k if n A a if n a n
B (n0,1,...,N)is the upper block tridiagonal form as
follow. 00 01 11 12 1 . n n n n n n n
N n N n N n N n
B B
B B
B
B B
Thesub-matrix of Bnis
1 1 1 1 , 1 , 0 , 1 0 n kk q n q B n q n n q 1 1 1 0 , 0 n kk n p B n p
(n1, 2,...,N, k0,1,...,Nn). n
C (n0,1,...,N)is the lower block tridiagonal form as
follow.
00
10 11
21 22
1 2 1 1
1 , n n n n n n n n
N n N n N n N n n N n N n C C C C C C C C C
(n0,1,...,N1). Thesub-matrix of Cnis
2 1
2
min( , ) 0
,
0 min( , )
n kk k C C k S
0 ,
0, 1 0 , 0 0 1 n kk
if n k C
if n k
(n0,1,...,N1;k0,1,...,N n 1).
By using the Structured Gaussian Elimination method, which is introduced in the literature [18], we can solve the two equations in (1) perfectly, obtain the stationary distribution probability of the system and further get the performance measures below.
1) The idle probability of all lines: P0(0,0,0).
2) The probability of exactly mcalls in the system
( , ,0) ( , ,1).
m n k n k
k n m k n m
P
3) the average number of calls in the system:
( , ,0) ( , ,1)
0 0 0
( ) .
N N N
m n k n k
m m k n m m k n m
E L mp m m
4) The average number of the waiting customers in the second-level queue:
( , ,0) 1 0
( , ,1) 1 0
( ) ( )
( ) .
N N k
Agents n k
k C n
N N k
n k k S n
E N k C
k S
5) The busy probability of all lines:
1 ( , , ) 0
.
B n k i
k n N i
P
6) The leaving probability in the second-level queue for impatience:
( , ,0) 1 0
( , ,1) 1 0 2
( )
( )
( )
.
( )
N N k
IL n k
k C n
N N k
n k k S n
k C P
k C N S
S N S
Remark 1. If 0and 0,then all the calls leave the system once they complete their services by agents and the call center becomes idle once there is no calls in the system. Our model can be simplified as a two-stage tandem queue [12]. If we further assume that 0,0 and in performance measures as shown above, then our results are in agreement with [13].
IAENG International Journal of Applied Mathematics, 46:4, IJAM_46_4_24
IV. NUMERICALRESULTS
In order to demonstrate the impact of various parameters on the performance measures of our model, we will demonstrate some numerical examples. In this paper, we mainly show how the parameter p, the parameter,the arrival rate λ and the parameter affect the performance measures of the system by some numerical examples.
Case 1: Given1-11 3min , -1 2 1min,
1
1 6 min
,
1
1 2 min,
1
1min,
0.2,
N3,S2,C1. We
study the changes of the parameter p to the idle probabilityP0 and all lines busy probabilityPB.
Fig. 2. The idle probabilityP0 versus p
Fig. 3. All lines busy probability PBversusp
It can be seen from figures 2-3 that when parameter p increases, the idle probabilityP0 decreases, while all lines
busy probabilityPBcan drastically increase. It is obvious that when more customers join the system, the idle probability of the system decreases, and all lines busy probability increase.
Case 2: Given1-11 2 min , -1
2 1 5min,
1
1min
,
1
1 2 min,
1
1 3min,
0.2,
N3,S2,C1.We
study the changes of the parameter p to the following three performance measures.
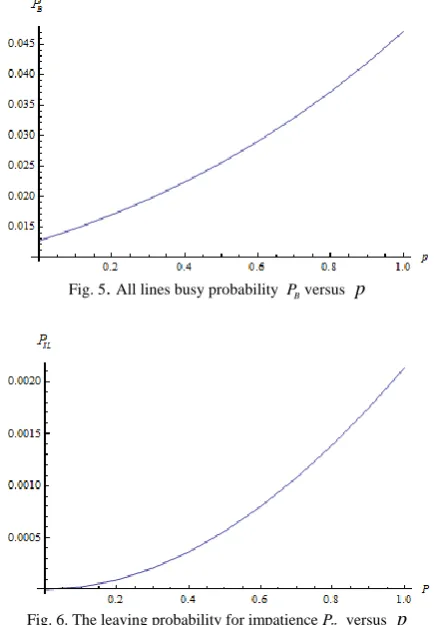
It can be seen from figures 4-6: (1) when parameter p increases, the average number of the waiting customers in the second-level queue E N( Agents) and all lines busy probabilityPB and the leaving probability for impatience
IL
P increase. (2) Compare figure 3 and figure 5, we found that there are different of the curve bending direction between the two figures, the main reason is that the system is also influenced by other parameters.
Fig. 4. The average number of the waiting customers in the second- level queue E N( Agents) versus p
Fig. 5. All lines busy probability PBversus p
Fig. 6. The leaving probability for impatiencePIL versus p
Case 3: Given1-11 2 min , 1
1 2 min,
-1
2 1 3min,
0.2,
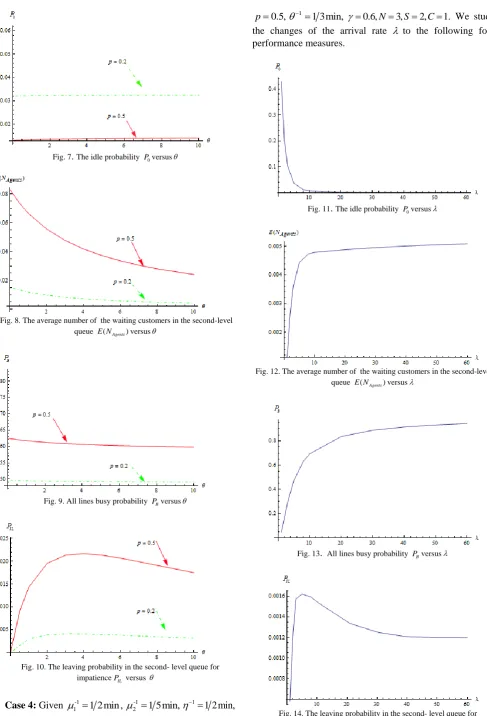
N3,S2,C1 . We study the changes of the parameter to the following four performance measures withp0.2 0.5.,
It can be seen from figures 7-10 :(1) when the parameter
increases, the idle probability P0increases, while all lines busy probabilityPB and the average number of the waiting customers in the second-level queue E N( Agents) decrease. When the parameterincreases, the leaving probability in the second-level queue for impatiencePIL reaches a maximum value, and then it has a slow decline. (2)When the parameter
is large enough, the system performance measures become stable. It is found that system performance measures are influenced by parameter, but the changes of the system performance measures is not big. (3)Because all calls should use the lines, the system performance measures must be influenced by parameterp.
IAENG International Journal of Applied Mathematics, 46:4, IJAM_46_4_24
[image:4.595.314.533.52.199.2] [image:4.595.69.287.208.532.2] [image:4.595.317.538.229.542.2]Fig. 7. The idle probability P0versus
[image:5.595.52.540.42.759.2]Fig. 8. The average number of the waiting customers in the second-level queue E N( Agents)versus
Fig. 9. All lines busy probability PBversus
Fig. 10. The leaving probability in the second- level queue for impatiencePIL versus
Case 4: Given 1-11 2 min , -1
2 1 5min,
1
1 2 min,
0.5,
p 1
1 3min,
0.6,N 3,S 2,C 1.
We study
[image:5.595.48.269.52.387.2]the changes of the arrival rate to the following four performance measures.
Fig. 11. The idle probability P0versus
[image:5.595.316.536.96.433.2]Fig. 12. The average number of the waiting customers in the second-level queue E N( Agents)versus
[image:5.595.45.265.401.726.2]Fig. 13. All lines busy probability PBversus
Fig. 14. The leaving probability in the second- level queue for impatiencePIL versus
IAENG International Journal of Applied Mathematics, 46:4, IJAM_46_4_24
[image:5.595.319.531.452.767.2]It can be seen from figures 11-14:(1) When the arrival rate increases, the idle probability P0 can drastically
decreases, while all lines busy probabilityPB and the average number of the waiting customers in the second-level queue (E NAgents) increase. (2)The leaving probability in the second-level queue for impatiencePIL reaches a maximum point, and then starts to fall.
Case 5: Given -1
1 1 3min ,
-1
2 1min,
1
1 6 min
,
1
1 2 min,
11min,
0.6
N 3,S2,C1.We
[image:6.595.306.531.52.213.2]study the changes of the parameter p to the following four performance measures.
[image:6.595.57.298.222.742.2]Fig. 15. The idle probability P0versus
Fig. 16. The average number of the waiting customers in the second-level queue E N( Agents)versus
Fig. 17. All lines busy probability PBversus
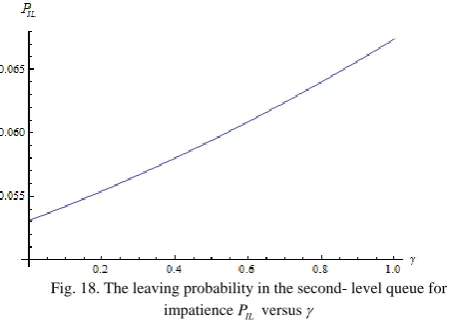
Fig. 18. The leaving probability in the second- level queue for impatiencePIL versus
It can be seen from figures 15-18 that when the parameter
increases, the idle probability P0 decreases, while all lines
busy probabilityPB , the average number of the waiting customers in the second-level queueE N( Agents)and the leaving probability in the second-level queue for impatience PIL increase.
V. CONCLUSIONS
In this paper, we study a call center made up of trunk lines, interactive voice recording units and agents. We discussed partial closing rules, calls’ impatience and feedback in the call center by queueing theory. Some numerical examples are also investigated on how the design parameters affect some important performance measures of the system.
ACKNOWLEDGMENT
The authors would like to thank the anonymous referees for their constructive comments and valuable suggestions on improving this paper.
REFERENCES
[1] Ger Kool. et al, “Queueing Models of Call Centers: An Introduction”, Annals of Operations Research,Vol.113, pp.41–59, 2002.
[2] N. Gans. et al, “Telephone Call Centers: Tutorial, Review and Research Prospects”, Manufacturing and Service, Operations Management, Vol.5(2), pp:79-141, 2003.
[3] Raik Stolletz, Stefan Helber, “Performance analysis of an inbound call center with skills-based routing”, OR Spectrum,Vol.26, pp:331–352, 2004.
[4] A. Brandt, M. Brandt, “On a two-queue priority system with impatience and its application to a call center”, Methodology and Computing in Applied Probability, Vol.1, pp:191–210, 1999. [5] K.V. Vijayashree and A. Anjuka, “Stationary Analysis of an M/M/1
Driven Fluid Queue Subject to Catastrophes and Subsequent Repair”, IAENG International Journal of Applied Mathematics, Vol.43(4), pp:238-241, 2013.
[6] Garnett, A. Mandelbaum and M. Reiman, “Designing a call center with impatient customers”, Manufacturing and Service Operations Management, Vol.3, pp: 208-227, 2002.
[7] Yun Bae Kim,Chang Hun Lee, “Empirical Analysis for Individual Behavior of Impatient Customers in a Call Center”,OR Spectrum, Vol.28, pp:334-342, 2005.
[8] Serger Zeltyn, Avishai Mandelbaum, “Call Centers with Impatient Customers: Many-Server Asymptotics of the M/M/n + G Queue”, Queueing Systems, Vol.51, pp:361-402, 2005.
[9] Salah Aguir. et al, “The impact of retrials on call center performance”, OR Spectrum, Vol.26, pp:353–376, 2004.
[10] Woo Yang, “Taek Sik Choo. M/M/s queue with impatient customers and retrials,” Applied Mathematical Modelling, vol. 33(6), pp:2596-2606, 2009.
IAENG International Journal of Applied Mathematics, 46:4, IJAM_46_4_24
[11] Z. Aksin, M. Armony, and V. Mehrotra, “The modem call center:A multi-disciplinary perspective on operations management research,” Production and Operations Management, vol. 16(6), pp:665-668, 2007.
[12] P. Khudyakov, P. Feigin, and A. Mandelbaum, “Desiguing a call center with an IVR (Interactive Voice Response),” Queueing Systems, pp: 1-23, 2010.
[13] Raj Srinivasan, et al, “Performance Analysis of a Call Center with Interactive Voice Response Units”, Top, Vol.12 (1), pp:91-110, 2004. [14] Jinting Wang, Raj Srinivasan, “Staffing a Call Center with Interactive Voice Response Units and Impatient Calls,” Service Operations and Logistics, and Informatics, IEEE/SOLI 2008, pp:514-519, 2008. [15] Zhang Hua-qing, “Performance analysis in call centers with IVR and
impatient Customers,” Journal of East China Normal University (Na-tural Science),Vol.1, pp:69-78, 2010.
[16] Yan Chen, Yijuan Zhu and Peishu Chen, “Analysis of a call center with a closing rule and impatient calls”, International Conference on application of mathematics and physics, pp.342-346, 2010.
[17] Kosuke Hashizume, Tuan Phung-Duc, Shoji Kasahara and Yutaka Takahashi, “Queueing Analysis of Internet-Based Call Centers with Interactive Voice Response and Redial”, 17th International Workshop on Computer Aided Modeling and Design of Communication Links and Networks (CAMAD), pp. 373 - 377, 2012.
[18] Kawanishi K.(2008) , “QBD approximations of a call center queueing model with general patience distribution,” Computers & Operations Research, vol. 35(8), pp.2463-2481.
[19] Ke, J. C., Lin, C. H., Yang, J. Y., & Zhang, Z. G. (2009) , “Optimal (d, c) vacation policy for a finite buffer M/M/c queue with unreliable servers and repairs", Applied Mathematical Modelling, vol.33(10), pp.3949-3962.