Munich Personal RePEc Archive
The spatial distribution of workplace
accidents in Spain: assessing the role of
workplace inspections
Bande, Roberto and López-Mourelo, Elva
GAME-IDEGA, University of Santiago de Compostela,
International Labour Office and GAME-IDEGA, University of
Santiago de Compostela
1 June 2014
Online at
https://mpra.ub.uni-muenchen.de/56767/
The spatial distribution of workplace
accidents in Spain: assessing the role of
workplace inspections
Roberto Bande
and Elva López-Mourelo
June, 2014
Abstract
This paper analyses the spatial distribution of workplace accidents in Spain and analyses the role of economic and institutional variables in this geographical outcome. After estimating an econometric model that explains regional variation in job accidents incidence, we compute conditional regional distributions of workplace accidents under the assumption of no regional variation in workplace inspections. Results show that much of the regional differences in severe and fatal accidents are explained by different inspection intensities. This calls for a regional homogenization of the inspection activities, in contrast to the current situation.
Keywords: workplace accidents, Spanish regions, workplace inspections
JEL Codes: J81
GAME-IDEGA, University of Santiago de Compostela, e-mail: [email protected]. Corresponding
author. Address: Department of Economics, Faculty of Economics and Business Administration. Avenida do Burgo s/n. 15782 Santiago de Compostela, A Coruña, Spain. Phone: +34 881 811 666. Fax: +34 981 547 134.
International Labour Office and GAME-IDEGA, University of Santiago de Compostela. E-mail:
1.- Introduction
In spite of the intense process of economic growth and employment creation that the Spanish economy experienced during the 90’s and the first decade of the current century, which allowed a convergence in key labour market figures towards European average, there exists an important dimension in which this process was far from satisfactory: the very high incidence of workplace accidents. According to data from the International Labour Organization, in 2007 the incidence rate of non-fatal accidents in Spain was 57.5 per 1,000 workers – 1.5 and 2.1 times higher than in France and Germany, respectively. Regarding fatal accidents (those with higher economic and social costs), the incidence rate in Spain was of 3.6 per 100,000 workers – 0.2 and 1.5 accidents per 100,000 workers more than in France and Germany, respectively. The impact of the global crisis on the labour market in Spain has been much stronger than in most advanced countries. However, the incidence rates of workplace accidents remain high in comparison with other advanced countries. In 2011, the incidence rate of non-fatal accidents in Spain was 35.9 per 1,000 workers – 3.9 and 2.8 times higher than in Australia and Canada1, respectively.
In the Spanish case there is a further characteristic of workplace accidents incidence: a strong geographical component. Data from the Estadística de Accidentes de Trabajo (EAT hereafter)
published by the Spanish Ministry of Labour show substantial regional differences in the incidence rates. For instance, in 2011, Guadalajara registered the highest incidence rate of minor accidents (48.2 per 1,000 workers), which is 1.8 times greater than in Castellón (26.2 per 1,000 workers), the Spanish province with the lowest incidence. If we consider the severe and fatal accidents the differences are even greater. In fact, with 0.8 severe and fatal accidents per 1,000 workers, the incidence of workplace accidents in Soria is 9.4 times higher than in Ávila (0.1), the province with the lowest incidence of such accidents. At the same time, the regional analysis allows to observe that the fact that a region exhibits high incidence in a type of accidents (e.g., non-fatal) does not imply the same high incidence in other type of accidents (e.g., severe and fatal).
The contribution of this paper is threefold. First, we provide a first approach to the economic analysis of workplace accidents from a spatial perspective in Spain. Specifically, we are interested in identifying through descriptive statistical techniques potential spatial patterns in the incidence of workplace accidents. Moreover, additional information regarding the movements in the relative position of each province within the distribution is also provided. Secondly, we identify the economic and institutional determinants of the incidence rates of the workplace accidents at the provincial level. To do so we estimate by panel data techniques an econometric
1 Australia and Canada are the only two advanced economies with recent available data on occupational
model that explains the incidence rates of workplace accidents based on a set of explanatory variables, which include both labour market variables and a set of variables that proxy the efforts developed by the authorities to avoid job accidents, basically through on-the-workplace inspections. Finally, the effect of these two sets of variables on the characteristics of the geographical distribution of workplace accidents in Spain is analysed. In order to assess the extent to which the features observed in the spatial distribution of the workplace accidents can be explained by variables potentially affecting the incidence of workplace accidents, we follow the methodology applied by López-Bazo et al. (2005) to study the distribution of unemployment rates in Spain.
The existing literature has studied workplace accidents from many different perspectives. The evaluation of job safety programs (see inter alia Viscusi, 1979, 1986; McCaffrey, 1983; Curington, 1986; Lanoie, 1992; Gray and Scholz, 1993), the influence of asymmetric information on reporting rates through a moral hazard perspective (see for instance Butler and Worral, 1991; Butler et al., 1996; Bolduc et al., 2002) and the effect of the employment contract on job accidents (Amuedo-Dorantes, 2002; Guadalupe, 2003; Hernanz and Toharia, 2006; García-Serrano et al., 2010) are examples of such different approaches. In addition to these studies, another interesting, but to the best of our knowledge less studied, aspect is the geographical distribution of workplace accidents.2
A commonplace in the existing literature is that prevention policies and workplace inspections by public job safety agencies are key to reduce the number and severity of accidents. This is especially evident in Spain, where the Workplace Accidents Prevention Act, passed in 1995, established a new legal framework for the prevention of workplace accidents and organised the inspection activities of the Job Safety Agency (Inspección de Trabajo). This law was enacted as
an attempt to reduce the high incidence of workplace accidents in Spain, and succeeded in reducing the overall figures, even though Spain, as described, remains as one of the developed countries with highest incidence of job accidents. One of the distinguishing features of the Spanish job inspection organisation is that, within a common national legal framework, regional governments can decide on the intensity and type of workplace inspections.3 Furthermore, these
regional decisions can be further fine tuned, given that regions are further divided into provinces, and each provincial branch of the Job Safety Agency has a relatively high degree of
2 In this vein, Corrales Herrero
et al. (2008) analysed the differences in the duration of absences as a
consequence of workplace accidents among Spanish regions. Their results show unreasonably longer durations in the regions situated in the North of Spain.
3 Spain is politically organised in 17 regional governments (
Comunidades Autónomas), which have been
discretion in the type and intensity of the inspections. Therefore, the institutional setting is likely to foster spatial differences in the intensity of workplace inspections, and (should these inspections be effective) in the spatial disparities of workplace accidents.
The paper is organized as follows. Section 2 analyses the evolution in the spatial distribution of workplace accidents in Spain between 1995 and 2011. Section 3 provides empirical evidence regarding the determinants of workplace accidents incidence at the regional level in Spain. The fourth section assesses how the geographical distribution of workplace accidents in Spain is explained by variables potentially affecting the incidence of workplace accidents. Finally, Section 5 summarizes the main results and presents the conclusions and the policy implications of our investigation.
2. Workplace accidents in Spain: spatial dynamics
In this section, we analyse the evolution in the spatial distribution of workplace accidents in Spain. Our key variable will be the provincial incidence rate for workplace accidents. The incidence rate is defined as the number of accidents at work per 1,000 persons in employment. The use of incidence rates instead of the total number of accidents at work allows abstracting from the evolution of total employment. Data on accidents are based on the Spanish Statistics on Accidents at Work (Estadística de Accidentes de Trabajo in Spanish, EAT), compiled by the
Spanish Ministry of Labour. This database includes all those accidents that take the injured person from the workplace for at least one day (excluding the day when the accident occurred) and after a medical report is issued. We limit our sample to those workers covered by the Social Security General Regime. In order to calculate incidence rates for accidents at work, the reference population is the number of workers covered by the Social Security General Regime.
Our territorial unit of reference is the province, which corresponds to the level 3 of the Nomenclature of Territorial Units for Statistics (NUTS3) of Eurostat. There are 52 Spanish provinces. We have chosen this spatial category because the Spanish Labour and Social Security Inspectorate (Inspección de Trabajo y Seguridad Social, ITSS), which is the administrative
organisation responsible for controlling and monitoring the Law on the Prevention of Occupational Risks (Ley de Prevención de Riesgos Laborales, LPRL) is divided territorially
into provinces. Our data runs from 1995 to 2011; 1995 is the year when the Law on the Prevention of Occupational Risks was adopted,4 and 2011 is the latest year with full available
information.
4 The Law on the Prevention of Occupational Risks was a legislative reaction to the high level of
Figure 1 shows provincial incidence rates of workplace accidents in 1995 and 2011 by level of severity. This comparison of incidence rates of workplace accidents by province provides a clear picture of the magnitude of the spatial differences. The most recent figures indicate that the incidence rate of minor accidents in Guadalajara (the province with the highest incidence) at 48.2 is 1.8 times greater than in Castellón (26.2), where the incidence of minor accidents is the lowest (Figure 1-Panel A). The differences are even more pronounced when we look at the severe and fatal accidents. In fact, with 0.8 severe and fatal accidents per 1,000 workers, the incidence of workplace accidents in Soria is 9.4 times higher than in Ávila (0.1), the province with the lowest incidence of severe and fatal accidents (Figure 1-Panel B).
The sharp fall in workplace accidents observed between 1995 and 2011 had an uneven impact on the regional disparities. While regional differentials in the incidence of minor accidents decreased, the spatial differences in the incidence of severe and fatal accidents widened. Between 1995 and 2011, both the ratio between the maximum and the minimum value and the ratio between the ninth and the first decile decreased in the case of minor accidents. By contrast, both ratios actually increased in the case of the severe and fatal accidents.
Figure 1 Incidence rates of workplace accidents by province, 1995 and 2011
Panel A. Minor accidents
Panel B. Severe and fatal accidents
Note: The D9/D1 ratio is the ratio between the ninth and the first decile.
Source: Author’s calculations based on EAT and Ministry of Labour.
[image:7.595.88.512.128.583.2]indicates that the incidence rate of the province is higher (lower) than the Spanish average incidence rate. Estimates are based on calculations using Gaussian kernel functions . It is well known that the results of density estimations depend on the bandwidth of the kernel. Following Silverman (1986), the optimal bandwidth is estimated by:
0.9 / (1)
where
min , /1.349 (2)
where is the standard deviation and the interquartile range of the series.
The results reveal the presence of significant differences in the external shape of the distribution of the relative incidence rates of minor accidents between 1995 and 2011, showing that the initial situation does not remain stable throughout time. In 1995, the shape of the distribution was bimodal, characterised by the existence of a group of regions with values just below the national average and a second group of regions situated just above. However, the probability mass concentrated just above the average increased sharply between 1995 and 2011. In other words, the number of provinces with incidence rates just above the average has increased during the sixteen years considered. As a result, the bimodality observed in 1995 has largely diminished. Simultaneously, there has been a reduction in the distance between the extreme values of the distribution (Figure 2-Panel A).
The distribution of the relative incidence rates of severe and accidents has also undergone several notable changes between 1995 and 2011. First, the slight signs of bimodality already observed in 1995 have clearly increased. In particular, the distribution has gained mass around the national average. Thus, in 2011, there were two clusters of provinces: one around the Spanish average and other group of provinces with incidence rates that are 1.5 times the national average (Figure 2-Panel B).
Figure 2. Estimated density functions of provincial differences in incidence rates of workplace accidents
Panel A. Minor accidents
Panel B. Severe and fatal accidents
Note: Gaussian kernel with bandwidth according to Silverman (1986).
Source: Author’s calculations based on EAT and Ministry of Labour.
A transition matrix categorizes the various relative incidence rates of workplace accidents into a manageable number of ranges, and lists these ranges both across the top and down the side of
0 1 2 3
0.6 0.8 1 1.2 1.4
De
n
sity
1995 2011
0 0.5 1 1.5
0.3 0.5 0.8 1.0 1.3 1.5 1.8 2.0 2.3 2.5
Den
sit
y
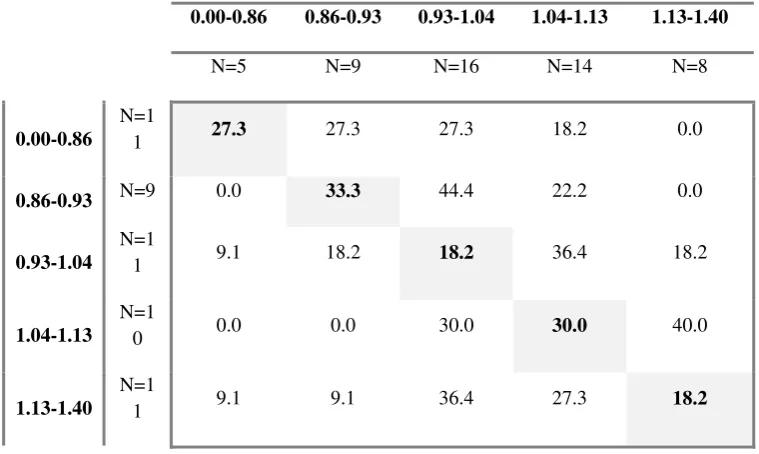
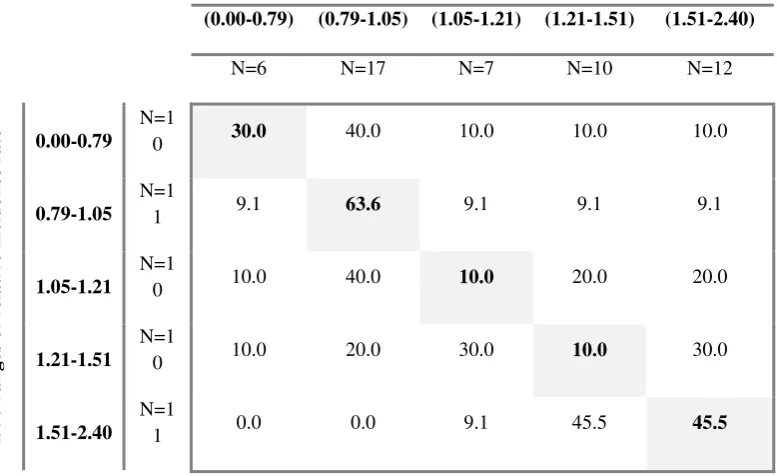
the matrix. The number in each cell indicates the probability that a province that had a relative incidence rate in the row range in 1995 changes to a relative incidence rate in the column range in 2011. Therefore, those provinces located in the diagonal remain with a similar relative incidence rate between 1995 and 2011. Cells above the diagonal suggest upward mobility, while cells below the diagonal suggest downward mobility. Of course, every province ends in one column range or another, so the probabilities along each row sum up to 100 per cent. First row and first column show the number of provinces in each of the intervals in 1995 and 2011, respectively.
Table 1. Transition probability matrix from 1995 to 2011 for relative incidence rates of minor workplace accidents
2011 ranges of relative incidence rate
0.00-0.86 0.86-0.93 0.93-1.04 1.04-1.13 1.13-1.40
N=5 N=9 N=16 N=14 N=8
1
995
ra
ng
es
of
relat
ive incidence r
a
te
0.00-0.86
N=1
1 27.3 27.3 27.3 18.2 0.0
0.86-0.93 N=9 0.0 33.3 44.4 22.2 0.0
0.93-1.04
N=1
1 9.1 18.2 18.2 36.4 18.2
1.04-1.13
N=1
0 0.0 0.0 30.0 30.0 40.0
1.13-1.40
N=1
1 9.1 9.1 36.4 27.3 18.2
Source: Author’s calculations based on EAT and Ministry of Labour.
Table 2. Transition probability matrix from 1995 to 2011 for relative incidence rates of severe and fatal workplace accidents
2011 ranges of relative incidence rate
(0.00-0.79) (0.79-1.05) (1.05-1.21) (1.21-1.51) (1.51-2.40)
N=6 N=17 N=7 N=10 N=12
1 995 ra ng es of relat
ive incidence r
a
te 0.00-0.79
N=1
0 30.0 40.0 10.0 10.0 10.0
0.79-1.05
N=1
1 9.1 63.6 9.1 9.1 9.1
1.05-1.21
N=1
0 10.0 40.0 10.0 20.0 20.0
1.21-1.51
N=1
0 10.0 20.0 30.0 10.0 30.0
1.51-2.40
N=1
1 0.0 0.0 9.1 45.5 45.5
Source: Author’s calculations based on EAT and Ministry of Labour.
Relative incidence rates of workplace accidents are a continuous variable and this means that any categorization of them into specific intervals is arbitrary. Therefore, the conclusions derived from transitions matrices are highly dependent on the amplitude of the intervals. In order to circumvent this caveat we estimate the stochastic kernels, which are the representation of the transition matrices when the number of ranges tends to infinity. A stochastic kernel shows in a three-dimensional diagram how the distribution observed at period t evolves towards the
observed distribution in period t+s. We also provide the two-dimensional contour map, which
are the projections of the kernel in the t, t+s plane. From this type of graphs we may identify i)
[image:12.595.106.503.130.366.2]persistence in the distribution when the density is located along the 45º line, ii) convergence, when the density is parallel to the X axis, and iii) overtaking, when most part of the graph is turned 90º back clockwise from the 45º diagonal (Quah, 1997).
Figure 3. Estimated stochastic kernel for provincial differences in incidence rates of workplace accidents. Minor accidents
Source: Author’s calculations based on EAT and Ministry of Labour.
Likewise, Figure 4 shows the estimated stochastic kernel for provincial differences in the incidence rates of severe and fatal accidents. The estimated kernel shows that the regional distribution of the severe and fatal accidents during the 1995-2011 period was characterized by strong persistence. In fact, we can clearly observe how the mass of probability runs along the diagonal defining persistence.
Figure 4. Estimated stochastic kernel for provincial differences in incidence rates of workplace accidents. Severe and fatal accidents
Source: Author’s calculations based on EAT and Ministry of Labour.
0.6 0.7 0.8 0.9 1 1.1 1.2 1.3 1.4 1.5
0.6 0.7 0.8 0.9 1 1.1 1.2 1.3 1.4 1.5
0 0.5 1 1.5 2 2.5
In this section, we have observed the existence of large differential across the Spanish provinces in the incidence of workplace accidents. Moreover, the geographical distribution of minor accidents is characterized by convergence to a value just above the national average, while there is a trend towards polarization in two groups of regions as regards incidence rates of severe and fatal accidents. In this context, the following sections aim to explain why provinces have different incidence rates of workplace accidents and the causes of the dynamics observed so far.
3. An empirical model of regional workplace accidents
3.1. Econometric model and data
In this section we will provide evidence regarding the determinants of workplace accidents incidence at the regional level in Spain. The risk of sickness absence due to work-related injury is determined by the interplay of incentives faced by workers and firms. This level is influenced by government regulation. For example, as described by Lanoie (1991), the intensification of government prevention policies, such as increasing the penalty in case of non-compliance with safety standards, may exert opposite effects on workplace accidents. On the one hand, these measures could lead to a reduction in the risk of accident since it would increase the expected cost of an accident for employers, induced them to devote more resources to safety. On the other hand, workers might become less careful since they might feel they work under safer conditions because of this intensification in prevention. Hence, the present empirical model of regional workplace accidents ( ) considers prevention variables ( ) and labour market variables often encountered in the literature ( ), all of them for province i in
period t:
;
(3)
Table 3. Definition, mean, standard deviation and source of variables used in the regression analysis
Variable Definition Mean Standard
Deviation Source
Dependent variables
Number of minor accidents at work
per 1,000 employees 62.3 16.4 EA and Ministry of Labour
Number of severe and fatal accidents
at work per 1,000 employees 0.94 0.48 EAT and Ministry of Labour
Independent variables
Number of labour inspectors per 1,000
employees 0.17 0.06
Labour and S cial Security Inspectorate Statistics
Number of inspections per 1,000
employees 41.1 26.2
Labour and Social Security Inspectorate Statistics
Number of penalties, standstills and injunctions imposed as percentage of total inspections
0.41 0.13 Labour and Social Security Inspectorate Statistics
Percentage of female workers in the
female labour force 80.1 9.3 Labour Force Survey (EPA)
Percentage of workers with a
university degree 9 5 3.3
Fundación Bancaja e Ivie (Instituto Valenciano de Investigaciones Económicas)
Percentage of workers in industry 17.3 7.0 Labour Force Survey (EPA)
Percentage of workers in construction 11.6 2.9 Labour Forc Survey (EPA)
Percentage of workers in services 61.7 8.6 Labour Force Survey (EPA)
Capital in machinery and equipment
per employee 24.7 5.6 Fundación BBVA
Ratio of the unemployed to the labour
force 14.5 7.1 L bour Force Survey (EPA)
Two different data series are used as the dependent variable: the incidence rate of minor accidents and the incidence rate of severe and fatal accidents. As in the previous section, the incidence rate is defined as the number of accidents at work per 1,000 persons in employment. Data on accidents are based on the Spanish Statistics on Accidents at Work (Estadística de Accidentes de Trabajo), compiled by the Spanish Ministry of Labour. We limit our sample to
Regarding the independent variables, the intensity of workplace inspections by the Job Safety Agency (Inspección de Trabajo) is taken into account. This public agency is concerned with the
prevention of accidents, the investigation of severe accidents and to propose sanctions to those firms that do not accomplish with the legal prevention regulations. Even though the main regulation is nationwide, the decisions regarding the number of inspections, the type and number of firms to be inspected, the sanctions regime, etc. is under the control of regional governments. Therefore, it is likely that if regional differences exist on the inspection intensity, this could also be a factor behind the different impact of workplace accidents at the regional level. The empirical model includes three prevention measures: the number of labour inspectors per 1,000 employees ( ); the number of inspections per 1,000 employees ( ); and the number of penalties, standstills and injunctions imposed as percentage of total inspections ( ). According to Viscusi (1986) and Lanoie (1992), it is plausible that the impact of safety-enforcing measures on accidents occurs with a lag because, among other things, there can be a lag involved in making capital investment decisions required for compliance with standards.
Selection of variables often encountered in the literature to account for labour market conditions was largely conditioned by the availability of data at the provincial level for the entire period under study. As regards workforce’s characteristics, it is expected that, ceteris paribus, jobs
with a higher fraction of female and educated workers should involve less physical effort and, therefore, lower risk of workplace accidents (Viscusi, 1986; Lanoie, 1992). Therefore, differences in the share of the female workers in the labour force (FEMALE) and in the share of
workers that have a university degree (EDUCATION) across provinces are expected to influence
regional incidence of workplace accidents.
To control for the industrial mix, the shares of employment in industry (INDUSTRY),
construction (CONSTRUCTION) and services (SERVICES) are included. The share of
employment in agriculture is omitted to avoid perfect co-linearity. Thus, coefficients of the other shares are referred to as deviations from the base category. We are aware that this sectoral disaggregation does not allow us to control for differences across provinces in the activities within each broad category. However, these are the most detailed data available at the level of provinces for the period under analysis.
The ratio of capital in machinery and equipment to labour (MACHLAB) is also considered in
provinces differs, this might explain some of the inequality in the geographical distribution of workplace accidents.
The unemployment rate (URATE) is included to capture business cycle effects. As described
elsewhere, it has been argued that workplace accident rates exhibit a pro-cyclical nature. There are two explanations to this fact. Terrés de Ercilla et al. (2004) and Martín-Román (2006) argue that during economic upturns workers increase their effort level, which makes them less cautious regarding job safety. This fact would increase the total number of accidents as well as the incidence. On the other hand, Boone and van Ours (2006) argue that during the upturns workers are more likely to report job accidents because it would be easier to find a new job if they are fired for absenteeism. This increases reporting rates, and therefore incidence rates. As a result, a negative relationship between unemployment rate and the incidence of workplace accidents is expected.
Finally, following Viscusi (1986) and Lanoie (1992), a lagged dependent variable is included in each equation to serve as a proxy for the safety conditions that prevailed in the previous period.
The analysis draws on a cross-sectional time-series econometric model based on a panel of 51 provinces with annual data during the period 1995 to 2011. However, because of lagged variables, the regressions are based on the 1997-2011 period. Hence, the sample contains 714 observations.
3.2. Estimation results
From (3) and the collection of variables described above, the following equations are estimated:
, , ,
, (4)
, , ,
, (5)
where is an unobservable fixed effect for province i, reflects omitted fixed influences that
capture technological trends and aspects of the prevention policies that are not captured in the independent variables but that are time-dependent.
The model was estimated first using the least-squares dummy variables estimator following the results in favour of this estimator by the Hausman test. However, several tests were performed to check the suitability of this estimator. First, following Pesaran (2004), a test (CD) was
performed to detect potential problems of cross-sectional dependence. This test cannot reject the null hypothesis of cross-sectional independence in both equations (CD= 1.295 with p= 0.1955
for equation 4; and CD=-0.129 with p= 0.8975 for equation 5). Second, following Wooldridge
(2002), a test was computed to check for serial correlation in the two equations. The test cannot reject the null hypothesis of no serial correlation at the usual levels for the minor accidents equation (F=3.308 with p=0.075). However, the test rejects the null hypothesis for the equation
on severe and fatal accidents (F= 19.392 with p=0.0001). Therefore, equation on minor
accidents was estimated using the ordinary least-squares (OLS) method adjusted by White’s (1980) heteroskedastic-consistent covariance matrix to correct the estimates for unknown forms of heteroskedasticity, while the equation on severe and fatal accidents was estimated using generalized least-squares (GLS) estimator. The latter is obtained by subtracting for each variable the first-order correlation coefficient for the residuals times the observation of each province in the previous period, from the observation of each province in each period.
Table 4. Estimation results of the risk equations Dependent variables (OLS estimates) (GMM estimates) (GLS estimates) (GMM estimates) ,
-32.390 -17.846 0.064 2.602
(12.22)** (25.22) (0.210) (0.907)
,
0.044 0.087 -0.001 -0.001
(0.024)* (0.040)** (0.005)* (0.001)*
,
6.966 7.217 -0.033 -0.049
(3.591)* (5.981)* (0.059)* (0.054)*
,
-0.806 -1.102 -0.007 -0.023
(0.448)* (0.371)*** (0.004)* (0.017)
,
0.855 1.029 -0.001 -0.075
(0.402) (0.546) (0.003) (0.015)
,
0.435 0.436 -0.008 -0.090
(0.219)* (0.505)* (0.002)*** (0.014)***
,
-0.060 0.027 -0.008 -0.034
(0.146) (0.484) (0.004)** (0.016)**
,
0.371 0.723 -0.009 -0.031
(0.154)** (0.473)* (0.002)*** (0.011)***
,
-0.210 0.016 -0.002 -0.011
(0.351) (0.340) (0.002) (0.0162)
,
-1.545 -2.448 -0.002 -0.009
(0.522)*** (0.453)*** (0.006) (0.021)
Lagged dependent variable
0.346 0.028 0.517 -0.180
(0.112)*** (0.039)* (0.026)** (0.041)***
Constant
104.394 1.874
(43.44)** (0.455)**
0.864 0.881
Number of observations 714 714
Table 4 summarises estimations for the whole period for the 51 Spanish provinces. The first and the second column correspond to the OLS and GMM estimation, respectively, of the determinants of minor workplace accidents, while the third and fourth summarise the GLS and GMM estimation, respectively, for severe and fatal accidents incidence. The explanatory power is satisfactory since our model is able to explain 86.4 and 88.1 per cent of the variations in the incidence of minor and severe/fatal workplace accidents, respectively.
A number of interesting results arise from the analysis. Regarding safety-enforcing variables, the inspection and the infraction rate have a surprising positive and significant coefficient in the minor accidents equation. Provinces with a higher number of inspections per 1,000 workers and a higher percentage of infractions, have a higher incidence of minor accidents. However, the coefficients of these two variables have the expected negative sign on the incidence of severe and fatal accidents. These results suggest that an increase in the intensity of workplace inspections would be followed by an important reduction in the incidence rate of severe and fatal accidents, but would have the opposite effect on the workplace accidents of less severity. A plausible explanation is that the investment in resources to safety due to the intensification of government prevention measures has a successful impact on severe and fatal accidents. However, at the same time, workers might become less careful since they might feel they work under safer conditions because of this intensification in prevention leading to an increase in the incidence of minor accidents. These results are in accordance with those found by Viscusi (1986) and Lanoie (1992). Furthermore, provinces that have a higher number of labour inspectors per 1,000 workers enjoy lower incidence rates of minor accidents, while this variable became insignificant in explaining the incidence of severe and fatal accidents.
(2006). Finally, neither human capital nor investment in machinery and equipment show significant coefficients.
5. What caused regional workplace accidents to converge/polarize?
Our previous results in Section 4 confirm that prevention and labour market variables are jointly significant in explaining the incidence rate of workplace accidents in the Spanish provinces. This section aims to analyse the effect of these two sets of variables on the characteristics of the geographical distribution of workplace accidents in Spain. In order to assess the extent to which the features observed in the spatial distribution of the workplace accidents can be explained by variables potentially affecting the incidence of workplace accidents, we follow the methodology applied by López-Bazo et al. (2005) to study the distribution of unemployment rates in Spain.
Thus, the effect of a factor X (prevention or labour market variables) on the incidence rate of
workplace accidents of province i in period t (
_
) relative to the Spanish average incidencerate is computed as:
_
(6)
where is a vector with observation for the variables include in factor X for province i and
period t, is the vector of averages across provinces for those variables in period t, and is
the vector of coefficients of the variables estimated in the previous section. Next, conditional incidence rates differential are computed by subtracting the effect of the factor from the incidence rate differentials:
_ (7)
where is the national average incidence rate of workplace accidents in period t.
Following this methodology, we will obtain conditional distributions under the assumption that all provinces would show the same values for the variables included in each set of variables. If the factor had no effect on the distribution for a particular year, then the real and conditional distributions should not differ (López-Bazo et al., 2005). The difference between the actual and
the conditional distribution can be displayed using stochastic kernels. From these charts we may identify that: i) the specific factor does not affect the observed distribution when the density is located along the 45º line, and ii) the dispersion in the real distribution is mostly caused by the factor when the density is parallel to the X axis.
the contribution of the different categories of variables to explain the geographical distribution of workplace accidents differs between minor and severe/fatal accidents. Secondly, while the prevention variables did not exert any significant influence to the provincial distribution of minor accidents, they account for a large part of the characteristics of the distribution of severe and fatal accidents. In fact, the stochastic kernel for the effect of the prevention variables on the distribution of the incidence of minor accidents (Figure 5-Panel A) depicts how the mass of probability runs along the diagonal defining no change between the actual and the conditional distribution. By contrast, Figure 5-Panel B shows that, when no difference across provinces in government prevention policies is simulated, all provinces show similar incidence rates of severe and fatal accidents since most part of the density is located parallel to the X axis.
Figure 5. Effect of the prevention variables on the distribution of the incidence rates of workplace accidents. 2011
Panel A. Minor accidents
Panel B. Severe and fatal accidents
‐15
‐10
‐5
0 5 10 15 20
‐15 ‐10 ‐5 0 5 10 15 20
‐0.4
‐0.2
0 0.2 0.4 0.6
Figure 6. Effect of the labour market variables on the distribution of the incidence rates of workplace accidents. 2011
Panel A. Minor accidents
Panel B. Severe and fatal accidents
6. Conclusions and policy implications
This paper has examined, through descriptive statistical techniques, the regional distribution of the incidence of workplace accidents in Spain, as well as its performance over the last two decades. It also has analysed the contribution of government prevention measures and labour market variables in giving rise to spatial differences in the incidence of workplace accidents. The results show the existence of large differential across the Spanish provinces in the incidence
‐20
‐15
‐10
‐5 0 5 10 15 20 25
‐15 ‐10 ‐5 0 5 10 15
‐0.2
‐0.1
0 0.1 0.2 0.3 0.4
of workplace accidents. Moreover, the evolution in the geographical distribution of minor accidents is characterized by convergence to a value just above the national average, while there is a trend towards polarization in two groups of regions as regards incidence rates of severe and fatal accidents.
The econometric analysis carried out in this paper confirms that government prevention measures and labour market variables are jointly significant in explaining the incidence rate of workplace accidents in the Spanish provinces. However, the contribution of the different categories of variables to explain the geographical distribution of workplace accidents differs between minor and severe/fatal accidents. While the large dispersion in the provincial distribution of labour market variables explains most of the observed inequality in the incidence rate of minor accidents, the differences across provinces in the government prevention measures account for a large part of the characteristics of the distribution of severe and fatal accidents.
These results call for a modification of the current framework that would reduce the regional disparities in the intensity of inspection and sanction regimes in order to prevent severe and fatal workplace accidents, those with higher economic and social costs. The Inspectorate of Labour and Social Security plans its interventions according to the objectives fixed by the relevant authorities, which may be at general or territorial level. The establishment of general objectives on the interventions regarding occupational health and safety that may be incorporated in the territorial programmes would take into account the current regional imbalance in the intensity of the inspection and could thus contribute to their reduction. In other words, if the reduction of territorial imbalances in the incidence of severe accidents is defined as a policy target, a clear homogenization in the implementation of prevention and inspection policies is required.
References
1. Amuedo-Dorantes, C. 2002. “Work safety in the context of temporary employment: The Spanish experience”, in Industrial and Labor Relations Review, Vol. 55, No. 2, pp. 262–272. 2. Bolduc, D.; Fortin, B.; Labrecque, F. and Lanoie, P. 2002. “Workers’ compensation, moral hazard and the composition of workplace injuries”, in Journal of Human Resources, Vol.37, No. 3, pp. 623-652.
3. Boone, J. and van Ours. 2006. “Are recessions good for workplace safety?”, in Journal of Health Economics, Vol. 25, No. 6, pp. 1069-1093.
5. Butler, R.J.; Durbin, D.L. and Helvacian, N.M. 1996. “Increasing claims for soft tissue injuries in workers' compensation: cost shifting and moral Hazard”, in Journal of Risk and Uncertainty, No. 13, pp. 73-87.
6. Corrales Herrero, H.; Martín Román, A.L. and Moral de Blas, A. 2008. “La duración de las bajas por accidente laboral en España: ¿Se justifican las diferencias entre comunidades autónomas?”, in Revista de Economía Laboral, No. 5, pp. 73-98.
7. Curington, W.P. 1986. “Safety regulation and workplace injuries”, in Southern Economic Journal, No. 53, pp. 51-72.
8. García-Serrano, C., Hernanz, V. and Toharia, L. 2010. “Mind the gap, please! The effect of temporary help agencies on the consequences of work accidents”, in Journal of Labor Research, Vol. 31, No. 2, pp. 162-182.
9. Gray, W.B. and Scholz, J.T. 1993. “Does regulatory enforcement work: a panel analysis of OSHA enforcement”, in Law and Society Review, No. 27, pp. 177-213.
10. Guadalupe, M. 2003. “The hidden costs of fixed term contracts: the impact on work accidents”, in Labour Economics, Vol. 10, No. 3, pp. 339-357.
11. Hernanz, V. and Toharia, L. 2006. “Do Temporary Contracts Increase Work Accidents? A Microeconometric Comparison between Italy and Spain”, in Labour, Vol. 20, No. 3, pp. 475-504.
12. Lanoie, P. 1991. “Occupational safety and health: A problem of double or single moral hazard”, in Journal of Risk and Insurance, Vol. 58, No.1, pp. 80-100.
13. Lanoie, P. 1992. “The impact of occupational safety and health regulation on the risk of workplace accidents: Quebec, 1983-87”, in The Journal of Human Resources, Vol. 27, No. 4, pp. 643-660.
14. López-Bazo, E.; Del Barrio, T. and Artís, M. 2005. “Geographical distribution of unemployment in Spain”, in Regional Studies, Vol. 39, No. 3, pp. 305-318.
15. Martín-Román, A. 2006. “Siniestralidad laboral y ciclo económico: ¿una relación meramente estadística o un fenómeno real?”, in Revista del Ministerio de Trabajo y Asuntos Sociales, No. 61, pp.157-171.
16. McCaffrey, D.P. 1983. “An assessment of OSHA’s recent effects on injury rates”, in Journal of Human Resources, No. 18, pp. 131-146.
17. Pesaran, M.H. 2004. “General diagnostic tests for cross section dependence in panels”, in Cambridge Working Papers in Economics, No. 0435, University of Cambridge.
18. Quah, D. 1997. “Empirics for growth and distribution: Stratification, polarization and convergence clubs”, in Journal of Economic Growth, Vol.2, pp. 27-59.
20. Terrés de Ercilla, F., Rodríguez, P., Álvarez, E. and Castejón, E. 2004. “Economic fluctuations affecting occupational safety. The Spanish case”, in Occupational Ergonomics, No. 4, pp. 211–228.
21. Viscusi, W. K. 1979. “The impact of occupational safety and health regulation”, in Bell Journal of Economics, Vol. 10, No. 1, pp. 117-140.
22. Viscusi, W. K. 1986. “The impact of occupational safety and health regulation, 1973-1983”, in Rand Journal of Economics, Vol. 17, No. 4, pp. 567-580.
23. White, H. 1980. “A heteroskedasticiy-consistent covariance matrix estimator and a direct test for heteroskedasticity”, in Econometrica, Vol. 48, No. 4, pp. 817-838.