This document is confidential and is proprietary to the American Chemical Society and its authors. Do not copy or disclose without written permission. If you have received this item in error, notify the sender and delete all copies.
Quantifying graphitic edge exposure in graphene based materials and its role in oxygen reduction reactions
Journal: ACS Catalysis
Manuscript ID cs-2016-00945f.R1
Manuscript Type: Article
Date Submitted by the Author: n/a
Complete List of Authors: Stamatin, Serban; J. Heyrovský Institute of Physical Chemistry, Academy of Sciences of the Czech Republic,
Hussainova, Irina; Tallinn University of Technology,
Ivanov, Roman; Tallinn University of Technology, Department of Materials Engineering
Colavita, Paula; Trinity College Dublin, School of Chemistry
Quantifying graphitic edge exposure in graphene
based materials and its role in oxygen reduction
reactions
Serban N. Stamatina†, Irina Hussainovab,c, Roman Ivanovb, Paula E. Colavitaa*
a
School of Chemistry and Centre for Research on Adaptive Nanostructures and Nanodevices
(CRANN), Trinity College Dublin, College Green, Dublin 2, Ireland
b
Department of Materials Engineering, Tallinn University of Technology, Ehitajate 5, 19086,
Tallinn, Estonia
c
ITMO University, Kronverkskiy 49, St. Petersburg, 197101, Russia
Abstract
Oxygen electrochemistry is at the core of several emerging energy conversion technologies. The
role of carbon nanostructures in the electrocatalysis of the oxygen reduction reaction is not well
understood. Herein we report an investigation of the role of graphitic edges in oxygen
electrochemistry. A new synthetic method was used to create all-carbon model electrode
materials with controlled morphology. Electron microscopy results show that synthesized
materials possess a high density of graphitic edges. Electrochemical intercalation experiments
however indicate that the density of electroactive edges does not correlate positively with
microscopy results. The materials were then characterized as electrodes for the oxygen reduction
reaction in alkaline media. Results suggest that electrochemical determinations of edge and
defect density more accurately predicts electrocatalytic activity thus suggesting that in situ
characterization techniques are needed to understand the carbon/electrolyte interface.
KEYWORDS: graphene, electrocatalysis, graphitic edges, oxygen reduction, ORR, intercalation,
defects.
Page 2 of 33 ACS Catalysis
Introduction
Oxygen electrochemistry plays a crucial role in the deployment of several emergent energy
technologies, such as the air-cathodes in metal-air batteries and fuel cells. Polymer electrolyte
membrane fuel cells (PEMFCs) are probably the most suitable candidate for powering the future
automotive industry. However high cost and short lifetime are the two key drawbacks that must
be overcome for PEMFC’s to be widely adopted by industry. The cathode materials cost
contributes significantly to the overall cost of the membrane electrode assembly: the sluggish
oxygen reduction reaction (ORR), gives rise to high cathodic over-potentials that require the use
of precious metal catalysts, with Pt being the preferred choice.1
Nanocarbons are usually used as Pt supports for fuel cell applications due to their high surface
area and corrosion resistance.2 It has been reported that the use of heteroatom-doped carbon as a
support results in increased stability and activity due to catalyst-support interactions.3-5
Heteroatom-doped carbon can also show intrinsic ORR activity which is not yet fully
understood,6,7 but that are proposed to arise from the effect of heteroatom modifications on
electronic, chemical and/or morphological properties of the carbon material. Modification of
carbons via functionalization or doping with heteroatoms can result in changes in the density of
states and Fermi energy positioning.1,8,9 Heteroatom modification can also create specific
chemical sites at the carbon surface, thus offering new adsorption or chemisorption channels to
redox species in solution. Carbon morphology may also be altered, for instance, the introduction
of pyridinic groups can favor the presence of graphitic edges and thus influence the density of
defects in the material.10 Electronic, chemical and structural/morphological effects are therefore
interrelated in heteroatom-modified carbons and they can all affect mechanisms and rates of
electrochemical reactions.11 Therefore, it is often challenging to ascribe an observed change in
ORR activity to a specific effect to develop new insights on optimal carbon material design.
Graphitic edge (GE) exposure is one of the carbon properties that is of great interest in
electrochemistry.12-15 Testing the electrochemical behavior of GEs is difficult because of the
challenges involved in achieving well defined morphologies that are rich in edges and because of
the challenges involved in characterizing GEs. Studies on ball milled graphene concluded that
small graphene flakes possess a higher ORR activity than larger ones due to greater exposure of
GEs.16-18 However ball milling yields defect-rich materials that also possess oxidized surface
functionalities; both of these give rise to changes in density of electronic states and lead to the
presence of specific chemical sites, which can both influence ORR activity.19 Therefore, there is
a need for testing materials in which the sole effect of GE can be related to ORR activities.
GEs are usually characterized by electron microscopy methods, Raman spectroscopy and
X-ray photoelectron spectroscopy. Imaging techniques are a local probing tool, while Raman and
X-ray photoelectron spectroscopy offer insights on the structure and functionalities present at the
carbon surface. Indeed, the electrode kinetics are influenced by oxygen functionalities,19 hence
the methods are mandatory in understanding the carbon. However, these characterization
methods do not offer any information about the carbon/electrolyte interface which is the main
focus of electrochemistry.
Herein, we report a novel method for the production of carbon nanostructures with controlled
morphologies grown on a dielectric alumina nanofiber support. We used thus grown materials to
investigate the role of GEs in oxygen reduction reactions at un-doped carbon materials, with the
chief aim of understanding the effect of changes in carbon matrix structure on ORR activity. Our
Page 4 of 33 ACS Catalysis
results highlight the importance of establishing the density of electroactive GEs to correctly
interpret ORR activity trends.
Experimental Methods
Material synthesis. The graphene layers were deposited onto a support of alumina (γ-Al2O3)
nanofibers of 7±2 nm in diameter and specific surface area of 155 m2 g-1,20 by a one-step
catalyst-free chemical vapor deposition (CVD) technique, as detailed elsewhere.21,22
Decomposition of methane in the presence of nitrogen as carrier gas is catalyzed by unsaturated
Al sites on an oxide surface and results in deposition of a carbon film at 1000 °C and
atmospheric pressure. The carbon obtained via CVD wraps the alumina nanofibers forming a
multi-layered graphene-like shroud along the oxide fiber. Deposition time, ratio between carbon
source and carrier gas, as well as the total flow rate were controlling factors for the carbon
loading and the morphology of carbon-alumina hybrid structures. In this work the dwell times
were selected to be 20, 60 and 120 minutes in order to fabricate carbon materials with different
morphologies used for electrochemical studies.
Characterization. The morphology of the hybrid structures was examined by high-resolution
scanning electron microscopy (HR-SEM, Zeiss Gemini Ultra-55) and transmission electron
microscopy (TEM JEOL JEM-2200FS). Raman spectra of the graphene layers on alumina
substrates were obtained on a Horiba LabRam R800 with 532 nm laser excitation.23 The carbon
content was determined by thermogravimetric analysis (Stanton Redcroft); samples were heated
in air up to 950 °C at 5 °C min-1. Specific surface area measurements were carried out on a
Quantachrome Autosorb iQ, running nitrogen physisorption measurements at 77 K. X-ray
photoelectron spectroscopy (XPS) was performed in an Omicron Multiprobe XPS system with a
base pressure of 2 × 10⁻¹⁰ mbar, using a monochromatized Al Kα source (hν =1486.6 eV) and an
EA125 U5 analyzer at 45° takeoff angle. Wide surveys were collected at 50 eV pass energy,
while core level spectra were collected at 20 eV pass energy. Data were analyzed using
CasaXPSTM; high resolution spectra were Shirley background-corrected and fitted with Voigt
line shapes in order to obtain area ratios.
Hydrodynamic electrochemical characterization was performed in a three-electrode glass cell
setup. All the water used throughout experiments was ultrapure water (>18.2 MΩ, Millipore).
The electrochemical cell was kept at 80 °C overnight in ultrapure water prior to use. A hydrogen
electrode (Hydroflex®, Gaskatel) was used as reference electrode and a high purity graphite rod
(99.997%, Goodfellow) was used as a counter electrode. The reference electrode potential was
calibrated by performing hydrogen evolution reactions as reported in previous studies.24 Its
potential was found to be +10 mV vs. RHE (Figure S1). A rotating disk electrode (RDE, Pine
Instruments) with a 0.196 cm2 glassy carbon insert was used as a working electrode. The
electrodes were polished to a mirror finish prior to use with a 50 nm alumina slurry on a
polishing cloth (Buehler). The inks were formulated by dispersing 4.0 mg of the desired material
in 920 µl of ultrapure water/isopropyl alcohol [1:1 (v/v)] and 80 µl of 0.05 wt. % Nafion
solution. The solution was sonicated for 1 h; subsequently, a 10 µl drop was spread on the
surface of the mirror polished glassy carbon. All measurements were carried out in 150 ml
freshly prepared 0.1 M KOH (Semiconductor grade pellets, Sigma Aldrich). First, the electrode
was conditioned by running ten cyclic voltammograms (CV) between 0.05 and 1.2 VRHE at a 0.2
V s-1 scan rate (Metrohm potentiostat). The electrolyte was then deaerated with Ar for 30 min
and an additional 5 CVs were recorded from 0.05 to 1.1 VRHE and a 0.05 V s-1 scan rate. Oxygen
reduction reactions (ORR) were recorded at 0, 400, 900 and 1600 rpm in O2 saturated 0.1 M
Page 6 of 33 ACS Catalysis
KOH. In order to correct for the capacitive current, the CVs in Ar were subtracted from the ORR
sweeps. The onset potential was defined as the potential where the current is 0.1 mA cm-2.25
Kinetic currents were determined from the Koutecky-Levich formula.26 Error bars for numerical
values represent 95% confidence interval.
Intercalation studies using 4-nitrobenzyl amine (4-NBA), obtained according to previously
reported methods,27 were carried out by suspending 1.0 mg of the desired material in 5 ml of a 10
mM solution of 4-NBA in acetonitrile.28 After 3 h of incubation time, the powders were collected
by centrifugation and washed 3 times with acetonitrile and water to remove excess 4-NBA. 1.0
mg of 4-NBA intercalated powders were collected and redispersed in 1 ml of acetonitrile and
subsequently used as an ink. 10 µl of this ink was spread on the surface of a glassy carbon and
immersed in 100 ml freshly prepared deaerated 0.1 M H2SO4 (>95% TraceSelect® Ultra,
SigmaAldrich). Voltammetric scans for the determination of 4-NBA coverage were carried out
in an all-teflon home-built electrochemical cell and a three-electrode geometry, using a saturated
KCl Ag/AgCl (0.198 V vs. RHE) reference electrode (IJ Cambria) and a Pt wire as a counter
electrode. All the potentials were referenced against RHE for the reported data. CVs were
recorded from -0.8 to 1.2 VRHE starting at 1.2 VRHE at a scan rate of 0.2 V s-1 (Metrohm
potentiostat). The second scan was used as a background scan for the integration of the charge
associated with the cathodic peak between -0.3 and 0.2 VRHE. Error bars for numerical values
represent 95% confidence interval.
Results and Discussion
Structural and chemical characterization of graphene-coated nanofibers. Carbon
electrodes used for our studies were obtained via CVD growth on alumina nanofiber
Figure 1. SEM images of G-ANF-1 (A), G-ANF-3 (B), G-ANF-7 (C) (scale bar = 100 nm);
TEM images of G-ANF-1 (D) and G-ANF-3 (E) and schematic illustration of the material
synthesis (F).
supports;21,22,29 the process yielded graphene-coated alumina nanofibers (G-ANF) whereby the
morphology of the carbon phase could be controlled by varying the dwell time in the CVD
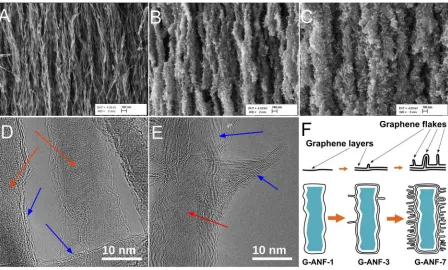
chamber. Figure 1 shows HR-SEM images of the samples after 20 (A), 60 (B) and 120 (C) min
of processing. These samples are here onwards denoted as G-ANF-1, G-ANF-3 and G-ANF-7,
respectively, according to their carbon content which is discussed below. Images in Figure 1A-C
show that as the dwell time increases the width of G-ANFs increases while their walls become
decorated with graphene-like flakes or protrusions. HR-TEM of G-ANF-1 and G-ANF-3 are
shown in Figure 1D-E. Analysis of G-ANF-1 reveals the presence of 3-5 graphene layers
oriented parallel to the long axis of the fibers and with an interspacing of 3-4 Å. Therefore, the
Page 8 of 33 ACS Catalysis
structure of G-ANF-1 fibers is similar to that of a multiwall carbon nanotube. As the growth
process progresses, the thickness of the carbon wall increases, as evident in Figure 1E where a
larger number of graphene layers parallel to the long axis can be clearly seen. The development
of flakes or foliates that protrude from the fiber walls is also clearly observed in Figure 1E; these
foliates are thinner than the fiber walls and consist of only 2-3 graphene layers. The microscopy
analysis therefore shows that in the early stages of CVD growth the alumina fibers are coated by
few graphene layers parallel to the oxide surface; longer deposition times lead to an increase in
the number of these layers but also to the development of protrusions consisting of few graphene
layers, as shown in the schematic in Figure 1F. Microscopy results are consistent with TGA
analysis (Figure S2) that reveals that the carbon content in ANFs increases in the order
G-ANF-1 < G-ANF-3 < G-ANF-7 and their mass gains are 15%, 300% and 700%, respectively.
Interestingly, the G-ANF morphology suggests that these materials might possess a high density
of exposed graphitic edges (GEs). In particular, G-ANF-3 and G-ANF-7 samples present a high
density of flakes thus suggesting they could be good electrode materials with high density of
sites for adsorption and fast charge transfer.
XPS analysis shows that the surface of G-ANF samples is mainly composed of carbon and
oxygen as indicated by the presence of C 1s and O 1s peaks in survey spectra (Figure 2A).
G-ANF-1 exhibits two additional peaks at binding energies of 74 and 119 eV which are absent in
G-ANF-3 and G-ANF-7, and that can be assigned to Al 2p and 2s photoelectrons (Figure 2A).
The presence of Al in G-ANF-1 samples can be attributed to the alumina (γ-Al2O3) support, thus
indicating that G-ANF-1 has lower carbon coverage than G-ANF-3 and G-ANF-7, in agreement
with TGA determinations of carbon loading. As the dwell time in the CVD chamber increases,
the carbon grows uniformly leading to the complete coating of the alumina support with thicker
Figure 2. X-ray photoelectron spectra survey (A), high resolution of G-ANF-1 (B), G-ANF-3
(C) and G-ANF-7 (D).
carbon layers and to the disappearance of Al peaks.
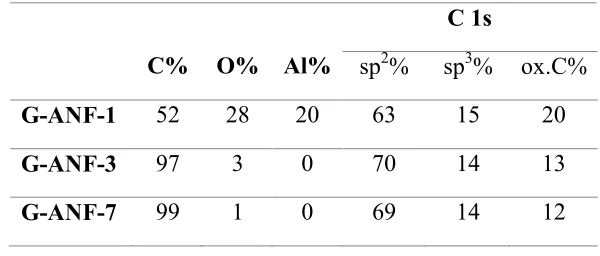
Table 1 summarizes atomic ratios determined based on peak area ratios from XPS high
resolution scans. The oxygen content is highest for G-ANF-1 samples, in agreement with the
observation of peaks arising from the alumina support; a comparison of the O 1s peaks of
G-ANF samples confirmed that the majority of the photoemitted intensity in G-G-ANF-1 is due to
oxygen atoms from the alumina support (Figure S3, Supporting Information). The oxygen
content is lowest for G-ANF-7 thus indicating that the growth process leads to the deposition of a
Page 10 of 33 ACS Catalysis
film with high carbon purity. The C 1s spectra exhibit a sharp peak at 284.3 eV with additional
contributions at higher binding energies as shown in Figure 2B-D. A best fit of the C 1s envelope
was obtained using 5 contributions at 284.3, 285.1, 286.1, 288.9 and 291.2 eV that can be
attributed to trigonally bonded carbon (sp2 centers), tetrahedrally bonded carbon (sp3 centers),
C-O/C=O carbon, carboxylic acid groups and π-π* shake up peaks, respectively.29 A summary of
the % composition for sp2, sp3 and oxidised carbon centers is reported in Table 1. The sp3
contribution remains constant at ~15% for all samples, however, the sp2 concentration increases
from 63% for G-ANF-1 to 70 and 69% for G-ANF-3 and G-ANF-7, respectively. The lower sp2
concentration in G-ANF-1 occurs in parallel with a higher concentration of oxidized carbon
centers (20%); thus suggesting that the slightly lower graphitic content at the early stages of the
[image:12.612.154.454.424.552.2]carbon growth might be due to chemical interactions between carbon and the oxide support.
Table 1. Summary of surface concentration (at.%) determined from XPS analysis
C% O% Al%
C 1s
sp2% sp3% ox.C%
G-ANF-1 52 28 20 63 15 20
G-ANF-3 97 3 0 70 14 13
G-ANF-7 99 1 0 69 14 12
Figure 3 shows Raman spectra of G-ANF-1, G-ANF-3 and G-ANF-7. The main features in
Raman spectra of carbons are the D and G peaks, at ~1350 and ~1590 cm-1, respectively,30 which
are characteristic of carbon materials. Additional peaks at 2680, 2930 and 3230 cm-1 can be
assigned to 2D, D+D’ and 2D’ bands, respectively, which are characteristic of graphene layers.23
Figure 3. Raman spectra (exc. 532 nm) of G-ANF-1 (black), G-ANF-3 (red) and G-ANF-7
(blue). All spectra are normalized by the height of the G peak to facilitate comparison.
The presence of a single symmetric peak at 2680 cm-1 indicates that G-ANFs mostly consist of
few-layer graphene, as this peak splits into an asymmetric doublet in the case of graphite;30
moreover, the relatively narrow bands suggest the layers and foliates possess nanocrystalline
structure.23 The D peak is due to the breathing modes of carbon rings and requires defects for its
activation;23 the D band intensity may be used to quantify disorder in structures.31 The ratio
between intensities of the D and G peaks, ID/IG, can be used for comparing the amount of
structural defects/edges and the degree of graphitization. The value of ID/IG is highest at 1.9 for
G-ANF-1 and decreases to 1.4 for both G-ANF-3 and G-ANF-7; this suggests that the first few
layers deposited at shorter dwell times are more defective than those deposited at later stages in
the CVD process. A similar trend is obtained if peak height ratios are used in this analysis. This
is likely due to the close interaction between the first few layers and the support; as the thickness
Page 12 of 33 ACS Catalysis
of the carbon wall grows, subsequent layers are deposited on an all-carbon surface and allow for
larger crystallite size.
Finally, the BET surface areas determined from N2 adsorption isotherms was found to decrease
with increasing carbon content, from 203 m2 g-1 for G-ANF-1 to 125 m2 g-1 for G-ANF-3 and
119 m2 g-1 for G-ANF-7. In summary, this synthetic strategy yields carbon nanofibers with
carbon walls consisting of few layers of graphene and with graphene foliates that protrude and
expose graphitic edges at the carbon interface.
Electrochemical characterization of graphene-coated nanofibers. G-ANF materials offer
an opportunity to study the electrochemical performance of metal- and dopant-free highly
graphitic materials that are rich in graphitic edges (GEs). In this context, we decided to test these
materials as model catalysts for understanding the role of GEs in the electrochemical reduction
of water at nanostructured carbon electrodes, a matter yet to be understood.26,32-34 We also
carried out measurements on glassy carbon (GC) for comparing the performance of G-ANFs to a
standard graphitic carbon electrode material.
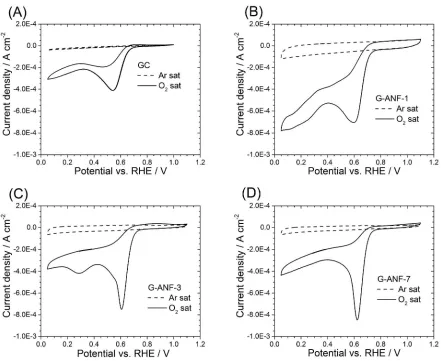
Cyclovoltammetric scans of glassy carbon (GC), G-ANF-1, G-ANF-3 and G-ANF-7 are
featureless in Ar-saturated 0.1 M KOH (Figure 4A-D). Among all the samples, G-ANF-1 has the
highest capacitive current contributions, followed by G-ANF-3 and G-ANF-7. The observed
trend in capacitive currents mirrors the measured BET areas, with G-ANF-1 being the material
with the largest BET area and the largest capacitive contribution in its CV. All samples exhibit a
dramatic increase in current around 0.75 VRHE in O2-saturated electrolyte compared to the
currents observed in Ar-saturated electrolyte (Figure 4B-D). This increase around 0.75 VRHE in
Figure 4. Cyclovoltametric scans of GC (A), G-ANF-1 (B), G-ANF-3 (C) and G-ANF-7 (D)
in Ar (dashed line) and O2 (solid line) saturated 0.1 M KOH; recorded between 0.05 and 1.1
VRHE at 0.05 V s-1 and 25°C.
O2 saturated electrolyte corresponds to the electrochemical reduction of oxygen to water. Glassy
carbon (Figure 4A) shows a similar peak at 0.65 VRHE in O2 saturated electrolyte, however the
total current is half the value observed for G-ANF samples.
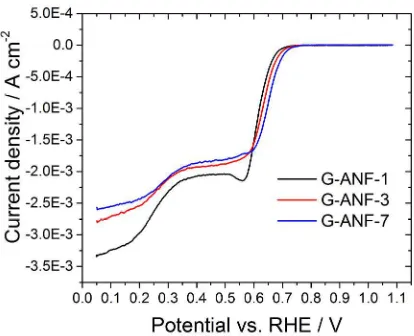
A comparison of the ORR cathodic sweeps obtained using the rotating disk electrode (RDE)
method is shown in Figure 5. All samples exhibit a two-step reduction, one around 0.75 VRHE
and another one around 0.35 VRHE corresponding to a two-step electrochemical reduction of O2
Page 14 of 33 ACS Catalysis
Figure 5. Cathodic voltammetric waves of ANF-1 (black line), ANF-3 (red line) and
G-ANF-7 (blue line) recorded in O2 saturated 0.1 M KOH between 0.05 and 1.1 VRHE at 0.05 V s-1,
900 rpm and 25°C. All waves are shown after subtraction of capacitive contributions.
to H2O.9 All samples exhibit a plateau in the range 0.35-0.55 VRHE, similar to a limiting current.
The region between 0.35 and 0.55 VRHE is diffusion controlled and the measured current is
directly proportional to the number of electrons and rotation speed (see Koutecky-Levich section
in Supporting Information).35,36 For curves obtained at the same rotation speed, a higher current
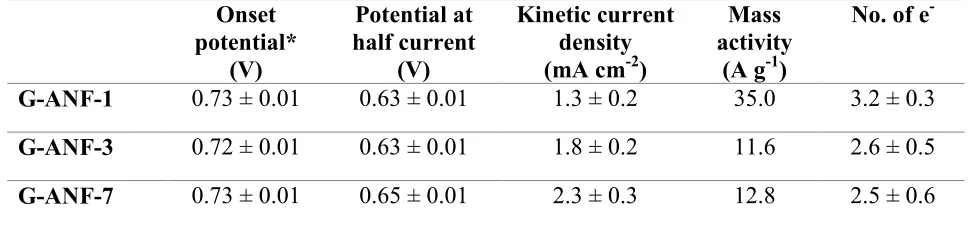
indicates greater selectivity towards the four electron reduction of oxygen to water. The highest
current density at 0.4 VRHE, was observed for G-ANF-1 electrodes indicating a higher selectivity
towards the four electron reduction of oxygen as explained in the Koutecky-Levich section of the
SI. All samples were found to display mixed 2e-/4e- kinetics; trends in the average e- numbers,
which are summarized in Table 2, suggest that whereas G-ANF-7 and G-ANF-3 favor the
production of hydrogen peroxide (2e- reduction), G-ANF-1 favors a 4e- reduction of oxygen to
water. The observation of higher e- numbers for G-ANF-1 is somewhat surprising, considering
that morphological studies show that G-ANF-1 consists of a relatively smooth carbon coating
without visible evidence of a high density of reactive GE structures.
The potential at 0.1 mA cm-2, also known as onset potential, averaged over 6 independent
measurements was found to be similar for all samples, as reported in Table 2. The potential at
half current was also found to be comparable among all samples. The most noticeable difference
among the electrodes was observed for the kinetic current densities determined as shown in the
Supporting Information. The mass-transport-corrected kinetic current density was determined
using the following formula in the Koutecky-Levich plots (Figure S3):
ଵ =
ଵ ೖ+
ଵ
ఠభ/మ (1)
where j is the measured current, jk is the kinetic current, B is the Levich constant and ω is the
angular velocity. The linear extrapolation on the y-axis yields the reciprocal kinetic current at
infinite rotation. G-ANF-7 yielded the highest kinetic current density, followed by G-ANF-3 and
G-ANF-1. It is important to consider, however, that despite all samples possessing identical
geometric area and mass loading, the carbon mass loading is different for the three ANFs:
G-ANF-7 has the highest carbon ratio while G-ANF-1 has the lowest carbon ratio (Figure S2).
Therefore, to compare activity among samples the kinetic current density was normalized by the
carbon mass, which is the electroactive fraction of the material, to obtain a mass activity, in
analogy to that obtained for carbon supported catalysts.37,38 When comparing mass-normalized
kinetic currents, G-ANF-1 was found to possess the highest electrocatalytic activity.
It is interesting to notice that the trends in reactivity point at G-ANF-1 as the material that
shows greatest catalytic activity; this is in agreement with analysis of Raman spectra which
suggests that G-ANF-1 is the most defective of the three graphene-coated fibers and therefore
Page 16 of 33 ACS Catalysis
Table 2. Summary of kinetic data as obtained from hydrodynamic voltammograms.
Onset potential*
(V)
Potential at half current
(V)
Kinetic current density (mA cm-2)
Mass activity
(A g-1)
No. of e-
G-ANF-1 0.73 ± 0.01 0.63 ± 0.01 1.3 ± 0.2 35.0 3.2 ± 0.3
G-ANF-3 0.72 ± 0.01 0.63 ± 0.01 1.8 ± 0.2 11.6 2.6 ± 0.5
G-ANF-7 0.73 ± 0.01 0.65 ± 0.01 2.3 ± 0.3 12.8 2.5 ± 0.6
* Potential at which the current is 0.1 mA cm-2
likely to be the most edge-rich among them. However, Raman does not provide information on
the amount of edges that are actually available at the carbon/electrolyte interface as it takes into
account also the carbon-alumina interface which is likely distorted or defect-rich. In order to
directly compare the density of electrochemically exposed GEs among the three materials,
intercalation studies using 4-nitrobenzylamine (4-NBA) were carried out.27 This method was
developed by Compton and co-workers27 for graphite and carbon nanotubes and has previously
been used in our laboratory for comparing exposed GE densities at amorphous carbon
electrodes.28 Briefly, partial intercalation of 4-NBA occurs at GEs where the interlayer spacing
in graphite does not allow for a full intercalation, thus leaving nitroaryl moieties exposed to the
electrolyte and available for electroreduction to arylamines. The integrated electroreduction
currents can then be used to compare relative GE densities among the samples.
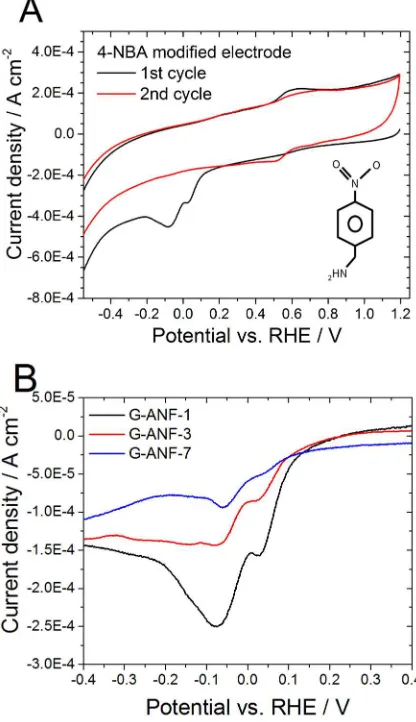
Figure 6A shows the first two cycles in the CV of intercalated G-ANF-1 in 0.1 M H2SO4. The
CV starts at large potentials, 1.2 VRHE, and is featureless until it reaches 0.15 VRHE where the
reduction of Ph-NO2 takes place until approx. -0.2 VRHE. This peak can be observed only in the
first scan and it corresponds to the reduction of the aromatic nitro compound.27 In the following
Figure 6. Cyclovoltammetric scans of a 4-NBA modified electrode (A) and 4-NBA modified
G-ANF-1 (black line), G-ANF-3 (red line) and G-ANF-7 (blue line) (B) recorded in Ar saturated
0.1 M H2SO4 between 1.2 and -0.8 VRHE at 0.2 V s-1. Curves in (B) are shown after correction by
background current to facilitate comparison.
scan, there is only a pair of peaks at ~0.6 VRHE which appear to be quasireversible and that can
be attributed to the formation of Ar-NHOH.27,39
The voltammetric response for G-ANF-1 is significantly larger than for the other two materials
and, correspondingly, the largest electroreduction charge per unit area was found to be associated
Page 18 of 33 ACS Catalysis
to G-ANF-1. Integration of the reduction peak yields surface coverage for 4-NBA, ΓNBA, of (4.79
± 0.8), (3.22 ± 0.73) and (2.75 ± 1.1) x 10-11 mol cm-2 for G-ANF-1, G-ANF-3 and G-ANF-7,
respectively. The obtained values of ΓNBA for G-ANF-3 and G-ANF-7 are similar, however there
is a considerable difference when compared to ANF-1. The highest ΓNBA observed for
G-ANF-1 indicates that the density of exposed GEs for this electrode is the highest among the
three.
Analysis via microscopy would suggest that G-ANF-3 and G-ANF-7 are richer in graphitic
edges given the abundant presence of foliates at the carbon surface; XPS analysis also indicated
that G-ANF-3 and G-ANF-7 are richer in sp2 content than G-ANF-1. Accordingly, based on
typical trends in carbon electrodes,11 G-ANF-3 and G-ANF-7 could have been expected to
display faster charge-transfer than G-ANF-1 and higher electrocatalytic activity towards ORR.17
Nevertheless, Raman spectroscopy showed that G-ANF-1 is the richest in defects among the
three materials; these defects are likely to be in the form of edges/boundaries on the basal
graphene plane and not visible via microscopy. Raman spectroscopy cannot distinguish among
electroactive and electroinactive defect sites.
In contrast, the partial intercalation of 4-NBA directly probes GEs exposed at the
carbon/electrolyte interface. This method provides information on electroactive sites and takes
into account defects and GEs that directly and unambiguously contribute to the electrochemical
performance of the material; this method was found to indeed correlate positively with ORR
activity (see Figure S5, Supporting Information). The use of electrochemical tools, that can
directly probe the role of structural changes on reactions at the carbon/electrolyte interface,
appear to thus be essential to complement microscopy and to accurately relate carbon properties
to electrocatalytic activity.
It should be noted that the values of onset potential and potential half maximum obtained for
ORR at G-ANFs are similar to values reported for heteroatom-doped graphene and carbon
nanotube composites.17,40 Our results reveal that it is possible to modulate ORR activity and
achieve high onset potentials by manipulating the properties of the carbon matrix exclusively, in
the absence of heteroatom dopants. This suggests that the kinetics are not governed by
heteroatom doping levels alone, but that the carbon matrix structure can critically affect catalytic
activity and potentially mimic or mask the effects of any chemical doping of the carbon material.
Therefore, these findings indicate that it is important to conduct experiments at undoped, pure
carbon electrodes with different carbon matrix properties such as GE density to elucidate the
individual roles of chemical site and carbon matrix.
Conclusions
A CVD technique was used to grow carbon electrode materials with three different
morphologies. XPS revealed that the material was highly graphitic in content whereas scanning
and transmission electron microscopy showed that in the initial deposition stage the substrate
was wrapped by a few layers of graphene while longer synthesis times produced nanocarbons
with a high density of protrusions with exposed few-layer graphene. Long CVD deposition time
also results in a thicker and less defective carbon phase.
This growth method was used to fabricate three different types of electrodes that allowed us to
investigate the role of defects and edges in ORR catalysis at undoped carbon electrodes. All three
materials were found to display ORR onset potentials that are comparable to many N-doped
carbon materials reported in the literature. Interestingly, the material that appears to be
morphologically smooth when examined via microscopy, was found to be the best performer in
Page 20 of 33 ACS Catalysis
terms of mass activity and number of electrons involved in the reduction process. Raman and
electrochemical intercalation studies suggest that this is the most defect-/edge-rich material, a
structural difference that we propose accounts for its higher ORR activity. An important
implication of these results is the fact that it is possible to modulate ORR activity through control
of the carbon matrix to achieve catalytic performance comparable to that obtained via
heteroatom doping. Careful study of matrix and doping effects in isolation might therefore be
necessary to fully understand synergistic matrix-dopant effects in ORR and to translate those into
tailored design of metal-free ORR catalysts. Such studies are necessary for building a rational
foundation for the tailoring of carbon electrode materials for Pt-free electrocatalysis of the
oxygen reduction reaction in polymer electrolyte fuel cells, metal-air batteries, and similar
technologies.
ASSOCIATED CONTENT
Supporting Information. Calibration of Hydroflex® reference against RHE, thermogravimetric
analysis, O 1s spectra, Koutecky-Levich plots and intercalation data. This material is available
free of charge via the Internet at http://pubs.acs.org.
AUTHOR INFORMATION
Corresponding Author
Present Addresses
† Present address: J. Heyrovsky Institute of Physical Chemistry of the CAS, Prague, Czech
Republic.
Author Contributions
The manuscript was written through contributions of all authors. All authors have given approval
to the final version of the manuscript.
Funding Sources
This publication has emanated from research conducted with the financial support of Science
Foundation Ireland under Grant Number 13/CDA/2213. This research was also supported by the
Estonian Research Council under PUT1063.
ACKNOWLEDGMENT
This publication has emanated from research conducted with the financial support of Science
Foundation Ireland under Grant Number 13/CDA/2213. This research was also supported by the
Estonian Research Council under PUT1063 (I. Hussainova). Use of XPS instrument of I.V.
Shvets and C. McGuinness provided under SFI Equipment Infrastructure Funds. The authors
would like to acknowledge Dr. Valdek Mikli and Dr. Taavi Raadik, both from Department of
Materials Science, TUT, for their help with SEM imaging and Raman spectroscopy analysis. The
authors are also grateful to Prof. W. Schmitt and Dr. A. Rafferty for access to instrumentation.
Page 22 of 33 ACS Catalysis
REFERENCES
(1) Wang, D.-W.; Su, D. Energy Environ. Sci. 2014, 7, 576-591.
(2) Trogadas, P.; Fuller, T. F.; Strasser, P. Carbon 2014, 75, 5-42.
(3) Arrigo, R.; Schuster, M. E.; Xie, Z.; Yi, Y.; Wowsnick, G.; Sun, L. L.; Hermann, K. E.; Friedrich, M.; Kast, P.; Hävecker, M.; Knop-Gericke, A.; Schlögl, R. ACS Catal. 2015, 5, 2740-2753.
(4) Ma, J.; Habrioux, A.; Alonso-Vante, N. ChemElectroChem 2014, 1, 37-46.
(5) Perini, L.; Durante, C.; Favaro, M.; Perazzolo, V.; Agnoli, S.; Schneider, O.; Granozzi, G.; Gennaro, A. ACS Appl. Mater. Interfaces 2015, 7, 1170-1179.
(6) Rao, C. V.; Cabrera, C. R.; Ishikawa, Y. J. Phys. Chem. Let. 2010, 1, 2622-2627.
(7) Zhang, L.; Xia, Z. J. Phys. Chem. C 2011, 115, 11170-11176.
(8) Wiggins-Camacho, J. D.; Stevenson, K. J. J. Phys. Chem. C 2009, 113, 19082-19090.
(9) Yang, Z.; Ren, J.; Zhang, Z.; Chen, X.; Guan, G.; Qiu, L.; Zhang, Y.; Peng, H. Chem. Rev.
2015, 115, 5159-5223.
(10) Maldonado, S.; Morin, S.; Stevenson, K. J. Carbon 2006, 44, 1429-1437.
(11) McCreery, R. L.; McDermott, M. T. Anal. Chem. 2012, 84, 2602-2605.
(12) Ubnoske, S. M.; Raut, A. S.; Brown, B.; Parker, C. B.; Stoner, B. R.; Glass, J. T. J. Phys. Chem. C 2014, 118, 16126-16132.
(13) Yoo, E.; Kim, J.; Hosono, E.; Zhou, H.-s.; Kudo, T.; Honma, I. Nano Lett. 2008, 8, 2277-2282.
(14) Yu, D.; Dai, L. J. Phys. Chem. Let. 2010, 1, 467-470.
(15) Zhang, J.; Xia, Z.; Dai, L. Sci. Adv. 2015, 1, 1500564.
(16) Benson, J.; Xu, Q.; Wang, P.; Shen, Y.; Sun, L.; Wang, T.; Li, M.; Papakonstantinou, P. ACS Appl. Mater. Interfaces 2014, 6, 19726-19736.
(17) Deng, D.; Yu, L.; Pan, X.; Wang, S.; Chen, X.; Hu, P.; Sun, L.; Bao, X. Chem. Commun.
2011, 47, 10016-10018.
(18) Jeon, I.-Y.; Choi, H.-J.; Jung, S.-M.; Seo, J.-M.; Kim, M.-J.; Dai, L.; Baek, J.-B. J. Am. Chem. Soc. 2013, 135, 1386-1393.
(19) Chen, P.; Fryling, M. A.; McCreery, R. L. Anal. Chem. 1995, 67, 3115-3122.
(20) Aghayan, M.; Hussainova, I.; Gasik, M.; Kutuzov, M.; Friman, M. Thermochim. Acta 2013, 574, 140-144.
(21) Ivanov, R.; Hussainova, I.; Aghayan, M.; Drozdova, M.; Pérez-Coll, D.; Rodríguez, M. A.; Rubio-Marcos, F. J. Eur. Ceram. Soc. 2015, 35, 4017-4021.
(22) Ivanov, R.; Mikli, V.; Kübarsepp, J.; Hussainova, I. Key Eng. Mater. 2016, 674, 77–80.
(23) Ferrari, A. C.; Basko, D. M. Nat Nano 2013, 8, 235-246.
(24) Peng, Z.; Wu, J.; Yang, H. Chem. Mater. 2010, 22, 1098-1106.
(25) Wu, G.; More, K. L.; Johnston, C. M.; Zelenay, P. Science 2011, 332, 443-447.
(26) Biddinger, E. J.; Ozkan, U. S. J. Phys. Chem. C 2010, 114, 15306-15314.
(27) Wildgoose, G. G.; Wilkins, S. J.; Williams, G. R.; France, R. R.; Carnahan, D. L.; Jiang, L.; Jones, T. G. J.; Compton, R. G. ChemPhysChem 2005, 6, 352-362.
(28) Cullen, R. J.; Jayasundara, D. R.; Soldi, L.; Cheng, J. J.; Dufaure, G.; Colavita, P. E. Chem. Mater. 2012, 24, 1031-1040.
(29) Hussainova, I.; Ivanov, R.; Stamatin, S. N.; Anoshkin, I. V.; Skou, E. M.; Nasibulin, A. G. Carbon 2015, 88, 157-164.
(30) Ferrari, A. C. Solid State Commun. 2007, 143, 47-57.
(31) Jorio, A. ISRN Nanotechnology 2012, 2012, 234216.
(32) Banks, C. E.; Davies, T. J.; Wildgoose, G. G.; Compton, R. G. Chem. Commun. 2005, 829-841.
(33) Kim, H.; Lee, K.; Woo, S. I.; Jung, Y. Phys. Chem. Chem. Phys. 2011, 13, 17505-17510.
(34) Yuan, W.; Zhou, Y.; Li, Y.; Li, C.; Peng, H.; Zhang, J.; Liu, Z.; Dai, L.; Shi, G. Sci. Rep.
2013, 3, 2248.
(35) Nikolic, J.; Expósito, E.; Iniesta, J.; González-Garcia, J.; Montiel, V. J. Chem. Educ. 2000, 77, 1191-1194.
(36) Schmidt, T. J.; Gasteiger, H. A.; Stäb, G. D.; Urban, P. M.; Kolb, D. M.; Behm, R. J. J. Electrochem. Soc. 1998, 145, 2354-2358.
(37) Mayrhofer, K. J. J.; Strmcnik, D.; Blizanac, B. B.; Stamenkovic, V.; Arenz, M.; Markovic, N. M. Electrochim. Acta 2008, 53, 3181-3188.
(38) Stamatin, S. N.; Borghei, M.; Andersen, S. M.; Veltze, S.; Ruiz, V.; Kauppinen, E.; Skou, E. M. Int. J. Hydrogen Energy 2014, 39, 8215-8224.
Page 24 of 33 ACS Catalysis
(39) Wain, A. J.; Lawrence, N. S.; Greene, P. R.; Wadhawan, J. D.; Compton, R. G. Phys. Chem. Chem. Phys. 2003, 5, 1867-1875.
(40) Higgins, D. C.; Hoque, M. A.; Hassan, F.; Choi, J.-Y.; Kim, B.; Chen, Z. ACS Catal. 2014, 4, 2734-2740.
Page 26 of 33 ACS Catalysis
Figure 1. SEM images of ANF-1 (A), ANF-3 (B), ANF-7 (C) (scale bar = 100 nm); TEM images of G-ANF-1 (D) and G-ANF-3 (E) and schematic illustration of the material synthesis (F).
94x56mm (600 x 600 DPI)
Figure 2. X-ray photoelectron spectra survey (A), high resolution of G-ANF-1 (B), G-ANF-3 (C) and G-ANF-7 (D).
124x96mm (600 x 600 DPI)
Page 28 of 33 ACS Catalysis
Figure 3. Raman spectra (exc. 532 nm) of G-ANF-1 (black), G-ANF-3 (red) and G-ANF-7 (blue). All spectra are normalized by the height of the G peak to facilitate comparison.
77x71mm (600 x 600 DPI)
Figure 4. Cyclovoltametric scans of GC (A), G-ANF-1 (B), G-ANF-3 (C) and G-ANF-7 (D) in Ar (dashed line) and O2 (solid line) saturated 0.1 M KOH; recorded between 0.05 and 1.1 VRHE at 0.05 V s-1 and 25 °C.
128x99mm (600 x 600 DPI)
Page 30 of 33 ACS Catalysis
Figure 5. Cathodic voltammetric waves of G-ANF-1 (black line), G-ANF-3 (red line) and G-ANF-7 (blue line) recorded in O2 saturated 0.1 M KOH between 0.05 and 1.1 VRHE at 0.05 V s-1, 900 rpm and 25 °C. All waves
are shown after subtraction of capacitive contributions.
66x51mm (600 x 600 DPI)
Figure 6. Cyclovoltammetric scans of a 4-NBA (inset) modified electrode (A) and 4-NBA modified G-ANF-1 (black line), G-ANF-3 (red line) and G-ANF-7 (blue line) (B) recorded in Ar saturated 0.1 M H2SO4 between 1.2 and -0.8 VRHE at 0.2 V s-1. Curves in (B) are shown after correction by background current to facilitate
comparison.
83x130mm (300 x 300 DPI)
Page 32 of 33 ACS Catalysis
Table of Contents Graphic
77x36mm (300 x 300 DPI)