Using Topic Modeling and Similarity Thresholds to Detect Events
Nathan Keane, Connie Yee, Liang Zhou
Text Analytics and Machine Learning Thomson Reuters
New York, NY 10036, USA
{nathan.keane,connie.yee,l.zhou}@thomsonreuters.com
Abstract
This paper presents a Retrospective Event tection algorithm, called Eventy-Topic De-tection (ETD), which automatically generates topics that describe events in a large, temporal text corpus. Our approach leverages the struc-ture of the topic modeling framework, specif-ically the Latent Dirichlet Allocation (LDA), to generate topics which are then later labeled as Eventy-Topics or non-Eventy-Topics. The system first runs daily LDA topic models, then calculates the cosine similarity between the topics of the daily topic models, and then runs our novel Bump-Detection algorithm. Simi-lar topics labeled as an Eventy-Topic are then grouped together. The algorithm is demon-strated on two Terabyte sized corpuses - a Reuters News corpus and a Twitter corpus. Our method is evaluated on a human anno-tated test set. Our algorithm demonstrates its ability to accurately describe and label events in a temporal text corpus.
1 Introduction
Vast amounts of research has been developed to help organize, search, index, browse and understand the immense number of electronic documents. Topic models have emerged as a powerful technique to dis-cover patterns of words that reflect the underlying topics that are combined to form documents. Latent Dirichlet Allocation (Blei et al., 2003) defines topics as multinomial distributions over words, and docu-ments as multinomial distributions over these topics. LDA uses Dirichlet priors for both the document-topic and document-topic-word distributions.
Topic Detection and Tracking(TDT) is an area of research that was prominent in the 1990’s (Allan et al., 1998). The goal of TDT is to detect the appear-ance of new topics and track their evolution over time. Specifically relevant to our paper is the task of Retrospective Event Detection. It is defined as the task of identifying all events in a corpus of stories.
In our Eventy-Topic Detection (ETD) algorithm we wish to leverage the powerful structure of topic models in the Retrospective Event Detection task. In particular, we develop an algorithm that is capa-ble of identifying Eventy-Topics in a sequentially or-dered, massive ’Big Data’ sized corpus. We define an Eventy-Topic to be a topic that solely describes a specific, time sensitive news event. A topic that is consistently and persistently in the news is not an Eventy-Topic.
We run daily LDA topic models, then calculate the cosine similarities between the topics in all the models. Eventy-Topics contain a noticeable spike around the date of the event in these cosine similar-ity graphs. To detect these spikes, we smooth the co-sine similarity values so that the bump has a mono-tonically increasing section, followed by a plateau, followed by a monotonically decreasing section. We then then run a novel algorithm called Bump Detec-tion that searches for these properties.
Given a time-stamped corpus, our goal is to au-tomatically detect and describe all of these Eventy-Topics. Our algorithm is capable of detecting one-time (uni-modal) Eventy-Topics, such as "Robin Williams Death", as well as multi-time (multi-modal) related Eventy-Topics, such as "The Masters Golf Tournament".
2 Related Work
There have been multiple works that studied the top-ics of temporal corpora. Toptop-ics over Time (Wang and McCallum, 2006) incorporates time directly into the generative topic model. A timestamp is drawn from a beta distribution for every word in the cor-pus. One limitation of this method is the restrictive-ness of the beta distribution. The presence of a topic in a corpus can be multi-modal, which conflicts with the beta distribution. In contrast, our work does not assume that the presence of an event in a corpus is unimodal.
Dynamic topic models (Blei and Lafferty, 2006) capture the evolution of topics in a time stamped corpus. It involves multiple static topic models in each time slice and models how the prior parame-ters change over time, given a logistic normal prior. The motivation for dynamic topic models is to track the evolution of topics, not to detect emerging topics that correspond to events.
Retrospective New Event Detection research uti-lizes metrics such as cosine similarity, Hellinger similarity, and KL Divergence to determine how similar documents are (Dou et al., 2012). On-line LDA (AlSumait et al., 2008) incorporates topic de-tection into its algorithm by calculating the KL di-vergence of evolving topics at adjacent time periods. If the calculated KL divergence exceeds an historic percentiled threshold, then the topic is flagged as an emerging, new topic. Our work is similar in spirit, but we use difference measures against all previous topics as opposed to just adjacent ones.
There has been success modeling the burstiness of phrases in the news cycle (Leskovec et al., 2008). Static LDA topic models have had their topics la-beled as hot and cold based on the mean document-topic mixtures in different time segments (Griffiths and Steyvers, 2004).
TimeMines (Swan and Jensen, 200) is a TDT, 3 step system that first creates noun phrases for fea-tures, then finds significant features using a 2x2 con-tingency table and χ2 test, then groups significant
features together by testing for dependence. These groups of noun phrases for the topic description form the emerging topic.
The Group-Topic model (Wang et al., 2005) slices a 15 year U.N. text corpus into year slices, then runs
a topic-relation model and later compares the trends of topics.
Multiscale Topic Tomography (Nallapati et al., 2007) uses a conjugative priors on the topic param-eters to model the evolution of topics (simliar to DTM, but with conjugative priors). They present a tree-like hierarchy of topics, where topics can be zoomed in on different time periods, and topic trends can be analyzed.
Multi-Modal Retrospective News Event Detec-tion (Li et al., 2005) is an extensive generative model that incorporates content, time, persons, and loca-tion. One challenge of this model is one needs to input the number of events to generate, just like a clustering application.
3 Eventy-Topic Detection
3.1 Training Corpus
Our Eventy-Topic Detection algorithm is demon-strated on a 525 day, 350,000 story Reuters News corpus and a 200 day, 2 billion tweet Twitter corpus. This comes out to average about 6200 stories per 10 day stretch and 10 million tweets a day, respectively. The computation is run over a 30 node Hadoop clus-ter.
3.2 Daily Topic Modeling
Topic Pair Cosine Similarity
20130101:000_20130302:032 .423 20130101:000_20130303:021 .520
...
20130101:000_20140630:003 .662 20130101:001_20130302:017 .852
...
20130101:079_20130630:065 .191 20130102:000_20130301:048 .232
...
[image:3.612.72.311.53.207.2]20130630:079_20130629:050 .924
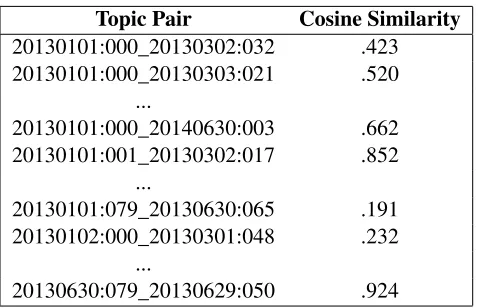
Table 1: Cosine similarity pair mapping table. date1:topic1_date2:topic2→cosineSimilarity
3.3 Similarity Measures
There are D serialized topic models (one for each day), with each topic model havingK topics. Thus there areD ×K total serialized topics, where each topic is represented as a multinomial distribution over words. For each of these topics, the cosine similarity is calculated between that topic and every other (D−1)×Ktopics not in that day. Thus, there are a total of D ×K ×(D −1)×K cosine sim-ilarity calculations. The symmetric KL divergence value can also be calculated for these pairs. The rest of the methodology only describes using cosine sim-ilarity; however it can be easily modified to use the symmetric KL-Divergence.
For each topic (date1:topic1), the topic with the highest cosine similarity score from each of the other D-1 daily topic models is saved (date2:topic2). This creates a mapping table-date1:topic1_date2:topic2→cosineSimilarity, where date1:topic1 and date2:topic2 are con-catenated as the key, and the value is the cosine similarity. An example of what this mapping looks like can be seen in Table 1. The algorithm is outlined in Algorithm 1.
3.4 Smoothing
The cosine similarity values are then smoothed us-ing Loess Smoothus-ing (Cleveland and Loader, 1996). Figures 1- 4 show the before and after of the co-sine similarity graphs smoothed. The bumps that are present in Figure 2(a) and 4(a) do not con-tain monotonically increasing sections, followed by
Data: Serialized Daily Topic Models
Result: Loaded topicCosMap topicCosMap = Map();
foreachDaily Topic Model mdo foreachTopic t in mdo
foreachDaily Topic Model m’6=mdo
topCs = -1; topTopic = null;
foreachTopic t’ in m’do
cs = cossim(t,t’);
ifcs>topCsthen
topCs = cs; topTopic = t’;
end end end
topicCosMap.put(String(m,t,m’,topTopic),topCs);
end end
Algorithm 1:Cosine Similarity Pair Mapping
a plateau, followed by a monotonically decreasing section. Smoothing gives the bumps this property, making it easier to detect.
The main parameter, α, in Loess Smoothing de-termines the percentage of nearest points used in the weighted regressions. Smoothing is done for α= .02, .03, .04, .05, .10 on (x,y) pairs grouped by date1:topic1in the mapping table. Thedate2day index is the x-value, and the cosine similarity is the y-value. Theα that we use in Eventy-Topic Detec-tion is significantly lower than the usual .25 to .5 range. This is done to accommodate the sharp, un-usual bumps that are found for Eventy-Topics in the cosine similarity pair graphs. The larger theα, the more smooth the graph becomes and the bump be-comes less pronounced. These small α values as-sure a pronounced bump in Eventy-Topics as well as mononically increasing/decreasing sections.
3.5 Bump Detection
(a) Reuters Non-Event (b) Reuters Non-Event Smoothedα=.05
Figure 1: Cosine similarity graphs for Reuters Topic 20130604:042. "Bonds"- { percent year bond yields yield bonds market debt billion week points basis ... }
[image:4.612.96.517.214.327.2](a) Reuters Event (b) Reuters Event Smoothedα=.05
Figure 2: Cosine similarity graphs for Reuters Topic 20130426:017. "Boston Marathon Bombing"- { boston police marathon people tsarnaev suspect killed monday bombing tamerlan ... }
(a) Twitter Non-Event (b) Twitter Non-Event Smoothedα=.05
Figure 3: Cosine similarity graphs for Twitter Topic 20140718:037. "Happy Birthday"- { happy love birth-day miss birth-day hope baby beautiful great ya amazing ... }
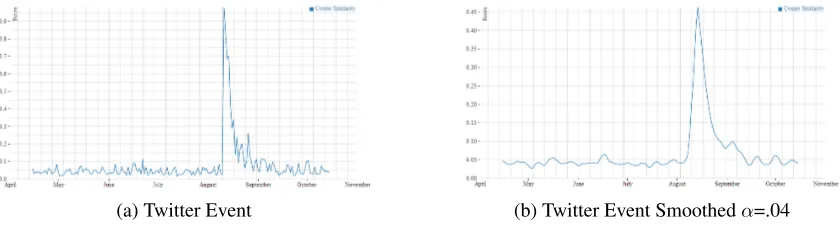
(a) Twitter Event (b) Twitter Event Smoothedα=.04
[image:4.612.96.519.377.486.2] [image:4.612.97.517.534.647.2]the bumps display a monotonically increasing period followed by a monotonically decreasing period. To automatically detect these localized, relatively high cosine similarity bumps we use a novel algorithm called Bump Detection. This algorithm is outlined in Algorithm 2. Bump detection is used on each of the five different smoothed cosine similarity values (α= .02, .03, .04, .05, .10 ). There are a number of variables and parameters used:
• coldLevel - number where all the non-bump cosine similarity values must be below
• hotLevel - number where all the cosine sim-ilarity values in the bump plateau need to be above
• maxRiseT ime- max time it takes to get from coldLeveltohotLevel
• maxF allT ime- max time it takes to get from hotLevelback tocoldLevel
• minHot- the mininum number of cosine sim-ilarity values above thehotLevel
• maxHot - the maximum number of cosine similarity values above thehotLevel
• minHotColdDiffT hresh- parameter where (hotT hresh-coldT hresh) must be greater than in order for the topic to be labeled an ’Eventy-Topic’
The hot cosine similarity values must be continu-ously above the hot threshold. The cold cosine simi-larity values must be continuous on both the left and right side of the rise and fall values, respectively. The minHotColdDiffT hresh is the key param-eter that is used to select only graphs that contain large bumps.
Topic 042 from the model with date 2013-06-04 generated from the Reuters corpus represents a "Bond Topic" (Figure 1). Topic 017 from the model with date 2013-04-26 generated from the Twitter corpus represents a "Happy Birthday Topic" (Fig-ure 3). Both of these fig(Fig-ures show noisy cosine similarity graphs. This is because these topics are present at all/random times in their respective cor-puses and do not correspond to a time specific event. In fact, in almost every serialized topic model in the Twitter corpus, there is a "Happy Birthday" topic with a nearly identical topic-word distribution.
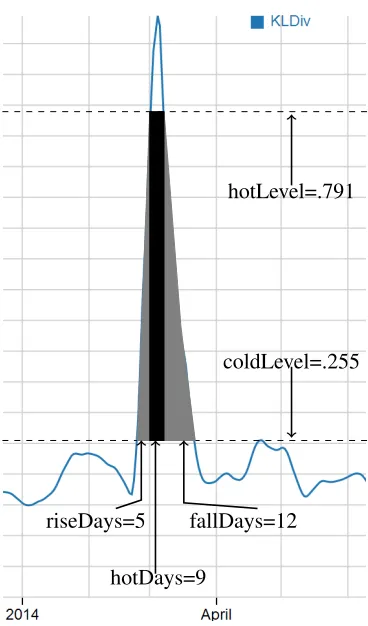
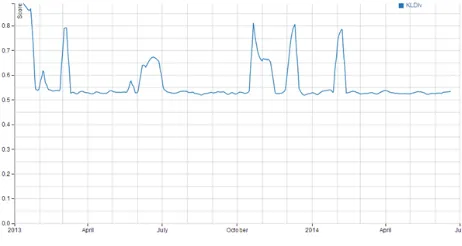
Both the "Boston Marathon Bombing" topic from the Reuters corpus (Figure 2) and the "Robin Williams’ Death" topic from the Twitter corpus (Fig-ure 4) have noticable bumps in their cosine similar-ity graphs around the date of their respective events. Figure 5 depicts the cosine similarity graph from topic 003 from the model with date 2014-08-12 gen-erated from the Reuters corpus. This topic describes an event where Mt. Gox, a bitcoin exchange, col-lapsed in minutes. Figure 6 is a closeup on the bump that includes the variables generated from the bump detection algorithm. The difference between thehotLevelandcoldLevelfor this topics’ cosine similarity graph is .536, which is significantly higher than our usualminHotColdDiffT hreshof .20.
Data: Cosine Similarity Pair Mapping Table
Result: Loaded eventyList cosMap = loadCosMapTable(); eventyList = List();
foreachdate1:topic1t in cosMapdo
hotColdDiff=0.0;
dateCosList = getDateCos(cosMap, t); reverseSortByCos(dateCosList); hotStart =minHot-1;
coldStart =minHot; hotStop =maxHot; coldStop =maxHot+maxRise+maxF all;
fori←coldStarttocoldStopdo
cold = dateCosList[i].cos;
forj←hotStarttomin(i,hotStop)do
hot = dateCosList[j].cos; b1 = (hot-cold) > hotColdDiff; b2 = consecDates(dateCosList,i); b3 = consecDates(dateCosList,j); b4 = consecRiseFall(dateCosList,i,j, maxRise,maxF all);
if b1 and b2 and b3 and b4then
hotColdDiff = (hot-cold);
end end end
ifhotColdDiff>minHotColdDiffT hresh
then
eventyList.add(t);
end end
Figure 5: Mt. Gox Bitcoin Collapse Topic Cosine Similarity Pair Graph with Hot/Cold Lines
coldLevel=.255 hotLevel=.791
riseDays=5
hotDays=9
[image:6.612.71.255.316.629.2]fallDays=12
Figure 6: Closeup on the Bump Detection
3.6 Event Grouping
The final step of generating Eventy-Topics is group-ing similar Eventy-Topics together. In the Reuters Corpus, for example, topic modeling is run daily over the previous 10 days, and thus each of the doc-uments are input into 10 different, daily topic mod-els. This makes the "Boston Marathon Bombing" Eventy-Topic exist in models run between April 16, 2013 and May 2, 2013. For each Eventy-Topic gen-erated by the Bump Detection algorithm, there is al-most surely other near identical Eventy-Topics. Top-ics with cosine similarity values in the hot zone of one Eventy-Topic are likely labeled Eventy-Topics as well. Thus we want to group these Eventy-Topics into one. We grouped these Eventy-Eventy-Topics together by creating a graph where the vertices are the Eventy-Topics. If one Eventy-TopicK1 is in
an-other Eventy-Topic, K2’s, hot zone, then we place
an edge between these two vertices in our Eventy-Topic graph. We then run a connected components algorithm over the graph to generate a list of sets of Eventy-Topics. For each set in the list, the vertex with the highest degree is chosen to represent all the Eventy-Topics in that set.
3.7 Multi-Bump Detection
Some events might happen in two or more sep-arate time periods. The topics that describe these events will not be captured by the Bump detection algorithm because the cosine similarity graph will dip into the cold threshold between the two bumps. To modify single Bump De-tection algorithm, we added an extra parameter minT imeBetweenBumps, which is used to con-trol the minimum time the cosine similarity graph must stay in the cold zone between bumps. This al-gorithm will then allow multiple bumps as long as they are a certain distance apart from each other.
Event Date Topic Words
Mt Gox Bitcoin Collapse 2014-03-22 bitcoin mt gox exchange exchanges currency money Syrian Chemical Weapon Attack 2013-09-02 syria chemical weapons military russia russian assad 2013 America’s Cup 2013-09-24 america cup oracle san francisco ellison zealand bay The Rim Fire 2013-08-22 fire park national area yosemite blaze san francisco
2013 Korea Crisis 2013-04-13 north korea south korean nuclear missile united states tensions Israel Election 2013-01-22 israel netanyahu israeli election state west palestinian
[image:7.612.71.565.54.222.2]Savar Building Colllapse 2013-04-24 building people safety bangladesh stores factory collapse Thailand Coup 2014-05-22 government army thailand military coup political thai martial Typhoon Haiyan 2013-11-17 people aid philippines food typhoon water storm hit haiyan NSA Leak 2013-06-18 government security national information agency snowden nsa Chinese Bird Flu 2013-04-12 people flu bird health china human cases virus strain
Table 2: Some Reuters’ Eventy-Topics Generated
Figure 7: Cosine similarity graphs for Reuters Topic 20130115:052. "Large India Bond Sale" - { percent india gmt eye year inr ns indian oil rupees bond bil-lion ...}
4 Experimental Results
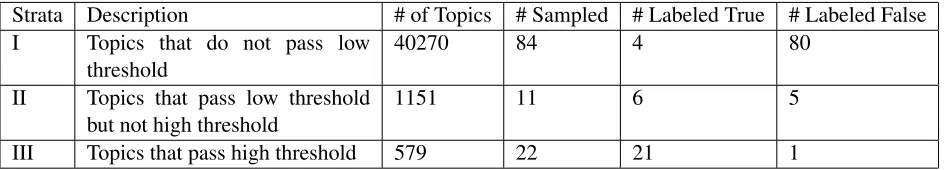
Evaluation of our ETD algorithm was done by annotating a selected set of topics. To expe-dite and strengthen the annotation process we first ran Bump Detection with a relatively low1 minColdHotDiffThresh and then again with this parameter set to a relatively high2 value. The
sam-pling for our annotation set was then divided into 3 strata.
• Strata I: topics that were not labeled as Eventy-Topics with a lowminColdHotDiffTresh.
1lowminColdHotDiffTresh=[.14, .13, .12, .11, .10} forα
= {.02, .03, .04, .05, .10}
2highminColdHotDiffTresh={.24, .23, .22, .21, .20}, for α= {.02, .03, .04, .05, .10}
• Strata II: topics that were labeled as Eventy-Topics with a low, but not a high
minColdHotDiffTresh.
• Strata III: topics that were labeled as Eventy-Topics with a highminColdHotDiffTresh. The details of our sampling for annotation can be seen in Table 3. Note that the annotation was done on topics and not on the results of the Event Group-ing step.
Our annotation set consisted of randomly sampled 84 topics from Strata I, 11 topics from Strata II, and 22 topics from Strata III. The vast majority of topics fell into Strata I (40,270), with the second most in Strata II (1,151), and the rest in Strata III (579).
The reason for dividing the sampled topics into different strata is because the annotation of our Eventy-Topic detection was different in each of these 3 Strata. 80/84 topics in Strata I were la-beled as ’Non-Eventy-Topics’, while 21/22 topics in Strata III were labeled as ’Eventy-Topics’. 6/11 top-ics sampled for Strata II were labeled as ’Eventy-Topics’. Strata II topics were the most difficult to annotate.
Now that we had an annotated set of Topics, we then tuned the parameters in our Eventy-Topic Detection algorithm to maximize performance over the annotated set. The results of our Reuters News corpus Eventy-Topic Detection with optimal parameters3can be seen in Table 4.
3optimalminColdHotDiffTresh=[.20, .19, .18, .17, .16}
[image:7.612.72.303.331.454.2]Strata Description # of Topics # Sampled # Labeled True # Labeled False I Topics that do not pass low
threshold 40270 84 4 80
II Topics that pass low threshold
but not high threshold 1151 11 6 5
III Topics that pass high threshold 579 22 21 1
Table 3: Sampling of Topics from Reuters Corpus for Annotation
Strata Correctly Labeled Incorrectly Labeled Accuracy
I 80 4 .9545
II 8 3 .7272
[image:8.612.72.546.54.139.2]III 21 1 .9545
Table 4: Accuracy of Eventy-Topic Detection with OptimizedminColdHotDiffThresh
5 Discussion
The data sets need to be sufficiently large in size and time horizon in order for our ETD algorithm to be useful. The Reuters News Corpus spanned 525 days, and an even longer spanning corpus could yield bet-ter results. The algorithm also requires significant computation. We ran all our computation on Hadoop in the MapReduce framework and wrote all the data to HBase. On our 30-node Hadoop cluster, the daily topic modeling for the Reuters corpus took approx-imately 1 day, and the cosine similarity calculation took about 2 days. The Bump Detection algorithms for different smoothing parameters and thresholds only took a few minutes.
One limitation of ETD is that it is run on a stale, large corpus of sequential text and not on an online stream of text. Our algorithm can be modified to run the topic modeling, say every 3 hours, on an incom-ing stream of text, and then cosine similarity pairs and Bump Detection.
Further extensions, such as analyzing the shape of the bump, the rise time, and the fall time to de-termine if the Eventy-Topic was expected or not ex-pected, could be very useful.
Our Eventy-Topic Detection algorithm was evalu-ated with a manually annotevalu-ated corpus. This is simi-lar to the way Retrospective Event Detection is eval-uated in previous studies.
References
James Allan, Jamie G. Carbonell, George Doddington, Jonathan Yamron, and Yiming Yang. Topic Detection and Tracking Pilot Study Final Report (1998). Loulwah AlSumait, Daniel Barbara, and Carlotta
Domeniconi. On-Line LDA: Adaptive Topic Mod-els for Mining Text Streams with Applications to Topic Detection and Tracking Data Mining, 2008. ICDM’08. Eighth IEEE International Conference. IEEE, 2008.
David M. Blei and John D. Lafferty. Dynamic Topic Models Proceedings of the 23rd international confer-ence on Machine learning. ACM, 2006.
David M. Blei, Andrew Y. Ng, and Michael I. Jordan. Latent Dirichlet Allocation The Journal of Machine Learning Research, 3 (2003): 993-1022.
Mario Cataldi, Lugi Di Caro, and Claudio Schifanella. Emerging Topic Detection on Twitter based on Tem-poral and Social Terms Evaluation. Proceedings of the Tenth International Workshop on Multimedia Data Mining. ACM, 2010.
William S. Cleveland and Clive Loader. Smoothing by Local Regression: Principles and Methods. Statisti-cal theory and computational aspects of smoothing. Physica-Verlag HD, 1996. 10-49.
Wenwen Dou, Xiaoyu Wang, William Ribarsky, and Michelle Zhou. Event Detection in Social Media Data.
IEEE VisWeek Workshop on Interactive Visual Text Analytics-Task Driven Analytics of Social Media Con-tent. 2012.
Jure Leskovec, Lars Backstrom, and Jon Kleinberg. Meme-tracking and the Dynamics of the News Cycle
Proceedings of the 15th ACM SIGKDD international conference on Knowledge discovery and data mining. ACM, 2009.
Zhiwei Li, Bin Wang, Mingjing Li, and Wei-Ying Ma. A Probabilistic Model for Retrospective News Event De-tection. Proceedings of the 28th annual international ACM SIGIR conference on Research and development in information retrieval. ACM, 2005.
Andrew K. McCallum. MALLET: A Machine Learn-ing for Language Toolkit http://mallet.cs.umass.edu. 2002.
Ramesh Nallapati, William Cohen, Susan Ditmore, John Lafferty, and Kin Ung. Multiscale Topic Tomography
ICWSM. 2009.
Hassan Sayyadi, Matthew Hurst, and Alexey Maykov. Event Detection and Tracking in Social Streams. Pro-ceedings of the 13th ACM SIGKDD international con-ference on Knowledge discovery and data mining. ACM, 2007.
Russell Swan and David Jensen. TimeMines: Construct-ing Timelines with Statistical Models of Word Usage
KDD-2000 Workshop on Text Mining. 2000
Xuerui Wang and Andrew McCallum. Topics over Time: A Non-Markov Continuous-Time Model of Topical Trends Proceedings of the 12th ACM SIGKDD inter-national conference on Knowledge discovery and data mining. ACM, 2006.
Xuerui Wang, Natasha Mohanty, and Andrew McCallum Group and Topic Discovery from Relations and Text
Proceedings of the 3rd international workshop on Link discovery. ACM, 2005.