OF NITROGEN BY PROTONS
Thesis by Donal Baker Duncan
In Partial Fulfillment of the Requirements For the Degree of
Doctor of Philosophy
California Institute of Technology Pasadena, California
An experimental investigation has been made of the cross section for the N14 (p
7
)015 reaction using protons
accelerated by an electrostatic generator. Excitation curves have been obtained from B~N2 targets, nitrogen gas targets, and a thin target formed by proton bombardment of a copper foil in a nitrogen atmosphere. It has been found possible to describe the experimental cross section from.250 to 2.6 Mev by assuming the existence of nine resonances. The parameters appropriate for a theoretical description of
the resonances are determined from the experimental data. The yields from the various resonances are extrapolated to the low energies corresponding to stellar temperatures. It has not been possible to make more than very uncertain as-signment of such properties as the angular momentum and
Research in experimental nuclear physics today is a highly cooperative venture. This thesis could never have been written without the aid of many people. I wish to express my indebted-ness to Professor
c. c.
Lauritsen for the opportunity of workingin Kellogg Laboratory, and to thank him and Professor William A. Fowler for having suggested the subject of this investigation.
I wish to acknowledge most gratefully the active cooperation of Dr. Joseph Perry in designing the experimental apparatus,
taking the data and organizing it. Many discussions with Dr. Fowler, Dr. Perry and Professor Robert F. Christy were very helpful. Among the others who contributed their time are Mr. Robert Day in taking data, Mr. Victor Ehrgott in designing
mechanical apparatus, Mr. Lloyd Gilliland and Mr. George Fastle in doing the machine work, and Mr. William Gibbs in building and repairing electronic components of the apparatus.
I held a fellowship from the Atomic Energy Commission
during most of the time that this research was carried out and a teaching fellowship from the California Institute of Technology for several preceeding years. The research was jointly sponsored by the Office of Naval Research and the Atomic Energy Commission.
I wish to thank all of these and the other members of the faculty of the California Institute of Technology, and the staff of the Kellogg Radiation Laboratory, for having contributed
Title
I Introduction
.
. . . .
.
. . .
.
.
• • • i II Experimental Procedure and Apparatus • • • • l III Experimental Reeul ts • • • • • • • • • • 13IV Discussion of Experimental Results • • . • • 16 Ref erenoes • • • • • . • .
Figures • • • . • • • • .
. . . . •
• • 37I-INTRODUCTION
The aooumulation of experimental data on the properties of
energy levels in the various light nuclei represents one of the
major fields of nuclear research. The primary purpose of this
investigation was to determine the properties of the levels in
015 a~tained by bombarding Nl4 with protons. The particular
re-aot ion studied is also of direct interest as being one of the
postulated sources of stellar energy.
When protons bombard Nl4 there is a certain probability that
they will be captured to form 015 in an excited state. This
com-pound nucleus will decay in all the modes that are energetically
possible; for example by the emission of a gamma ray, a proton, a
neutron, or an alpha particle. In general the probability of
producing each of these reactions can be studied as a function of
proton energy. However, the threshold for the N14 (p ~>ell reaction
is 3.2 Mev and for the N14 (p n)o14 reaction is 6 Mev, so that at
the available proton energies, the only transmutation possible was
by Nl4(p 7)015
Very little experimental knowledge had been previously obtained
on this reaction. Early workers with cyclotrons had observed that
a
minute activity was produoed by bombarding nitrogen with protons (l) but had accumulated little knowledge of the energy dependenceof the activation. Using a Cockroft-Walton machine, Curran and
StruthersC2 ) had investigated the region from 450 to 950 kev. They found an exoeptionally low yield and little evidenoe for any reso
-nant structure. Tangen( 3 ) studied the region from 260 kev to 550
kev, finding a resonance at 277 kev. In their study of the
with protons of 128 kev energy. The completion of an electrostatic
generator capable of reaching energies somewhat above 2.5 Mev
permitted the investigation of the large unexplored energy range
as well as the problem of checking previous work.
Since it was expected that the yield would be quite low, it
was decided to detect the reaction by means of the positrons
emitted by 015 as it decays to N15 , since they can be counted with
a much higher efficiency than the immediate 7 -ray. This process
has other definite advantages. No corrections are necessary for
the 1 -rays produced when protons bombard Nl5 or any other element
present. If any radioactivity was produced by another reaction,
that fact became apparent by the departure of the decay from a 2
minute half life and the cause of the additional counts could be
investigated. The counting process could be carried out without
high voltage on the electrostatic generator with a corresponding decrease in the background counting rate.
It was felt that the choice of the proper target material
would be a particularly critical one. Two possible errors can be
introduced~ There may be an appreciable escape of the radioactive
oxygen from the target into the vacuum system; the target compound
may decompose chemically. Thie latter problem is present in any
work of this kind, but it might be particularly serious in this
case because of the relatively unstable nature of most nitrogen
compounds. By using a gas target chamber containing chemically
pure nitrogen, both of these sources of error are removed.
Un-fortunately, other complications are introduced; the most important
of which is a large spread in the energy of the proton beam after
it has passed through an entrance foil. Solid targets were
structure. Beryllium nitride and a thin nitrogen layer absorbed on a copper foil were used. Yields from these targets were
II-EXPERIMENTAL PROCEDURE AND APPARATUS
The protons were acoelerated by an electrostatic generator
of the type described in many places in the literature.(5) They
were analyzed by a double focusing magnetic analyzer.CS) The
strength of the field was determined by means of a null-reading
magnetometer of the type constructed and used in this laboratory
by Professors C. C. Lauritsen and T. Lauritsen.(?) The type of
magnetometer they described was slightly modified, the null-point
being deteoted by having a light patch reflected from a mirror on
the coil fall on a split photo-tube.
No attempt was made to determine the proton energy absolutely,
the resonances in the Al(p
7
)
and F(p, ~1> reactions at .9933 Mevand .8735 Mev being used as calibration standa.rds.< 8> The proton
energy is given by E = k(mv)-2 where E is the proton energy in Mev,
k is the magnetometer constant, and mv is the voltage drop in
milli-volts produced by the magnetometer balance current as read on a
potentiometer.
The aluminum reaotion proved to be the most useful for
cali-bration. Exoitation curves were obtained immediately before and
after any nitrogen bombardments where the magnetometer constant was
needed accurately. A freshly turned aluminum rod, slightly
rotat-ed after each bombardment to prevent the accumulation of carbon
layers was used as a target. Thick target exoitation curves
show-ed a half width of l kev; this giving the value of the energy
resolution, since the width of the· reaction is known to be less
than 300 ev.(8) A typical curve is given in Figure 1. For a time
changing by as much as .5% during a day. A procedure of
re-oheok-ing the zero every 6 minutes durre-oheok-ing a bombardment was adopted and
results consistent to better than
.1%
were obtained at all latertimes.
All the values of k used in converting the nitrogen bombardment
curves to an energy scale were obtained from bombarding aluminum
with protons. Excitation curves were also obtained for the F(p,a1 )
reaction and for the same aluminum resonance bombarding with ioniz-(M ""'")'
ed hydrogen molecules. No detectable dependence of the magnetometer
constant on energy was indicated by these reactions.
In addition to the energy of the proton, it is necessary to
know the transmutations per incident proton produced by a particular
target. A formula connecting this yield with measurable quantities
can be derived as follows: Let
y
n
'A
t1
ta
00
0
=
=
=
=
=
=
=
number of transmutations produced per proton.
number of protons per seoond incident on the target
deoay constant of ol5
length of time that the target is bombarded
length of time counts are recorded
number of counts recorded
number of counts corrected for previous bombardment
and for background oounts
f = efficiency of particular experimental setup for
detecting positrons
The number of 015 atoms formed at time T during element of
time dT during bombardment is nydT • The number of these present
at a later time t is nye- 'A (t - 'l) d'L. Differentiating this with
a time interval dt as n 'A ye- 'A ( t - T) d r cit. Integrating this
from ' l
=
0 to 'T=
t 1 and from t = t1 to t
=
t2+ t
1 gives as an expression for the total number of positrons produced in a lengthof time t2 immediately after having bombarded for a time t 1,
(l)
It is necessary to correct this for the activity produced during
the previous bombardment.
If
there were o0 counts during a count-ing period equal to t2 and there has been a period t
3 between the
end of the counting period and bombarding a.gain, the correction
term will be
(a)
One thus obtains for the number of counts due to the bombardment in
I
question c
=
c0 - o - b. If f is the efficiency of counting these positrons, a final expression for the yield y in transmutations perproton is
y
=
nf(l - e- 'A tl)(l - e- '). ta) (3)
The quantities to be measured a.re therefore o, t1 , t 2 , n,
A
,
and f.
"
The total number of counts was obtained from a Geiger-Miiller
counter located in a fixed geometrical position. For absolute
work with gas targets a thin window bell-jar counter was used;
for most of the excitation curves a thin wall cylindrical type
counter was used, since its plateau curve seemed to drift leas
the counting rate from a thorium source and the yields at specified
energies periodically.
The lengths of time of bombardment and counting were controlled
automatically by a syncronous motor driving a stepping relay. The
times that were normally chosen were two minutes of bombardment,
three minutes of counting with the electrostatic generator voltage
off, and one minute before bombarding again.
The number of protons hitting the target was determined by
an integrator constructed by Dr. A. B. Brown. The charge went
onto a condenser whose capacitance is C measured in micro!arads,
the integrator being calibrated to fire at a definite voltage,
v
0•The number of times the integrator discharged, N was counted on a
mechanical counter, and the voltage on the condenser at the end of
a bombardment, V, was read directly off a meter on the integrator
which had been previously calibrated. If it is assumed that the
beam strength is constant, the number of protons per second, n,
.isequal to (6.242 x 10¹²) (NVo + V) , V0 and V were calibrated
t
from a .1% meter. The capacitance, C, was measured both by an a.c.
bridge and by a d.c. defl ection method. The latter was done by
Mr. John Reeds. Consistent values were obtained whose average
was 0~287 microfarads.
The half life of 015, which is related to
A
by ATt=
log82 ,
has been previously measured. A tabulation of values is given
below:
TABLE l
Half life Observer
126
±
5 McMillan and Livingston, Phys. Rev.il'
452 (1935)130
±.
6 Huber, Lienhard, and Sherrer, Helv. Phys. Ao ta •.!1·
139 (1944)126
:!.
2 Sherr, Muether, and White, Phys. Rev. 75, 282(1949)
118 :t. 0.7 Perez-Mendez and Brown, Phys. Rev. 76, 689 (1
A measurement of T was also made during this work. A least
squares fit to the data of Figure 2 gives
Tt
= 127 seconds. In calculations Ti = 126 seconds was used.The counting efficiency f is the most difficult quantity to
measure, and was determined directly only for the gas target.
The target chamber for gas targets is pictured in Figure 3, where
it is drawn in quarter section view. The proton beam was limited
by the aperture stop which was 3/16 inches in diameter, the
entrance foil being placed over a hole ; inch in diameter. A
quartz viewing disc was placed over the end during the preliminary
lining-up process and the apparatus adjusted so that· the beam
went through the center of the foil. This was also checked after
bombardment by observing the carbon layer on the foil.
Aluminum was chosen for the entrance foil because it was
readily available in foil form and because no radioactive isotopes
had been observed from proton bombardment at energies below the
threshold for the pn reaction at 5 Mev. At no time was any activi
-ty observed which was ascribed to the aluminum. The thinnest foil
which seemed to offer any hope of being vacuum tight was 0.00015
inches thick, being made available by the Los Alamos National
Scientific Laboratory. It was found possible to make seals with
this material which would stand a pressure differential of half
an atmosphere across the entrance hole. In cases where a greater
pressure differential was desirable, thicker foils were used.
The aluminum foil was "sandwiched" between two brass discs
as indicated in the drawing, the seal being made with 0-rings.
re~uired little manipulation of the foil.
Copper foil 0.001 inches thick was used between the counter
and the target. This was thin enough to make the absorption of
positrons a comparatively small effect, and yet thick enough to
be handled easily and to stop the proton beam at all but the
highest energies available with this accelerator. A vacuum tight
solder seal was made between this foil and a thin brass ring
which fitted over the end of the target assembly.
Standard one-eighth inch needle valves were modified and used as valves. The base was turned down to fit into a slot in
the target assembly, the valve seat being made flush with the
inside bore. The gas was thus confined to a volume which very
closely approximated one of cylindrical symmetry.
The target assembly and counter were surrounded by lead
bricks to reduce the background counting rate. The counter was
attached to a lead brick and held at a fixed distance from the
target.
With this arrangement it should be possible to determine the
counting efficiency and an effort was made to do so. It was found
necessary to consider the variation of counting efficiency over
the face of the counter, the geometrical solid angle subtended by the counter, and the absorption of the positrons in the copper
foil.
The variation of counter efficiency over the face of the bell
jar counter was determined empirically by using collimated natural
beta rays from Radium E. The relative efficiency as determined
from the center of the counter to the point where the particles
enter is defined as r;
6
and ~ are the usual polar anglesdescribing their direction, .P
=
0 and ®=
90° oorreeponding tothe line from the center to the point in question. These angles
are illustrated in Figure 5.
If we neglect the absorption of positrons, the counting
eff icienoy from a cylindrical volume oan now be formulated
analytically. The geometrical picture is given in Figure 5. A
point in the gas cylinder can be described by cylindrical
coordi-I
nates
f
,
¢ ,
andz;
the point on the surface of the counter by rand
¢.
From symmetry the result is independent of¢
t which maybe taken as
o.
The efficiency is then given byf
ro cos - - -® ~ ( r,e>
,
~) ~r~d.¢drdzo a2
(4)
2 [ zo / o
Jrrr
J
oo
cos ®- - ~rd~d¢drdz
o o o o R2
where t, (r,
0
,
~ ) is the measured counting efficiency, assumed to be 100% for r =o,
6
= o
0, andoos ® = (z
1 - Z)R-l (5)
sin
P
{
2 2 2
}
-t
=
f
sin¢
<
r
-
r cosP>
+ r sin¢
The integral in the denominator can be evaluated by inspection;
r and
¢
integrations give one-half of the surface of a sphere,It was necessary to evaluate the integral in the numerator
numerically. Thia has been done using Simpson's Rule, each
of the variables of integration being given three values.
To correspond to the experimental apparatus, it is also
nec~ssary to consider the small volume behind the main cylinder.
The counting efficiency for this volume may be expressed by
simi-lar integrals. Because of the small volume of gas involved, the
numerical integration was done by taking mean values.
For the particular setup used: r0
=
9, ~o=
8, Z0
=
17.472, andz
1=
26.04, where the distances are expressed in sixteenthsof an inoh. The counter was moved baok from the target oonsidera
-Dl.
y more than was mechanically necessary; it was hoped that thiswould increase the accuracy with which the integrals could be
evaluated.
With these values a counting efficiency of the main volume
of 3.71% and of the smaller volume of 0.81% was obtained. Averaging
these according to their corresponding volumes gives an over-all
efficiency of 3.70%.
The correction for absorption of the positrons in the copper
foil was determined empirically. The yield from a thick air target
bombarded at 1.6 Mev was obtained as a function of absorber
thick-ness. An extrapolation was then made to zero thickthick-ness. The thin
window bell jar counter was used to detect the radiation. A thick
target was desirable because of larger counting rates with
increas-ed statistical aocuraoy. An air target of atmospheric pressure was
used because it minimized the errors arising from pressure
not completely vacuum tight absorbers between the target and
the counter. It had been previously determined that oxygen
gave negligible activity at this energy of bombardment, although
considerable 70 second activity was observed from the
bombard-ment of such a target at 2.5 Mev. The results of this experiment
are given in Figure 6. The data indicates a linear decrease of
yield with mg/cm2 of absorber. Assuming this, a least squares
fit was made to the data, giving a correction of 13% to be appli
-ed when data is obtained with one mil copper foil between the
target and the counter. Using these values a final value of
f = 3.30% was obtained for the bell jar counter.
To calibrate the data of the excitation curves obtained
with the cylindrical counter it is only necessary to determine
the yield from this air target with the same counter and geometry
used during bombardment and compare this with the yield using the
bell jar counter. Doing this gives a counting efficiency of 4.41%
for the cylindrical counter.
With the gas target it is not only possible to determine
relative and absolute yields from a particular thickness of target,
but having determined the thickness in atoms per square centimeter
it is possible to make a direct measurement of the cross section
under certain conditions. The yield from a nuclear reaction produc-t
ed by protons of energy E is given by y(E) =
J
o-'(x)n dx , where 0C"'is the cross section, n is the numerical density of disintegrable
atoms, x is the distance the proton has penetrated the target, and
t is the thickness. If this expression is integrated over the
for the yield. In the special case, which was often satisf ied in this experiment, that the variations of cs-' over the energy
ranges corresponding to the target thickness and the spread of energy in the proton beam, this reduces to y
=
O"'nt.The cross section can therefore be determined from a
measurement of t an~ n. A convenient expression for n is given
by n
=
2n0(
PP
) (
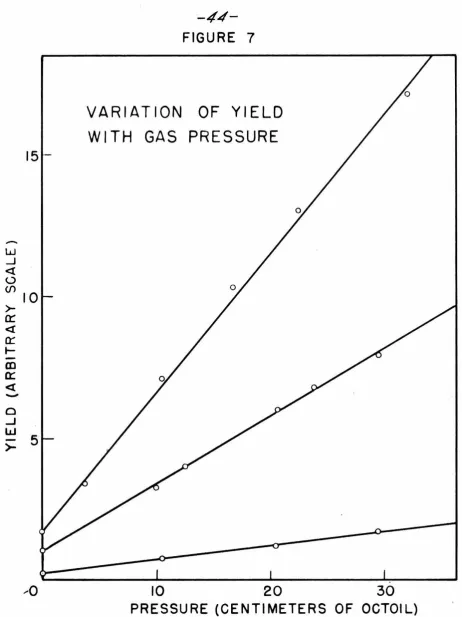
TToJ , where n0 is the Lodschmidt number evaluated a stiz.idard pressure and temperature (p0 and T0), and p and T are the observed pressure and temperature. Throughout all the experiments the temperature remained essentially constant at 24°0. The pressure was measured with an oil manometer filled with ootoil, whose density at this temperature was measured to be 0.979 mg/om2 • The target chamber was first evacuated with oil d~ffusion pumps, flushed several times with nitrogen, filled to a specified pressure as read on the manometer, and thansealed off with the needle valve. The distance t was determined with sufficient accuracy with a micrometer and a depth gauge to be 3.11 cm. The pressure was usually about 22.0 cm. of octoil, in which case nt can be evaluated to be 3.21 x 10¹⁸ atoms/om2 •
It was found that the yield from a given gas target would decrease with time, indicating that some of the nitrogen was
leaking into the vacuum system. This effect was never completely eliminated. A given target was therefore bombarded for only a short time; yields at a specified voltage were taken several
After bombarding for several days, two minute activity was
observed from bombarding the target chamber before it was filled
with nitrogen. This activity was observed to come from the spot
where the proton beam had been hitting the copper foil. To
obtain cross section values it was therefore necessary to obtain
plots of the yield against pressure. These are shown in Figure
7 and are seen to be linear and to have a non-zero intercept. A
least squares fit to this data was used to obtain the best value
of the cross section at these particular energies. From them an
estimate can be obtained to apply to other data to correct for
this "vacuum activity". This correction for a target of
a
a
cm.of oil pressure was found to be 17%.
The thin layer of nitrogen which had been absorbed on the
copper foil thus necessitated an appreciable correction to the
gas target data. It did however furnish a convenient thin target
which was used to investigate the details of the resonant structure.
A target 7 kev thick at 1 Mev and approximately 10% nitrogen was
formed after mioroampere-hours of proton bombardment. This would
seem to furnish a useful technique for forming thin targets where
the target material is available in gaseous form.
For thick target work, pressed Be
3N2 targets were used. The
chemical stability of nitrides in comparison to most nitrogen
compounds indicated they would be most useful as targets. TiN
was used but found to give a 33 minute activity at high proton
ener gies. Beryllium was chosen because it was known to give no
activity upon proton bombardment and the compound was readily
wi th a one mil copper foil over the side to permit the positrons to reach the nearby counter.
The counting efficiency for this setup can be measured as was done for the gas target. Such a determination will still not guarantee that correct values of the absolute yield are
being obtained because of the possibility of the lose of the
radioactive oxygen from the target. It was felt that the determi-nation of the counting efficiency of the gas target setup was most
I I I-EXPERIMENTAL RESULTS
The results of this experiment are most conveniently expressed
by graphs of yield against proton bombarding energy. These will be
given for the various types of targets used.
The excitation curve for the bombardment of Be3N2 is given in
Figure
a.
The data was obtained as relative yield against protonenergy. The ordinate was normalized to give yield in
transmuta.-t ions per inoidentransmuta.-t protransmuta.-ton witransmuta.-th datransmuta.-ta from transmuta.-thin gas transmuta.-targetransmuta.-ts as will
be described below. The curve indicates the general nature of the
oross section for the reaction» several resonances superimposed on
a steadily rising background.
Fresh targets were prepared often, particularly while taking
data near the resonances to minimize the shift in energy scale
from carbon layers on the target. The yield was monitored at
definite energies throughout all the runs to check on decomposition
of the target. Apparently the target did not lose nitrogen during
the few hours a particular target was bombarded.
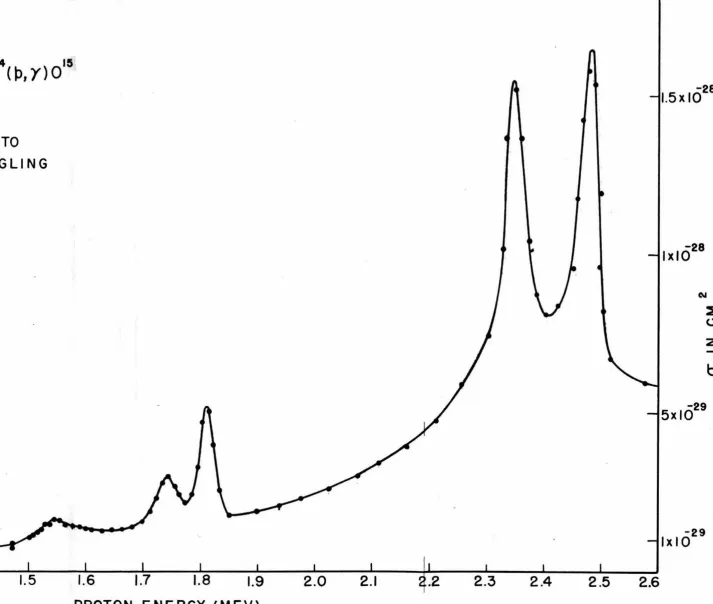
The data from bombarding thin gas targets, approximately 20
kev of proton energy thick, is presented in Figure 9. It has been
corrected for absorption of the positrons, for activity produced
by nitrogen absorbed on the copper foil, and for leakage of nitrogen
from the target chamber into the vacuum system. Yield has been
plotted against the mean energy of the proton beam after passing
through the aluminum foil. This was determined by plotting the
measured magnetometer millivolts at the resonances against proton
energy for these resonances as determined from the Be3N2 excitation
curve and extrapolating between these points with the known
As indicated in the previous discussion, the cross section is directly proportional to the yield from such a target wherever the variation of the oross section is small over the energy range corresponding to the thickness of the target and the spread in energy of the proton beam. This is seen to be valid everywhere except near the resonances and, except near them, the ordinate can be normalized to read directly in square centimeters. It is also approximately true near the small resonance at 1.55 Mev, where the observed width is about twice that of the others. The observed widths of the other resonances, about 40 kev, even with very thin targets, are much larger than the corresponding widths on solid target curves, indicating that the spread in energy of
the beam is large in comparison to the true width. This is ascrib-able to the straggling of the protons in the aluminum and varia-t ions in varia-thickness of varia-the foil over varia-the diamevaria-ter of varia-the beam.
The half life of the activity at each of the resonances and at several of the intermediate points was checked to be the correct value. Particular care was used near the l.55 Mev resonance to guarantee that it was not due to carbon contamination, since the energy of the protons before passing through the aluminum foil
corresponded approximately with the known resonance in the
c
12 (p1) reaction at 1.7 Mev. However there was no measurable 10 minute activity present.At the lower energies a thick target excitation curve was
in Figure 10. It was necessary to use thicker aluminum foil both to support the pressure of the gas and to decrease the proton energy to the lower energies. Yield calibrated by comparison with the Be
3N2 target, is plotted against mean proton energy determined as before by calibrating on the resonance energies and extrapolating between them with the proton range curve. In this case Tangen's value of 277 kev for the very low energy resonance was used.
Professor
w.
A. Fowler also kindly made available data obtain-ed from a NaN02 target bombardobtain-ed at energies between 300 and 1300 kev by the other electrostatic generator in the Kellogg Laboratory. This data, which was particularly useful in the region from 600 to 1000 kev, as well as that obtained with the thick gas target and Be3N2 targets is also given in Figure 10.Excitation curves were also obtained over various energy ranges with gas targets of intermediate thicknesses, one of whioh is given in Figure ll. This curve serves to confirm the general nature of the cross section in this region and to give additional values for the thick target step at the resonances.
The thin layer of nitrogen absorbed on the copper foil was also used as a target; the gas target assembly was employed with the aluminum foil removed to eliminate the spread in energy of the proton beam. No decrease in yield corresponding to loss of nitrogen from the target was observed. However discrepancies in
activity at low energies and near 1.7 Mev were obtained which are
ascribable to carbon on the target. This yield was large enough
to make it impossible to obtain excitation curves of the 1.55 and
l.748 Mev resonances and it was necessary to determine their
structure from other excitation curves. The excitation curves for
various resonances are given in Figures 12, 13, and 14. Because
of the very low yield from this target, statistical errors are
larger than in any other curves. Nevertheless they proved to be
quite useful in determining the details of resonant structure.
IV-DISCUSSION OF EXPERIMENTAL RESULTS
It has been found convenient to describe the properties of
the energy levels in the light nuclei in terms of certain
para-meters. The following are often employed: proton energy to
produce resonance, ER; thick target step, Ymax(oo); cross section
at resonance, Ofli observed resonance width,
I
';
target width,£;
true nuclear Width, f j partial nuclear Width, W 'i; proton Width,
r p; and proton width at 1 Mev without Coulomb barrier, G. In
their paper on gamma radiation Fowler, Lauritsen, and Lauritsen(lO)
give precise definitions of these quantities and in addition show
that if the cross section follows the Breit-Wigner dispersion
formula there are certain relationships between them. Neglecting
the variations of'\ and
r
p
with energy over the energy range ofthe resonance, they obtain the following equations:
Ymax (oo)
=
1f~
r
(6)i
2I
r
=
<
r
2 +~
2)t (7)Ci) 'i
=
2 c, y
(8)
They also quote a general result derived by Bernet et. al, that, independent of the homogeneity of the bombarding protons or the exaot nature of the thin target excitation curve, the integrated area under the curve, A( g ) is given by
(9)
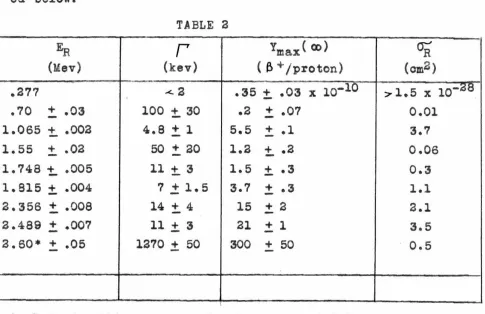
Using these equations the various parameters for the indicated resonances can be estimated from the experimental data. A final tabulation of the properties is given later in Table 2.
The resonance energy, ER' is determined most accurately from the thick target Be3N2 excitation curve. Using the data of the gas target would be inaccurate because the energy loss of the protons in the aluminum is uncertain; the thin target curves are shifted a small amount by the layers of ca:tbon on the surface. Estimates were made of the thick target step at each of the
resonances. It is then easily shown that the proton energy neces-sary to give one half of this step is the resonance energy. In this way values of ER equal to 1.065, l.748, l.815, 2.356, and 2.489 Mev were determined.
Two additional resonances are indicated immediately in the data which cannot be handled this way. The very low energy reso-nance indicated on Figure 10 could not be studied with the solid target because the electrostatic generator would not operate suo-oe esfully at this low an energy. Ta.ngen'e( 3 ) value of 277 kev for
ER at this resonance has been accepted. There is also the small resonance at about 1.5 Mev shown on the gas target curves in
employ the proton energy scale for the gas target curve obtained
as described above. In this way a value of l.55 Mev was obtained.
Relative values for the thick target steps at the first
described resonances are immediately available from the Be3N2 curve, having been obtained in the process of determining ER. To
obtain absolute values it is necessary to determine the geometry
of the solid target assembly or to measure one of the steps in
another way.
The data from the gas target provides a convenient method of
obtaining Ymax(oo) at the l.065 resonance. From Equation 9, the
thickness of the target and the area under the curve determine the
desired quantity. The target thickness in atoms per square
centi-meter has already been found. Multiplying this by the stopping
cross section for nitrogen at this energy gives $ • The area under
the curve was obtained by integrating numerically using Simpson's
rule, a process quite accurate in this case since a large number
of points were available. Since the counting efficiency of the
gas target setup has been evaluated above, this gives immediately
a value for Ymax(oo) at this resonance, which was 5.5 x lo-10
transmutations per proton incident on a N2 target.
Thia process can also be applied to the resonances at higher
energies. However it becomes less accurate because of the
un-certainty as to what part of the yield to ascribe to the
"non-re sonant" background. Thia becomes particularly true at around
2.5 Mev. For this reason, the thick target data was used.
To compare the curves, it is necessary to have the stopping
cross section for nitrogen gas and for the nitrogen in beryllium
For the latter the stopping cross section of beryllium is needed.
This has been measured from 500 kev to 1400 kev by Madson and
Ven-kateswarlu. <13) They have determined the parameters in the
appro-piate theoretical formula to fit the data in this region. The
theory of stopping cross sections is sufficiently well understood
to indicate that their formula will give the correct values when
extrapolated to the higher energies required.
In this way the thick target yield from a Be3N2 target at the
resonance is computed to be 2.8 x
io-
10 transmutations per proton.This figure can then be used to normalize the entire Be3N2
excita-tion curve. The thick target steps at the other resonances
observ-ed on it can be read off directly. In Table 2, this info~ation
has been retabulated as the yield from a N
2 target to give some
kind of uniformity to the values obtained from different targets.
Having determined the value for the thick target step at one
of the resonances, all of the thick target data which was taken
only in a relative way can be normalized. Thus the ordinate was
obtained for the data from the thick gas target, the semi-thick
gas target, and the B93N2 target. In addition the data of
Professor Fowler was normalized to give this value.
The value of Ymax(oo) for the 1.55 Mev resonance can be
ob-tained from the thin gas target in the same way as was done for
the l.065 Mev resonance or from the semi-thick gas target. These
values were quite consistent and their average is given. The value
at the .277 Mev resonance oan be obtained only from the thick gas
target.
The values of the nuclear widths can be obtained only from
the resonances. Since the width of the 1.55 Mev resonance is
about twice the indicated widths of the other resonances on the
thin gas target curve, a value for the width ca.n be obtained from
this curve. In all other oases the energy resolution determines
the widths from this target.
The width of the 1.065 resonance can be determined quite
satisfactorily from the thick target ourve, and this was done.
When this is attempted at the other resonances, the faot that
the step is only a relatively small percentage of the total yield
makes such a.n evaluation leas accurate. For this reason the thin
target curves proved to be more useful.
The observed width from the thin target of the l.065 Mev
resonance was 6.9 kev, compared with the true width as measured
from the
B8-5Na
target of 4.8 kev. This indicates a targetthick-ness of 5 kev. The variation of the thickness with energy is given
by
g
= Ent, where the cross section may be taken with sufficientaccuracy as proportional to that of air. At higher energies this
thickness becomes small in comparison to the observed widths and
only a small correction must be made to determine the true width.
Making this correction to the observed widths, values of rare
determined from each of the thin target curves.
For the resonance at 1.748 Mev the only data available was
from the thick target curve and that was used. For the .277 Mev
resonance no data was obtainable and Tangen•s(3) result that the
width is less than
a
kev is quoted.Having obtained for these various resonances values of
Ymax (CD ) and
r
,
°R
is immediately oaloula.ble from Equation 6.and tabulated in Table 2.
It is now possible to subtract out the yield from these
resonances in both the thin and thick target ourves to look for
an adequate description of the remaining "non-resonant" yield.
The experimental values for the cross section for this yield are
given in Figure 15. The data from the gas target curve represents merely a replotting of the data of Figure 9, the points near the
resonances being omitted or a smooth curve being drawn through
the base of the resonances.
Since dY
<J' ::: t ,
-dE values for the cross section can
also be obtained by differentiating the thick target curve. The
data at high energies obtained in this way is less accurate than
that from the thin gas target and is given only to indicate the
degree of consistency between the two curves. The values at lower energies oould only be obtained in this way. The cross
eeotion in the region from 400 to 900 kev is best obtained by
numerically differentiating the excitation curve of the NaNOa
target.
There are two striking features of this cross section. The
first is that the over-all picture resembles that of a resonance
centered at about 3.5 Mev. An attempt was made to fit the experi
-mental points with a cross section of the Breit-Wigner form
(E - ER)2 +
¢ (
r
p
+r;
>a
(10)
where r'P
=
EiPG. The function EtP has been plotted by Christythe proton adds to the compound nucleus. To fit the observed cross section, G will have to be much larger than any possible values of
r-7
7
,
and the formula can be rewritten in the form(ll)
With such a ourve, ER being chosen equal to 2.5 Mev, it is clearly possible to fit the data at two points, 1.0 and
a.5
Mev. Thia was done and the resultant ourve plotted for a and p wave protons. While the curve for a wave protons had the correct gener-al features, the curve for p wave resembled the data only at low energies and at 2.5 Mev where it had been normalized. For example, the p wave curve gave a cross section four times too large at l.5 Mev. The situation is presumably worse for protons of higher values of l.Having determined that a fit, if any, was to be made with s-wave protons, the process was repeated with various values of ER• What appeared to be the best fit was obtained for ER equal to 2.6 Mev, although the fit of the ourve is not very sensitive to ER.
With this value a theoretical ourve can be drawn which quite
ade-quately represents the experimental points, as can be seen from Figure 15. The "non-resonant" cross section can thus be described in terms of a broad resonance centered at 2.6 Mev. The value of
-29 2
Ojf
can be read directly from the curve as 5 x 10 om • The term Ymax< a>) for such a broad reaonanoe does not have much experimental meaning. A value obtained by substituting in Equation 6 values forwith the other resonances. The actual thick target yield at any
energy from this reaction can be obtained from Figure 8.
A second feature of the cross section as presented in Figure
15 is the anomaly at about 700 kev. It is also present when the
cross section is obtained from the thick gas target although it
is not as striking, being smeared out over a larger energy range.
The fit to the dispersion formula has been so satisfactory at
energies above 900 kev that this can most reasonably be explained
by assuming a small resonance in this region. A resonance at 700
kev with a:! = l x lo-30 cm2 and
r'
=
100 kev will fit the data. AR
value of Ymax( CD) can then be calculated.
A complete description of the experimental cross section from
.a5o
to 2.6 Mev is therefore obtained by giving the values of ~·{ , Ymax( to), and
°i
for various resonances. This data istabulat-ed below.
TABLE 2
ER
I
Ymax (to)OR
(Mev) (kev) ( f> +/proton) (om2)
.277 -<.. 2 .35
t.
.03 xio-
10 ,..1.s x lo-~8.70
!.
.03 100t.
30 .2-
+ .07 0.01 1.065 +-
.ooa
4.8:!:.
l 5.5-
+ .1 3.7 1.55 +-
.oa
50:!:.
ao
1.2 +-
.a
0.06 l.748 t. .005 11±..
3 1.5±
.3 0.3 l. 815±
.004 7,:tl.5 3.7 ± .3 1.12. 356
!.
.008 14:t.
4 15 ±2 2.1 2.489 + .007-
11±
3 21 ±1 3.5a.so•
+-
.05 1370±
50 300 ± 50 0.5 [image:30.558.40.525.403.717.2]Before prooeeding with the disoussion of these quantities,
it will be well to consider the probable errors which have been
ascribed to them. The resonance energy is known with the greatest
percentage precision. Its accuracy depends on the magnetometer
constant and upon the precision with which the resonanoe energy
oan be determined from the excitation ourves. The value of k can
be determined to within 0.02% from the aluminum ourves. Using the
same value of k, as was done in all oases except with the Be_,N2 ourve introduces a 0.1% error. The accuracy of determining the
magnetometer millivolts for resonance varies for the different
resonances. Where the value can be determined from the B93N2 curve, the value obtained has a probable error of &bout 0.1%. The value
at the 1.55 resonance, being determined from the gas target, has a
probable error of about 20 kev; the values at the broad resonances
at .70 and 2.6 Mev about 30 and 50 kev respectively. The layers
of carbon on the target introduce an additional source of error.
Thia was ap~reoiable only in the case of the values determined
from the B~N
2
• The frequent changing of targets and the use ofa liquid air trap are believed to have limited this error to l
kev or less. This way the probable errors on ER given above were
determined.
In disoussing the quantities involving yield, it is neoessary
to know the probable errors of o, n,').., and f. The statistical error in the counting rate is given wherever possible on all of
the curves. Where none is indicated, it is less than or equal
to the size of the points. The integrator is believed to introduce
a negligible error. As indicated above, A is known to 2%. Thus
it should be possible to obtain moderately accurate relative values
the largest probable error comes from the uncertainty arising in
drawing the appropriate curve through the experimental points.
For example, with the B~N2 curves, the statistical uncertainty
was usually only about 1%; but with a thiok target step about 20%
of the total yield, this introduces an appreciable uncertainty.
The relative errors vary from resonanoe to reaonanoe, but are
usually about 2 - 10%. Estimates are given above.
There are additional unoertaintiea in the absolute value of
these quantities. The capacitance is known to
i%.
The correctionsfor "vacuum activity", leakage of nitrogen from the chamber, and
absorption of positrons in the copper foil are believed to be well
known, introducing an error of a few percent at most. The largest
uncertainty is in the counting efficiency, f. The quantities
enter-ing Equation 4 for its evaluation, the countenter-ing efficiency over the
face of the counter and the geometrical distances, are known with
sufficient precision. However the evaluation of f involves four
repeated integrations. By carrying out calculations with similar
but integrable functions, it is estimated that each of the
inte-grations is accurate to 2% or better. Thus the total error should
be less than 8%. One can therefore place an error on the over-all
absolute normalization of 10%.
The probable errors on the widths come from the inaccuracies
involved in fitting a curve to the points. The curves from the
thin layer gave a very low yield, so that the statistical errors
are moderately large as indicated. Estimates are given for the
errors.
There are several possible corrections which have not been
the counting rates were sufficiently small, no appreciable error
was made in neglecting the dead time of the counter.
It has been assumed that the distribution of ol5 is uniform throughout the gas target; this is certainly not true initially
since the gas is formed in the center where the beam passes through.
The diffusion problem for such a case can be solved in a more or
less rigorous manner; however an order of magnitude calculation
can be used to demonstrate that the time for the concentration to
become uniform is quite small. The order of magnitude of the time
is given by Einstein's equation as
t
=
(12)-4
where I'\.= l.75 x 10 poise is the coefficient of viscosity,
a
=
1.9 x 10-a om is the molecular radius, x=
l om is the radiusof the chamber, n
=
2 x 10¹⁸ molecules cm-3 (for a typical experi-ment) is the molecular density, R • 8.3 x 10⁷ erg deg-1 mole-1 is0
the gas constant, and T = 300 is the absolute temperature.
Carry-ing out the arithmetic gives t
=
2.5 x 10⁻³ seconds, so that theassumption of uniform density introduces a negligible error.
Various other quantities can now be calculated which are of
considerable interest. The quantity <U'} which is defined as
- l
U)
r
rfr
p (r'i
+r
p> can be determined for each of the resonances.r1
can be calculated for the various types of gamma radiation which are possible and is always of the order of several electron voltsor less. The observed widths,
r
=r
p +r
"I
,
must therefore beequal to
r
p,
so that (J.)"I
=
U)r7
.
results is the width for proton emission at 1 Mev without barrier,
G, which is related to the observed width by the previously
mention-ed equation r = EiPG. The values of G obtained will depend on the
l value of the protons initiating the reaction, which in general
is not known. It is therefore necessary to give values
oorI"espond-ing to a, p, and d waves.
In this way values have been obtained for each of the quantities
entering the Breit-Wigner formula for the cross section, and it is
possible to calculate a value of the cross section at any energy
J
due to each of the resonances. The total cross section will not
necessarily be the sum of these values since it is the amplitudes
and not the absolute values of the waves which are additive.
Never-theless it is possible to obtain some idea of the contribution to
the total cross section that each of the resonances makes at a
particular energy.
It is of considerable interest to know the value of the cross
section at very low energies, because of the importance of the
re-act ion as a possible source of stellar energy. For this reason the
value of the cross section at 128 kev and 28 kev for each of the
resonances has been calculated. The value at 128 kev is given
be-cause the total cross section has been measured at this energy.C 4)
The value at 28 kev is given because this is the approximate energy
of interest in stellar calculations. In each case the resonances
have been assumed to be due to a wave protons, since this gives an
upper limit on the value obtained. As we shall see the resonances
that make an important contribution do seem to be caused by s wave
protons.
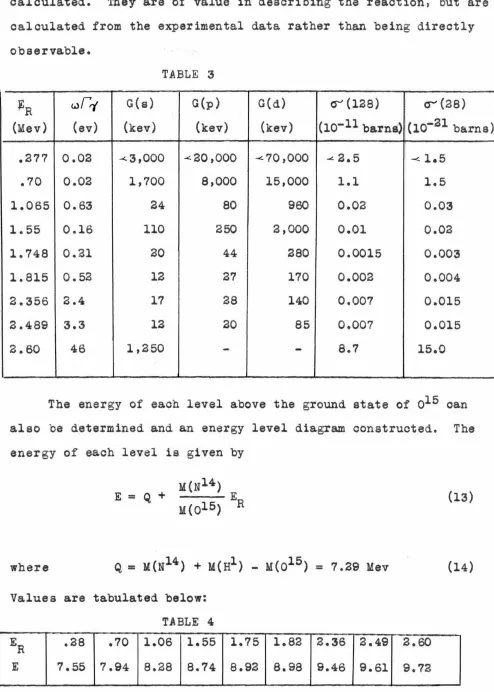
calculated. They are of value in describing the reaction, but are
calculated from the experimental data rather than being directly
observable.
TABLE 3
~R wrr( G(s) G(p) G(d) CJ' (128) o-' (28)
(Mev) (ev) (kev) (kev) (kev) (10-11 barna) (10-21 barns)
.277 0.02 ~3,000 ...:.20
,coo
-<70,ooo
-< 2. 5 -<. l.5.70 0.02 1,700 8,000 15,000 1.1 1.5
1.065 0.63 24 80 960 o.oa 0.03
1.55 0.16 110 250 2,000 0.01 o.oa
1.748 o.a1 20 44 280 0.0015 0.003
1.815 0.52 12 27 170 0.002 0.004
2.356 2.4 17 28 140 0.007 0.015
2 .489 3.3 12 20 85 0.007 0.015
2. 60 46 1,250
-
-
8.7 15.0The energy of each level above the ground state of ol5 can
also be determined and an energy level diagram constructed. The
energy of each level is given by
(13)
where (14)
Values are tabulated below:
TABLE 4
ER .28 .70 l.06 1.55 1.75 1.82 2.36 2.49 2.60
[image:35.556.36.530.63.755.2]-lO The sum of all the cross sections at 128 kev is l.24 x lO
barns, whioh is to be compared with the measured value of 7 x io-lO
barns. If these values are both believed to be correct, this is
evidence for an additional resonance at low energies. It is quite
possible that there exists a level which would make an appreciable
contribution at 128 kev but whioh would not contribute to the
cross section at stellar energies. Should this be the case, the
correct value of the cross section at 28 kev would be 9 x lo-30
barns, instead of 6 x lo-19 as inferred from the low energy work.
Such a low cross section would make it exceedingly difficult to
explain the observed energy release at stellar temperatures with
the carbon-nitrogen cycle. Since the levels of 015 are quite
closely spaced at this excitation energy, the probability that
there is a resonance in the stellar region is not negligible; such
a resonance would make any extrapolation of values from energies
where the cross section is measurable incorrect.
The widths for rt-ray emission for ea.oh of the levels have
been determined. If the energy of the ')-ray were known, this
would permit the evaluation of the associated oscillator strength.
The determination of the 1 -ray spectrum was not attempted. The
major problems which make such a datermination a very difficult
experimental problem are the low arose section, making the
ac-cumulation of sufficient points a lengthy and inaccurate process,
and the presence of 1 -rays from the Nl5(p, a.7 )012 reaction which
gives a larger thick target yield from a non-enriched target than
the desired reaction. There are also very large competing
?
-ray yields from any of the targets which were found to be
target and from the Al(p
1
)
reaction in the oaae of the gas target. To make more precise the nature of the difficulties in makingsuch a measurement, consider the expected results from an
experi-ment, assuming there is no competing radiation except from the N15•
The cross section for the N15(p,
~7
)0
12 reaction at l.065 Mev,the most favorable energy for the experiment, is relatively constant
l t l
~
lo- 26 3 (l5 ) M lti l i thi b th b and equa o • Q x om • u p y ng s y e aun-danc e of N15 gives a relative cross section of 4.3 x
io-
39• Thieis to be compared with the resonant cross section for the Nl4
re-action of 3.7 x
io-
28 and a non-resonant arose section of 4 x l0-30.
The most favorable target thickness would be equal to the resonance
width, 5 kev. If such a target could be made from KON, KN03 , TiN,
or CaCN2 with about 30% nitrogen, the yield from the desired reso-nance would be one half the thick target step, or 9 x lo-11 quanta
per proton. The yield from the N15 reaction would be l.3 x lo-11 •
With the maximum beam strength and solid angle used during this
experiment and assuming the transition is to the ground state giving
a gamma ray of 8 Mev energy which oan be counted with 6% efficiency,
a counting rate of about 350 counts per minute would be expected.
Even under these most favorable of assumptions, the accumulation of
sufficient data to determine the energy spectrum of the gamma ray
by any of the usual techniques would be exceedingly diffiault.
Gamma ray widths oan be described theoretically in different
ways. The fundamental formula for eleotromagnetio radiation is
(15)
For electric multipole radiation Bethe(lS) expresses Dmn in terms of the oscillator strength by
(16)
Fowler, Lauritsen, and Lauritsen(lO) express Dmn in terms of the ratio of r to r0 , where er1 is the matrix element for the electric
21 pole radiation and r
0 is the classical electron radius. Bethe's
definition has the advantage in the case of dipole radiation that an expression for L:lfno
I
,
the sum of the oscillator strengths for all levels to the ground state, is calculable and gives an upper limit on the value of1
1 .For the case of electric quadripole radiation, the sum rule applies to fmn(h v )-1, so this would seem to be the more appropriate quantity to discuss. For magnetic dipole radiation, )l/ )1N is
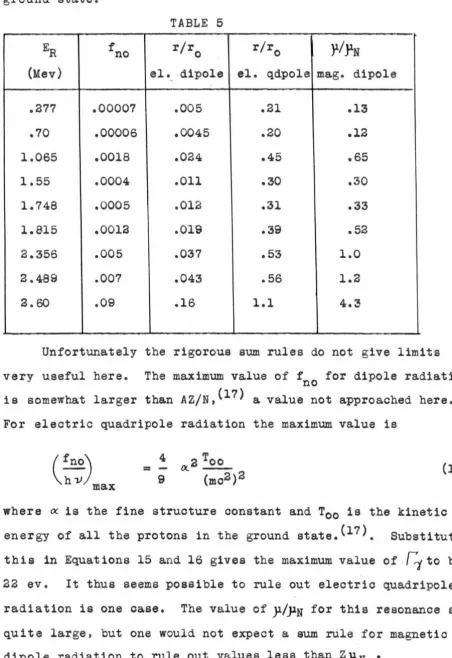
evaluated. The quantities tabulated below for each resonance are therefore fno' r/r
0 for electric dipole, r/r0 for eleotrio
quadri-pole, and
y.
/
Jl
N •
They are calculated with the statistical weight factor, cu , set equal to l. If detailed use is to be made of them, appropriate values of ~ oan be used. The formulas used for calcu-lation arefno = 0.191
r,..,
(h v )-2r/r
0• 0.7
1'1
i
(h v)-3/3 electric dipole
r/ro= 7
r1
¢-
(h v)-5/ 4y
l
y.
N
=la
f1
i
Ch
-v
>-a/a
electric quadripole (17)
ground state.
TABLE 5
ER f no r/r0 r/r0
)1
/
Jl
N
(Mev) el. dipole el. qdpole mag. dipole
.277 .00007 .005 .21 .13
.70 .00006 .0045 .20 .12
l.065 .0018 .024 .45 .65
1.55 .0004 .Oll .30 .30
1.748 .0005 .01a .31 .33
1.815 .0012 .019 .39 • 52
2.356 .005 .037 .53 1.0
2.489 .007 .043 • 56 l.2
2. 60 .09 .16 1.1 4.3
Unfortunately the rigorous sum rules do not give limits very useful here. The maximum value of fno for dipole radiation
is somewhat larger than AZ/N,Cl7 ) a value not approached here.
For electric quadripole radiation the maximum value is
( fno)
hv
max4 2 Too
()(
-(mo2)2 (18)
=
-9
where ~ is the fine structure constant and T00 is the kinetic
energy of all the protons in the ground state.< 17
>.
Substituting this in Equations 15 and 16 gives the maximum value of /1 to be 22 ev. It thus seems possible to rule out electrio quadripoleradiation is one case. The value of p/JlN for this resonance seems quite large, but one would not expect a sum rule for magnetic
[image:39.553.41.494.67.726.2]I
From the values of G given in Table
a,
it is possible to make oertain statements concerning the 1 values of the protons. Values of G corresponding to a half life less than the transit time of a proton across the nuclear diameter are·not possible. This gives an upper limit to G of abouta
Mev. It does not seem possible to give a lower limit, but a very rough value may be tentatively taken as 100 kev. If G is to be confined to these limits, the 1 values of the protons for the various resona.noes can be determined as follows:TABLE 6
E .277 .700 l.065 1.55 1.748
I
1.815 2.356 2.489 2.60 R:>' d 'I -;.-d
1 s s p-d s-d :>'d 7d s
The s wave assignment for the .277 Mev resonanoe assumes that the observed width is greater than O.l kev. Although this seems reasonable from Tangen's published ourve, it must be remembered that the only value he gives is that the width is less than 2 kev.
The ground state of N14 has a spin l, but the parity is not definitely known. It has always been assumed to be even, but Wigner and Feingold(lB) have recently found that they are able to fit the half life of
c
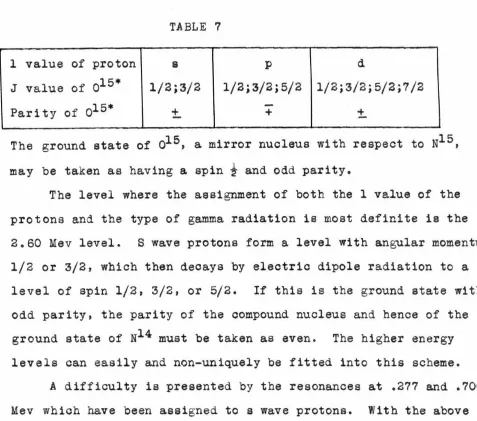
14 more consistently into a scheme of beta decay if the parity is taken as odd. The ground state of Nl 4 oan then be taken for future discussion as spin 1 and parity±.TABLE 7
1 value of proton s p d
J value of 015* 1/2;3/2 1/2;3/2;5/2 1/2;3/2;5/2;7/2
Parity of 015*
~
~ + ~
The ground state of 015, a mirror nucleus with respect to N15 ,
may be taken as having a spin
t
and odd parity.The level where the assignment of both the l value of the
protons and the type of gamma radiation is moat definite is the
2.60 Mev level. S wave protons form a level with angular momentum
1/2 or 3/2, which then deoays by electric dipole radiation to a
level of spin 1/2, 3/2, or 5/2. If this is the ground state with
odd parity, the parity of the compound nucleus and hence of the
ground state of N14 must be taken as even. The higher energy
levels can easily and non-uniquely be fitted into this scheme.
A difficulty is presented by the resonances at .277 and .700
Mev which have been assigned to s wave protons. With the above
assignment of parity to N14 , these would be l/2 or 3/2 levels with
even parity; however, the corresponding values of the oscillator
strength for electric dipole radiation are only 7 and 6 x lo- 5
respectively. Although such values are presumably possible, they
do seem to be unusually small for the transition to the ground
state which would be allowed. 14
If the ground state of N is taken as spin 1 and odd parity,
the radiation from the 2.6 Mev resonance must be magnetic dipole
if it is to the ground state; or if it is eleotrio dipole as the
[image:41.554.40.517.52.473.2]