Munich Personal RePEc Archive
International Income Risk-Sharing and
the Global Financial Crisis of 2008–2009
Balli, Faruk and Basher, Syed Abul and Balli, Hatice Ozer
12 January 2013
Online at
https://mpra.ub.uni-muenchen.de/43720/
International Income Risk-Sharing and the
Global Financial Crisis of 2008–2009
∗Faruk Balli† Syed Abul Basher‡,§ Hatice Ozer Balli¶
January 9, 2013
Abstract
We examine the impact of the global financial crisis on the degree of international income
and consumption risk-sharing among industrial economies using returns on cross-border
portfolio holdings (e.g., debt, equity,FDI). We split the returns from the net foreign
hold-ings as receipts (inflows) and payments (outflows) to investigate which of the two sides
exhibited the greater resilience for income risk-sharing during the recent crisis. First, we
find that debt delivered better risk-sharing than equity, mainly reflecting the deficit
deterio-ration inEMUcountries during the post-crisis period. FDI, by contrast, did not correspond to
noticeable risk diversification. Second, separating output shocks into positive and negative
components reveals that debt holding receipts (equity liability payments) performed better
under negative (positive) realizations of the shock variable. Third, the unwinding of capital
flows resulted in a sharp fall in income dis-smoothing via the debt liability channel in the
newEUcountries.
JEL Codes: F36.
Keywords: Financial crisis, international portfolio diversification, income smoothing.
∗We would like to thank an anonymous referee for constructive comments and Megan Foster for help with
proofreading. The views expressed here are those of the authors and do not necessarily reflect the official view of the Qatar Central Bank. The errors that remain are solely ours.
†Corresponding author: School of Economics and Finance, Massey University, Private Bag 11-222, Palmerston
North, New Zealand. Phone: +64 6 356 9099 ext. 2330; Fax: +64 6 350 5651. E-mail: F.Balli@massey.ac.nz.
‡Department of Research and Monetary Policy, Qatar Central Bank, P.O. Box 1234, Doha, Qatar. E-mail:
bashers@qcb.gov.qa
1
Introduction
The financial crisis and global recession of 2008–2009 was associated with a significant
dete-rioration in economic activity across developed economies. In particular, the crisis has put
significant pressure on public finance in several mature economies. Between the end of 2007
and the end of 2010, average budget deficits in OECD countries increased from 1% to 8% of
GDP (gross domestic product) and gross government debt rose from 73% to 97% ofGDP.1 This
was the outcome of a multitude of factors including the great upheaval in the global financial
markets, a general loss of confidence, a dramatic collapse in world international trade and hence
a contraction in global output growth.
One particular aspect that played a central role in the ongoing world financial crisis was the
deepening of financial globalization, which is typically measured by using a proxy consisting of
the ratio of cross-border assets and liabilities (averaged) overGDP.2 Although, from a historical
perspective, financial globalization is not a new phenomenon,3 the depth and breadth of
glob-alization has been accelerated particularly by the formation of the European monetary union
in 1999. As a result, a wider range of financial instruments has created additional investment
opportunities allowing investors to spread their income risk. According to Deutsche
Bundes-bank (2009), total cross-border assets and liabilities documented worldwide amounted to some
US$192 trillion at the end of 2007 – reflecting an almost four-fold increase compared with 1999.
However, the global financial crises of 2008–2009 abruptly halted this decade-long expansion of
the global capital market. According to the McKinsey (2009), the total value of global financial
assets fell from $194 trillion in 2007 (equivalent to 343% of worldGDP) to $178 trillion by the
end of 2008. This decline was the largest compared with the previous economic and financial
turmoil seen in 1990–91, 1997–98 and 2000–02.
A growing body of empirical studies has documented that greater financial globalization
leads to increased risk-sharing, at least, among industrial countries – see Kose et al. (2007) for
a summary of findings of related papers. However, much of these findings are related to an era
of financial upturn (fueled by the creation of the European monetary union, EMU), and does
not provide a complete picture of the risk exposure during financial market downturn. Indeed,
1
See Davies and Ng (2001) for a graphical illustration.
2See, among others, Lane and Milessi Ferreti (2007) for an empirical illustration based on this measure. We
use the similar measure in this paper. For a list of alternative measures used in the literature see Schmukler (2004).
3
“the impact in terms of diversification will be beneficial to the extent that globalization does
not lead to an increase of the degree comovement between international stock markets” (Beine
et al., 2010, p. 184). This is the so-calledknife-edge property of the financial markets, whereby
financial interconnections serve as a shock absorber (i.e., risk-sharing) within a certain range, but
beyond the tipping point, interconnections serve as a shock amplifier (i.e., risk-spreading) – see
Tasca and Battiston (2011) for further details. Recent research by Christoffersen et al. (2012)
conclude that the benefits of international diversification across both developed and emerging
markets have lessened because of a gradual increase in the average correlation of these markets.
Moreover, Beine et al. (2010) show that the ongoing globalization process has increased the
probability that the two markets will crash simultaneously. Relatedly, Ibragimov et al. (2011)
derive conditions under which it may be socially optimal to have financial intermediaries hold
less diversified portfolios in order to have a lower probability of widespread collapse. These
findings cast doubt on the desirability of international portfolio diversification, particularly
during market downturn when investors need diversification benefits most (Vermeulen, 2011).
Although it is still early to reach rock-solid conclusions whether to blame globalization for
the severity of the ongoing global financial crisis, interestingly, the spread of the recent financial
crisis from the US to other countries was itself an example of international risk-sharing. Indeed,
as documented by Mendoza and Quadrini (2010), the impact of the crisis on the US economy
has been smaller because the crisis has been shared with other countries. Nonetheless, it was
not an example of perfect risk-sharing, as some countries were heavily hit than others. On the
other hand, the lack of a fiscal risk-sharing mechanism at the Euro area level has been identified
as one of key factors behind the ongoing Eurozone’s sovereign debt crisis (Allard, 2011). The
global financial and economic crisis of 2008–2009, therefore, marks an opportune time to revisit
the issue of international risk-sharing.
In this paper, we study the impact of financial crisis on the degree of international
risk-sharing for a set of industrial economies using annual data over the 1999–2009 period. We
consider income-based risk-sharing based on gross national income (GNI), which is proxied by
“income betas” estimated by the slope of per capitaGNItoGDPgrowth, both taken as deviations
from aggregate (or world) levels. We disaggregated the difference between GDP and GNI (i.e.,
net factor income flows) as the receipts and payments of the portfolio holdings (debt, equity,
FDI) to examine (i) which forms of assets delivered better risk-sharing and (ii) whether liability
a shock decomposition of GDP(positive versus negative aggregate shocks) to assess the relative
contribution of the risk-sharing channels in light of the financial crisis. We also check the
sensitivity of our analysis by estimating the contribution to consumption risk-sharing via factor
income flows. In our analysis, the impact of the 2008–2009 financial crisis is captured by simply
comparing the results between the 1999–2007 and 1999–2009 periods. Finally, albeit limited
by data availability, we perform a similar analysis for the new EUcountries and compare them
vis-`a-vis their EMUcounterparts.
The rest of the paper is organized as follows. Section 2 presents the empirical methodology.
Section 3 presents the data and empirical results. Section 4 documents risk-sharing among
the group of new EU countries. Finally, Section 5 concludes. However, before summarizing
the findings of our results, let us take a detour through the recent empirical literature on
international risk-sharing.
1.1 Related literature
For brevity, in this sub-section, we summarize the findings of some recent empirical work related
to this paper. Our paper is closely related to the category of studies that employ various
regression models to measure the extent of risk-sharing and to examine the impact of financial
flows on the degree of risk-sharing. Our empirical work has particular relevance for studies that
routinely monitor the progress of financial integration in Europe (see, e.g., European Central
Bank, 2011).
Sørensen et al. (2007) propose a general framework to examine how financial integration
facilitates international risk-sharing. Employing data over the period 1993–2003, they find
that larger holdings of foreign assets are associated with better risk-sharing for countries in the
European Union (EU) and the Organization for Economic Development and Cooperation (OECD),
while foreign liabilities did not yield any noticeable risk-sharing. Somewhat similar results were
obtained by Demyanyk et al. (2008), who extended the Sørensen et al. (2007) study using
additional data (1995–2006) and more countries. They notice that the effect of diversification
on risk-sharing is roughly similar for foreign assets and liabilities. Balli et al. (2011), on the
contrary, find that increased holdings of foreign assets caused income dis-smoothing during
2001–2007, the years surrounding the introduction of the Euro. They interpret their result as
a consequence of increased business cycle synchronization across EMUand EU countries.
market economies, find that net capital gains behaved in the required countercyclical way
(par-ticularly since the mid-1990s) but for only the industrial countries, whereas emerging market
economies did not seem to benefit from such risk-sharing. A similar result was obtained by Kose
et al. (2009). Employing annual data over the period 1960–2004 for a sample of 69 countries
– 21 industrial and 48 developing (of which 21 were emerging economies) – they find that only
industrial countries had attained better risk-sharing outcomes during the recent period of
glob-alization, whereas developing countries had, by and large, been shut out of this benefit. These
findings suggest that financial globalization has, so far, led to asymmetric benefits globally.
Recently, Balli et al. (2012) examine risk-sharing through capital gains forEMU, EUand other
OECD countries over the period 1992–2007. They find that risk-sharing from capital gains is
higher than risk-sharing from factor income flows, whereas saving remains the most important
source of overall international consumption risk-sharing in the Euro area.
Our main finding is that, for risk-sharing through cross-border investments, the factor
in-come inflow channel (the sum of debt, equity and FDI holding receipts) was a better shock
absorber than the factor income outflow channel (the sum of debt, equity andFDIliability
pay-ments) during the current financial crisis. In the aftermath of the crisis, receipts from debt
securities resulted in a more potent channel of income risk-sharing than the receipts of equity
securities. However, the increased risk-sharing through debt receipts itself was a by-product
of the financial crisis, because to offset the decline in equities, industrial economies increased
their debt issuance to stimulate domestic economy. Results are very similar when
consump-tion risk-sharing is considered. AlthoughFDIholdings did not correspond to noticeable income
smoothing, it did support higher consumption smoothing in OECD countries in the run-up to
the financial crisis. A decomposition of output shocks revealed that debt receipts (equity
pay-ments) performed better under negative (positive) output shocks. In the new EU countries,
the unwinding of capital flows resulted in a sharp fall in income dis-smoothing via the debt
payment liability channel, which appears to be consistent with the switching of their average
external balance from deficit to surplus following the intensification of the global financial crisis.
Moreover, receipts from debt holdings played a less potent channel of risk-sharing in the new
2
Methodology
One simple way to analyze income smoothing from internationally diversified portfolios is to
look at the difference between a country’sGNIandGDPover time. Consider the following identity
GNI=GDP+rDAD−rFAF
where AF is the stock of domestic assets owned by foreign residents, rF is the rate of return
on these assets andAD and rD are domestically owned foreign assets and the return on those,
respectively. The term rDAD−rFAF is widely known as the net factor income (NFI). If NFI
is not perfectly correlated with GDP, the GNI of a country may be less variable than it would
be in the absence of international assets, thus partially insulating income streams against the
idiosyncratic fluctuations in GDP. Based on this reasoning, Sørensen et al. (2007) propose an
empirical framework for testing the extent of international income smoothing using the following
panel regression
∆ loggGNIit=vi,t+βf∆ logGDPgit+ǫi,t (1)
where ∆log^GDPit is the annual change in GDP per capita in constant prices minus the
union-wide (or aggregate) counterpart (∆logGDPt), ∆ logGNIgitis the annual change inGNIper capita in
constant prices minus the aggregate counterpart (∆logGNIt), andνi,t and ǫi,t are constant and
error terms, respectively. Depending on the occasion, the aggregate variable corresponds either
toOECD,EMU orEUmember countries. The reason for removing aggregate output fluctuations
from country fluctuations is to isolate the smoothable output fluctuations. The slope coefficient
βf measures the average co-movement of a country’s idiosyncraticGNIgrowth (i.e., the deviation
from aggregate/union-wideGNIgrowth) with idiosyncraticGDPgrowth in yeart. The lower the
βf, the higher the income risk-sharing and vice versa. Therefore, the scalar 1−βf measures
the amount of income smoothing via net factor income flows. The metric 1−βf will take the
2.1 A decomposition of income smoothing via net factor income
Following Balli et al. (2011), we decompose income smoothing via the NFI channel into factor
incomeinflows and factor incomeoutflows using following regression specification
∆ logGDPIN^it=νf,t+ +βf+ ∆ logGDP]it+ǫ+i,t (2)
∆ logGDPOUT^ it=ν−
f,t+β
−
f ∆ logGDP]it+ǫ
−
i,t (3)
whereGDPIN=GDP+FACTOR INCOME INFLOW and GDPOUT=GDP−FACTOR INCOME OUTFLOW.
Adding these two equations together yields the following equation
βf ≈β+f +β
−
f (4)
where βf+ (βf−) is the coefficient of income smoothing via the factor income inflows (outflows)
channel.
As NFI in OECD countries is dominated by net revenues from financial assets held abroad,
we proceed to disaggregate the NFI into its subcomponents, namely receipts and payments of
interest, dividends and retained earnings.4 To observe the extent of risk-sharing arising from the
revenue of these components, we also decompose theNFIinto the receipts of interests, dividends
andFDIretained earnings from foreign assets as well as payments of interest, dividends andFDI
retained earnings to foreign liabilities. Algebraically,NFI is formulated as
NFI ≈ INTEREST RECEIPTS+DIVIDEND RECEIPTS
+ RECEIPTS ON FDI REINVESTMENT EARNINGS−INTEREST PAYMENTS
− DIVIDEND PAYMENTS−PAYMENTS ON FDI REINVESTMENT EARNINGS.
In order to quantify the amount of risk-sharing from each of the subcomponents, we make use
of the following regression specification
∆ log(GDP^+X)
i
t=νi,t+βf ∆ logGDPg i
t+ǫi,t (5)
4
The remaining items, net tax on imports and net compensation of employees from abroad, are smaller in magnitude compared with the other items and are therefore not considered in theOECDsample. However, for
whereXcorresponds to the receipts (payments) of bond, equity andFDIassets (liabilities). For
example, to examine the degree of income smoothing via interest revenue from bond holdings
(i.e.,INTEREST RECEIPTS) we estimate
∆ log(GDP+INTEREST RECEIPTS^ )
i
t=νi,t+βf ∆ logGDPgit+ǫi,t (6)
where ∆ log(GDP+INTEREST RECEIPTS^ )
i
t is the annual change inGDP plus interest receipts per
capita in constant prices minus the union-wide counterpart, ∆log(GDP+INTEREST RECEIPTS)t,
and likewise for the other components.
We end the discussion of this section by briefly outlining the econometric methodology
employed throughout the paper. To account for autocorrelation in the residuals, we assume
that the error terms in each equation/country follow an AR(1) process. Due to the short sample
period, we restrict the autocorrelation parameter to be identical across countries/equations. We
allow for country-specific variances of the error terms. Following Sørensen and Yosha (1998),
the estimation is carried out using a two-step generalized least squares (GLS) procedure: (i)
the entire panel is estimated using ordinary least squares (which is equivalent to a seemingly
unrelated regression type estimation since the model contains identical regressors) and (ii)
residuals from the first step is used to estimate variance for each country and corrected for
heteroscedasticity. Unless stated otherwise, we use differenced data at a yearly frequency.
3
Empirical results
3.1 Data and descriptive statistics
We use a dataset for 22 industrial countries with annual data between 1999 and 2009,
surround-ing the year of the introduction of the Euro. Country selection is essentially driven by data
quality and consistency requirement. The sample is divided into several country groups: EMU,
EU, newEUandOECDcountries – see Table 1 for the complete country list. Our country selection
and data coverage are comparable to those of Sørensen et al. (2007), Demyanyk et al. (2008)
and Balli et al. (2011). Per capita figures are obtained by normalizing over the population of
each country. All series are expressed in real per capita terms. Major variables such as GDP,
GNI, factor income inflows and outflows, population and consumer price indices were taken from
(payments), dividend receipts (payments) and retained earnings (payments) on FDI were
ob-tained from OECDNational Accounts detailed tables (Volume II). In particular, equity receipts
(payments) were reported inOECDdataset as the distributed income of corporations which
pre-dominantly include dividends received (paid) from (to) foreign equity investments, while debt
receipts (payments) simply reflect the interest obtained (paid) on foreign debt holdings.5 The
FDIretained earnings receipts (payments) reflect the distributed income of FDI.
Table 1 displays the descriptive statistics for most variables used. GDP and GNI growth
are higher but more variable among new EU countries than those ofEMU and OECD countries.
The average annual growth rates of most receipt and payment items are relatively larger in
size among EMU countries (despite having slightly higher variability) than in the overall OECD
aggregate, which would support portfolio flows as a potentially more important channel for the
Euro area countries. In both EMU and OECD countries, the return on debt instruments was
higher that those of equity and FDIportfolios (as ratios of GDP). This picture is line with the
rapid growth of leverage – enabled by the globalization of banking and a period of unusually
low interest rates and risk spreads – after 2000 in most mature economies.6 Among the new EU
countries, the larger payment of debt liabilities compared to receipts from debt assets (as ratios
ofGDP) also appear consistent with their net debtor position, fueled by reduced borrowing costs
and the improved creditworthiness, of these economies.7
3.2 Income smoothing
How have factor income flows contributed to international risk-sharing in developed economies
over the past decade? Did factor income inflows or factor income outflows contribute more
to income smoothing? How did the recent global economic and financial crises affect these
international risk-sharing channels? A quantitative assessment of these questions is presented
in Table 2. Answers to the first question – for which we are able to get a historical picture –
is presented in the topmost row in panels A and B, respectively, for EMUand OECD countries.
Overall, the results paint a mixed picture for both groups of countries. If we focus on the
first three sub-periods (1971–80; 1981–90; 1991–00), we find thatNFI flows caused income
dis-5
The distributed income of corporations consists of dividends plus withdrawals from the income of quasi-corporations (see OECD Annual National Accounts).
6
See McKinsey (2010) for an economic assessment of the growth of debt and leverage before the crisis in different countries.
7
smoothing inOECD countries (indicated by the negative 1−βf coefficient), whereas the impact
was more favorable for theEMUcountries. One likely interpretation of this difference in results
is due to increased home bias in bonds and equity in some non-EMU OECD countries (e.g.,
Japan, the United States) compared to their EMU counterparts.8 Since 2000, the contribution
ofNFIflows to income smoothing has been higher and statistically significant for both groups of
nations. However, the asymmetric impact of the global financial crisis onNFIflows in relation to
risk-sharing is a key focus of this paper. We find that relative to the 2001–2007 period, during
2001–2009, EMU countries experienced a slight decline in income smoothing via the NFI flows,
while theOECDcountries as a whole registered a modest increase in income smoothing. Clearly,
the non-EMU OECDmember nations – including the resource-rich economies of Australia, Canada
and Norway – showed stronger resilience than EMU countries during the global financial crisis
that has seriously disrupted capital movements around the world.
Turning to the second and third questions posed above, we find that factor income inflows
(measured by 1−βf+) provided a buffer against idiosyncratic output shocks during the global
financing crisis, which is evident when comparing the results between 2001–2007 and 2001–2009.
For EMU countries, the inflow effect (albeit statistically insignificant) was in sharp contrast
to the strong income dis-smoothing behavior observed over the 1991–2007 period. A likely
explanation is that following the intensification of the global financial crisis in the fall of 2008,
investors rapidly sold off their foreign assets to (partially) insulate income from the residualGDP
shocks. However, this positive effect was overshadowed by abrupt outflows of capital during the
crisis period, as evident from a sharp decline in the contribution from factor income outflows
(measured by 1−βf−) during 2001–2009 relative to the 2001–2007 period. The EMU countries
have seen a 50% decline in income smoothing via the factor income outflow channel, which
explains the similar drop in income smoothing in the OECD countries. This was verified from
alternative groupings of theOECDsample, where we have done similar analysis forEUand non-EU
OECD countries.9 Unreported results reveal that income smoothing via factor income outflows
actually increased – instead of decreasing, as in EMUcountries – during 2001–2009 in both EU
and non-EU OECDcountries.10 The effect was much larger for non-EU OECDcountries, indicating
a 100% increase in income smoothing, coming from a low base. These results highlight the
8
See Table 2 in Sørensen et al. (2007) and Table 1 in Balli et al. (2011) for the extent of debt and equity home bias acrossOECDcountries during 1990s and 2000s.
9
EUincludes theEMUplus Denmark, Sweden and the UK. Non-EU OECDincludes Australia, Canada, Japan,
Korea, New Zealand, Norway, Switzerland and the US.
comparative vulnerability of theEMUmember nations in the wake of the global financial crisis.
Finally, Figures 1a–d graphically illustrate the results presented above. The year-by-year
coefficients are obtained after smoothing the time-variation using a Normal kernel with a
band-width (standard deviation) of 2. As can be seen, the trends described above are clearly visible.
Overall, holdings of both assets and liabilities mattered in international income risk-sharing
during the recent global economic crisis. Returns on assets (factor income inflows) provided the
needed buffer against output shocks in EMU countries, while liability payments (factor income
outflows) helped the non-EU OECDcountries to insulate themselves partially from residual
out-put shocks. These effects were, however, far from perfect risk-sharing, as is evident from the
rather smaller coefficients of factor income flows.
3.3 The contribution of bonds, equity and FDI
What class of assets underlies the international income risk-sharing documented above? In this
section, we provide the relative contribution of the receipts and payments of the bonds (and bank
loans), equity andFDIin the international risk-sharing process inOECDcountries. We continue to
focus on the 1999–2009 period (relative to 1999–2007) to find out the effect of the global financial
crisis on international risk-sharing. Table 3 reports the detailed results of each asset category in
terms of its receipts, payments and net position. A quick glance at Table 3 suggests that debt
assets, which include bonds and bank loans, played a key favorable role in contrast to equity
andFDIassets in terms of risk-sharing in the aftermath of the global financial crisis. The results
of the disaggregated returns show that debt asset holdings (measured by interest receivables)
contributed strongly to risk-sharing, thus making the net contribution from debt positive and
significant (particularly forEMUcountries). The income dis-smoothing effect of interest payable
on debt liabilities can be explained in light of the observed convergence between nominal and
real bond returns, especially in the Eurozone and in industrial economies.11 The results are
quite similar, but to a lesser extent, over the pre-crisis period (1999–2007), corroborating the
fact that the debt market in general is more predictable/stable than the equity market.
By comparison, (net) returns from equity assets resulted in income dis-smoothing during
1999–2009, contrary to the positive risk-sharing observed during the 1999–2007 period. In the
aftermath of the global financial crisis, gains from dividend payments on equity were outweighed
11
by the loss in dividend receivables from equity. As dividend payments12are roughly proportional
to domestic output, it is not surprising to notice positive income smoothing via the equity
liability channel. This result provides a good illustration of promoting cross-border equity
flows intended for productive use. On the other hand, the observed income dis-smoothing via
dividend receipts from foreign equity holdings is likely to have arisen from increased business
cycle synchronization among EU/OECD countries, thus making dividend receipts pro-cyclical
vis-´a-vis domestic output.
Putting all these findings together, the relatively robust performance of debt holdings,
com-pared to equity holding, to hedge fluctuations in output during the current financial crisis
appears consistent with the upheaval in the world financial markets. As mentioned in the
Intro-duction, between 2007 and 2008, the value of the world’s financial assets declined from a peak
of $194 trillion to $178 trillion; in which falling equities accounted for virtually all of the drop
in global financial assets (McKinsey, 2009).13 Whilst financial assets declined in nearly every
country, some of the worst equity market performers considered in our sample were Austria,
Greece and Ireland. In contrast, the market value of private and government debt grew during
2008–2009. The aggregate global debt-to-equity ratio nearly doubled from 124% in 2007 to
244% by the end of 2008 (McKinsey, 2009). However, the rise in debt issuance was itself a
by-product of the financial crisis. That is, to offset the decline in equities, countries have launched
themselves into debt issuance to recapitalize local banks as well as to stimulate domestic
econ-omy fiscally. A possible implication of the reduction in the relative role of equity funding and
a rise in debt financing is that GDP growth is slower and more volatile, which, in turn, would
undermine future international risk-sharing.
Finally, the lower panel in Table 3 shows that FDI did not correspond to noticeable risk
diversification over recent years. Although some evidence of income smoothing via FDIliability
was observed in EMU countries during the pre-crisis period, the effect was not statistically
significant. Employing a broader sample of mature and emerging market economies but using
pre-crisis data, Fratzscher and Imbs (2009) find thatFDIor bank loans are associated with lower
(consumption) risk-sharing. They point to the higher transaction costs (e.g., the likelihood of
expropriation or contract repudiation) associated with FDI and international loans as lying
12
More broadly, domestic liabilities which include equity andFDIliabilities, as is often assumed in theoretical
models of international risk-sharing.
13
behind the low risk-sharing. However, these costs are likely to be particularly worrisome in
countries with poor institutional quality and which are closed to international markets, but
less so in mature economies as considered in the present analysis. In summary, the precise
magnitude of the gains fromFDIholdings remains an open question.
3.4 Income smoothing under asymmetric output shocks
The preceding discussion made no allowance for the distinction between positive and negative
output shocks, an omission that could bias the coefficients attached to output, thereby leading
to a misinterpretation of the results. For example, when a country is on a positive growth
path, it is likely to face more permanent positive shocks compared to negative ones, causing the
absolute value of the coefficient attached to positive shocks to inflate. If the economy is fairly
well insured against negative shocks, not distinguishing positive shocks from negative shocks
might result in lack of recognition of these insurance capabilities (Pierucci and Ventura, 2010).
To guard against this possibility, following Pierucci and Ventura (2010), we augment Equation
(6) by explicitly distinguishing between the “positive” and “negative” realizations of the GDP
shock variable
∆ log(GDP+INTEREST RECEIPTS^ )
i
t=νf,t+βf+1∆ log^GDP +
it+β
+
f2∆ logGDP^
−
it+ǫi,t (7)
where GDP+it and GDP−it are the positive and negative output shocks, respectively. Shock
de-composition for other components (equity and FDI) are derived in a similar fashion. We use
an output gap process to distinguish between positive and negative realizations of the GDP.
Assuming that trend output is the level of output that a country wishes to secure, the negative
GDP component is defined as those that correspond to periods with a negative output gap
(ac-tual GDP minus trend GDP), and positive GDP components are those corresponding to periods
with a positive output gap.14 This shock decomposition will allow us to capture favourable or
unfavourable shocks even when ∆ logGDPit is positive at all times, which is generally the case
under normal circumstances.
Table 4 displays the results for receipt (payment) of the bonds, equity and FDI assets
(li-abilities) under asymmetric output shocks over the 1999-2009 period. The overall results are
consistent with those of Table 3, confirming that debt assets and equity liability, respectively,
provided countries the ability to cushion the effects of negative and positive output shocks. For
example, about 26% of negative income shocks are smoothed by interest received on debt assets
inEMUcountries, compared with 15% of adverse shocks in theOECD. The magnitude of income
smoothing from equity returns is also much higher inEMU(25%) thanOECD(5%) when they are
hit by a positive shock. As stock market returns generally reflect the country-specific
perfor-mance of of listed firms, equity returns tend to be positively correlated with the output of the
issuing country, which help explains why equity returns provided the buffer when a country’s
output was hit by a positive shock. In contrast, when a country is hit by a negative shock,
its ability to raise fund through stock market diminishes amid weakening growth prospect. As
the recent experience of the several peripheralEMUcountries show, during economic downturns
countries increasingly rely on new sovereign debt issuances – albeit at higher marginal cost –
mainly to meet the debt service on the existing stock. Overall, the estimates are somewhat
noisy due to the small sample size and to the possible noise in the measurement of output gap.
The results, however, offer a tentative picture about the way countries respond to asymmetric
economic shocks.
3.5 Consumption smoothing
Although consumption risk sharing is essentially determined by income risk sharing and by
patterns of saving; in practice, households care more about smoothing their consumption than
income. In this section we quantify the impact of factor income flows on consumption risk
sharing in both OECD and EMU countries. The estimation strategy is similar to that of the
income smoothing model discussed above. The panel regression equation is specified as
∆ log(gC)it=υc+βc∆ logGDP]it+ǫi,t (8)
where ∆ log(gC)it is the difference between country i’s per capita final consumption and
aggre-gate per capita final consumption for the group at time t; ∆ log(^GDP)it is defined as above; υ
is a constant and ǫ+i,t are error terms. The coefficient βc measures the average co-movement
of a country’s idiosyncratic consumption growth with its idiosyncratic GDP growth in year t.
The lower the co-movement, the higher amount of consumption is buffered againstGDP
fluctua-tions, therefore a lowerβc is expected such that the metric 1−βc measures ‘total consumption
In a similar manner, we quantify the effect of the ‘factor income inflows’ vs. ‘factor income
outflows’ on consumption smoothing using the following regression specification
∆ log(C−FACTOR INCOME INFLOW^ )it=υ+c +βc+∆ logGDP]it+ǫ+i,t, (9)
and
∆ log(C+FACTOR INCOME OUTFLOW^ )it=υc−+βc−∆ logGDP]it+ǫ−i,t, (10)
where the coefficient β+
c (βc−) measures the average co-movement of a country’s idiosyncratic
consumption with factor income inflow (outflow) growth with respect to its idiosyncratic GDP
growth in periodt; whereas the metric 1−β+
c (1−βc−) measures the amount of total consumption
smoothing via factor income inflows (outflows).
Table 5 reports the estimation results corresponding to Equations (8)–(10). A first remark
is that compared with the extent of income smoothing (see Table 2) the magnitude of
con-sumption smoothing is higher since the latter entails all likely sources of risk-sharing including
income, government consumption, precautionary saving, credit rationing and developments in
the housing market (see Demyanyk et al., 2008, for further discussion). Second, despite the
fluctuations, the citizens of the EMU and OECD countries were able to maintain a surprisingly
comparable level of consumption smoothing over the past four decades. In fact, the financial
crisis contributed to only a slight drop in consumption risk-sharing in EMU and OECD, which
can be seen by comparing the estimated parameters (1−βc) in the last two columns in Table
5. Further, while factor income outflows (external liabilities) contributed to a 4% increase in
consumption smoothing in both regions; factor income inflows (external assets) instead lowered
consumption smoothing in EMU countries by 2%. Although the estimates are somewhat noisy
due to short samples, there is little doubt that until 2009 the global financial crisis has affected
the factor income channel of consumption risk-sharing considerably.
As above, we are able to examine the impact of different asset classes (bonds, equity,FDI) on
consumption risk-sharing achieved through factor income flows. This estimation is conducted
using the regression model similar to Equation (5)
∆ log(C^−X)it=υc+βc+∆ logGDP]it+ǫi,t (11)
are modelled using the same procedure as in Equation (6).15
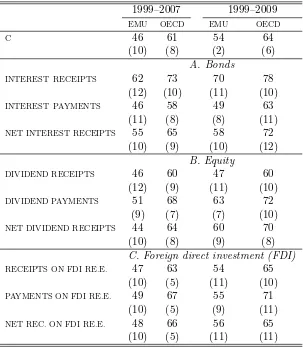
Results are presented in Table 6. The estimated coefficients in the first row of Table 6 –
which are obtained by regressing a country’s consumption level on its output – are interpreted
as the amount of unsmoothed shocks and is seen to have widened more in EMU than OECD
in the run-up to the financial crisis. The estimated coefficients of the remaining sub-channels
can be interpreted as follows. Recall that, in each sub-channels the dependent variable is
obtained by subtracting the receipts (or adding payments) component from consumption and
then regressing the transformed item on output, see Equation (11). Hence, for example, an
increase in the estimated coefficient in these regressions (relative to that shown in the first row,
C) imply a higher correlation between consumption and output, and is therefore interpreted
as an increase in consumption risk-sharing. Consistent with the findings above, we find that
in both regions interest receipts on debt assets provided a significant amount of consumption
smoothing in the run-up to the financial crisis. By contrast, interest payments on debt liabilities
resulted in a drop in consumption smoothing by a higher amount inEMUcompared withOECD.
The net positive impact on consumption risk-sharing from debt assets is thus higher in OECD
than EMU. On the other hand, the net contribution from dividend receipts on equity assets in
buffering shocks to consumption is identical (6%) in EMU and OECD, where the positive
risk-sharing stemmed from returns on equity liabilities than returns on equity assets. Finally, the
most highlighted aspect of FDI-supported consumption smoothing is present in OECD countries
during the 1999–2009 sample originating from payments to FDIretained earnings.
4
New EU members
The preceding analysis has focused upon the coreEMU member countries. The recent
enlarge-ment of the European Union by 11 countries mostly Central and Eastern European (CCE)
coun-tries (Bulgaria, Cyprus, Czech Republic, Estonia, Hungary, Malta, Latvia, Lithuania, Poland,
Slovenia and Slovakia) heralds the enlargement of theEMU. Although some CCE countries are
still outside the union, the new member states are obliged to join the EMU as soon as they
fulfill the Maastricht criteria for monetary, fiscal and exchange rate convergence (Grauwe and
Schnabl, 2011). One key aspect of the increased financial integration between old and new
15
EU members has been the large capital inflows from older to newer economies.16 During the
pre-crisis boom years, large foreign capital inflows into the CCE region not only contributed to
a rapid catching-up in many countries, they also led to the build-up of imbalances and
variabil-ities (European Commission, 2011, p. 4). Although, unlike the core EMU and OECD countries,
detailed information on the composition of factor income flows are not available for the new
EU member countries, we were able to obtain aggregate data for receipts on financial assets
(including interest receipts, dividend receipts andFDIretained earnings), payments on financial
liabilities (including interest payments, dividend payments andFDIretained earning payments)
and the sum of net compensation of employees.
Table 7 presents a comparative picture of the new and old EU countries in relation to the
various channels of international risk-sharing on the spread of the financial crisis, as captured by
comparing results between 1999–2007 and 1999–2009. For the CCE region, we find no change in
the contribution of net factor income flows (1−βf) to income smoothing following the financial
crisis, which is rather unsatisfactory when compared to the coreEMUcountries, who experienced
an increase in risk-sharing in times of economic hardship. While receipts on financial assets
contributed to a 1% increase in risk-sharing in the new EU countries during the crisis period,
this gain is barely comparable with the significant large gain achieved by core EMU countries
over the same period. In addition to the size difference (see Table 1), these differing results may
have been created by differences in the quality of asset holdings in the two groups of countries.
In the CCE region, payments on financial liabilities caused income dis-smoothing, although the
effect seemed to have largely dissipated following the financial crisis compared to the pre-crisis
samples (1999–2007). The negative smoothing can be interpreted in light of evidence that in
the CCE region, a large part of investment financed by capital inflows was directed towards
the non-tradable sector, implying a lower contribution to productivity growth and prospective
export potential (Jevˇc´ak et al., 2010). However, the fall in the amount of dis-smoothing on the
spread of the financial crisis is consistent with the sharp change in the net external position
of CCE countries vis-`a-vis the rest of the world over the 1999–2009 period. During the
pre-enlargement period, the average annual external borrowing of the CCE countries (except for
Malta and Slovenia) hovered within a relatively narrow range between 5.8% of GDP in 1999
to 6% of GDP in 2003. Following the 2004 enlargement, average external borrowing increased
16
sharply from 6.7% ofGDP in 2005 to 10.6% ofGDP in 2007. However, with the intensification of
the financial crisis, the average external balance for the CCE region increased from a deficit of
almost 9% of GDPin 2008 to a surplus of more than 1% of GDPin 2009.17 Hence the switching
of the CCE’s average external balance from deficit to surplus underlies the sharp fall in the
contribution of interest payable to risk-sharing as well as the overall decline in income from net
financial assets by 50% on the spread of the financial crisis.
Turning to the net compensation of employees,18 we find that non-resident workers’
remit-tance from abroad provided income dis-smoothing in the CCE region (the results are similar –
but in a lesser magnitude – for the core EMU countries). After the EU’s enlargement in 2004,
unlike the recorded large capital movements, initial migration flows between the new and oldEU
members were quite modest on average (European Commission, 2006). While Ireland, Sweden
and the UK opened access to their labor markets immediately after theEU’s enlargement, eight
of the coreEU countries (Spain, Finland, France, Greece, Portugal, Italy, the Netherlands and
Luxembourg) opened their labor market as late as November 2008 – see Kahanec and
Zimmer-mann (2009) for further details. The last row in Table 7 shows that compensation of employees
caused income dis-smoothing for both old and newEUcountries. This result is probably driven
by the pro-cyclicality between output and labor income in new EU countries, which is not
sur-prising, given the higher business cycle synchronization documented between old and new EU
countries in recent years. For instance, Savva et al. (2010) find that both new and old EU
countries experienced a sizable increase in their business cycle synchronization with the Euro
area. Moreover, for some new EU members, the business cycle correlations have changed from
negative and small to positive correlations. Comparable results have been found by Darvas and
Szap´ary (2008), Afonso and Furceri (2007), Kutan and Yigit (2004) and Artis et al. (2004).
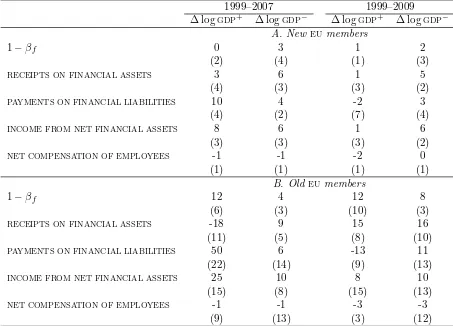
Finally, Table 8 presents how each of the international risk-sharing channels fared under
asymmetric output shocks. Focusing on the negative output shocks (∆GDP−), which characterize
the current financial crisis, we see that while contribution from financial assets (i.e., interest
receivable, dividend receipts andFDIreceipts) and debt liabilities (i.e., interest payable, dividend
payments andFDIpayments) towards income smoothing has marginally declined in the newEU
nations, it has noticeably increased in the old EU countries. As suggested above, for the new
EU countries, this decline is in line with the substantial capital outflows documented following
17
Further details are available in Jevˇc´ak et al., (2010).
18
the financial crisis. However, in the wake of the financial crisis, many core EMU countries
issued substantial debt to stabilize the sharply contracting European economy. Following the
experience of sizable debt reduction during 1999–2007, the government debt-to-GDPratio in the
Euro area as a whole exceeded the 60% reference value (see Lojsch et al., 2011). Even after
controlling for the lower nominal GDP growth – which is the denominator in the debt-to-GDP
ratio – the increase in the Euro area’s debt ratio reflects how debt deterioration during the
period 2008–2010 was due to adopting sizable fiscal stimulus measures. Such countercyclical
fiscal policies in the Euro area, which have led to an increased supply of sovereign debt, helped
them to address the impact of the financial crisis, at least partially. Interestingly, the estimates
of the ‘income from net financial assets’ before and after the financial crisis remain unchanged
in both groups of EU countries. Lastly, the contribution from net compensation of employees
played a more favorable role in the new EUnations than in the old members.
5
Conclusions
In this paper, we have examine the extent to which the global financial crisis of 2008–2009 has
affected international income risk-sharing across a set of industrial economies comprised ofEMU,
EU and other OECD countries. Rather than focusing solely on the returns of the cross-border
portfolios, we split portfolios into net factor income channel inflows and outflows to investigate
which of the two sides delivered the largest insurance against income shocks during the recent
crisis. We find that the factor income inflow channel proved to be a better shock absorber than
the factor income outflow channel during the current financial crisis. In the aftermath of the
crisis, interest receipts from debt securities provided a more potent channel of risk-sharing than
the receipts on equity holdings. However, the increased risk-sharing through interest receipts
itself was a by-product of the financial crisis, because to offset the decline in the receipts of equity
holdings, industrial economies increased their debt issuance to stimulate domestic economy.
Results are very similar when consumption risk-sharing is considered. AlthoughFDIholdings did
not correspond to noticeable income smoothing, it did support higher consumption smoothing in
OECDcountries in the run-up to the financial crisis. A decomposition of output shocks revealed
that debt assets and equity liability performed better under negative and positive output shocks,
respectively. In the new EU countries, the unwinding of capital flows resulted in a sharp fall in
switching of their average external balance from deficit to surplus following the intensification of
the global financial crisis. Moreover, debt portfolios played a less potent channel of risk-sharing
in the new EU countries (than in their EMU counterparts) under negative output shocks. The
negative income smoothing via the net compensation of employees channel appears to suggest
that the intended benefit of labor migration from new to old EU countries following the EU’s
enlargement was mostly evaporated by the higher business cycle synchronization of output
Figure 1: Risk-sharing via factor income inflows and factor income outflows in selected country groups (percent)
-.1 0 .1 .2 .3
1990 1995 2000 2005 2010 inflow outflow
(a) EMU
-.2 -.1 0 .1 .2
1990 1995 2000 2005 2010 inflow outflow
(b) EU
-.2 -.1 0 .1 .2
1990 1995 2000 2005 2010 inflow outflow
(c) OECD
-.1 0 .1 .2
1990 1995 2000 2005 2010 inflow outflow
(d) Non-EU OECD
Table 1: Descriptive statistics: 1999–2009
EMU OECD
Mean Stdev1 Stdev2 Mean Stdev1 Stdev2
∆ logGDP 1.18 1.18 2.38 1.05 0.95 2.25
∆ logGNI 1.21 1.67 2.62 1.08 1.18 2.40
∆ log (GDP+FACTOR INCOME INFLOW) 2.14 1.98 2.26 2.22 1.88 2.01
∆ log (GDP−FACTOR INCOME OUTFLOW) 2.44 2.66 3.38 2.32 2.71 3.01
∆ log (GDP+INTEREST RECEIPTS) 1.22 1.36 2.39 1.16 1.05 2.26
∆ log (GDP−INTEREST PAYMENTS) 1.15 1.52 1.92 0.98 1.20 1.68
∆ log (GDP+DIVIDEND RECEIPTS) 1.36 1.69 2.86 1.28 2.55 2.69
∆ log (GDP−DIVIDEND PAYMENTS) 0.94 1.67 2.35 0.81 1.44 2.22
∆ log (GDP+RECEIPTS ON FDI RE.E.) 1.15 1.74 2.81 1.01 1.56 2.67
∆ log (GDP−PAYMENTS ON FDI RE.E.) 1.19 1.91 2.78 1.08 1.53 2.40
INTEREST RECEIPTS/GDP 5.06 2.73 1.28 6.05 3.45 1.13
INTEREST PAYMENTS/GDP 4.80 3.13 1.18 5.49 3.15 1.13
DIVIDEND RECEIPTS/GDP 2.67 2.32 1.08 2.83 2.71 1.14
DIVIDEND PAYMENTS/GDP 3.19 3.44 1.24 3.17 3.97 1.21
RECEIPTS ON FDI RE.E./GDP 0.79 1.35 0.76 0.93 1.56 0.76
PAYMENTS ON FDI RE.E./GDP 1.04 1.55 1.04 0.75 1.09 0.82
FACTOR INCOME INFLOW/GDP 10.01 6.76 2.30 10.34 6.89 2.25
FACTOR INCOME OUTFLOW/GDP 9.64 5.98 2.19 10.39 6.89 2.14
New EUcountries
Mean Stdev1 Stdev2
∆ logGDP 2.30 2.54 2.23
∆ logGNI 2.43 2.66 3.04
∆ log (GDP+RECEIPTS ON FINANCIAL ASSETS) 2.61 2.99 3.01
∆ log (GDP−PAYMENTS ON FINANCIAL LIABILITIES) 3.52 2.34 2.67
∆ log (GDP+NET COMPENSATION OF EMPLOYEES) 2.44 2.99 3.56
INTEREST RECEIPTS/GDP 3.55 3.13 3.23
INTEREST PAYMENTS/GDP 5.67 3.63 4.78
NET COMPENSATION OF EMPLOYEES/GDP 3.01 3.08 3.71
Note: TheEMUsample includes Austria, Belgium, Finland, France, Germany, Greece, Ireland, Italy, the
Netherlands, Portugal and Spain. TheOECDsample includes theEMUcountries plus Australia, Canada,
Denmark, Japan, Korea, New Zealand, Norway, Switzerland, Sweden, the UK and the US. The newEU
countries are Bulgaria, Cyprus, Czech Republic, Estonia, Hungary, Malta, Latvia, Lithuania, Poland, Slovenia and Slovakia. FDI RE.E.denotesFDI REINVESTMENT EARNINGS. Stdev1 (cross-section) is the time
average of [(1/n)Pi(Xit−X¯t)2]1/2 where ¯Xtis the periodtaverage ofXitacross countries andnis the
number of countries. Stdev2 (time series) denotes the average across countries of [(1/T)Pt(Xit−X¯i)2]1/2
where ¯Xi is the time average ofXitfor countryiandT is number of the years in the sample. Means and
Table 2: International income smoothing via net factor income and its subcomponents (percent): 1970–2009
A. EMU
1971–1980 1981–1990 1991–2000 2001–2007 2001–2009
(1−βf) 0 0 4 8 7
(1) (3) (3) (2) (2)
(1−β+f) 4 1 -10 -9 3
(2) (3) (3) (6) (6)
(1−β−f) -3 -2 14 18 9
(1) (1) (7) (8) (4)
OBS 110 110 110 77 136
B. OECD
1971–1980 1981–1990 1991–2000 2001–2007 2001–2009
(1−βf) -2 -5 -2 7 9
(1) (2) (3) (3) (3)
(1−β+f) -1 0 -5 3 7
(1) (1) (2) (6) (2)
(1−β−f) -1 -4 4 8 2
(1) (2) (2) (5) (2)
OBS 220 220 220 154 198
Note: The EMU sample includes Austria, Belgium, Finland, France, Germany,
Greece, Ireland, Italy, the Netherlands, Portugal, and Spain. The OECDsample
includes theEMUcountries plus Australia, Canada, Denmark, Japan, Korea, New
Zealand, Norway, Switzerland, Sweden, the UK and the US. Percentages describe the shocks absorbed at each level of smoothing. Standard errors are in parentheses. OBS denotes number of observations. (1−βf) is the amount of income smoothing
via the net factor income flow channel and the coefficientβf is the GLS estimation
of the slope in the regression of ∆ logGNIgiton ∆ logGDP]it. (1−β+
f) is the amount
of income smoothing via the factor income inflow channel whereβ+f is the GLS
estimation of the slope in the regression of ∆ log(GDP+FACTOR INCOME INFLOW^ )it
on ∆ logGDP]it. (1−β−
f) is the amount of income smoothing via the net factor
income outflow channel, and the coefficientβ−
f is the GLS estimation of the slope
Table 3: Smoothing via bonds, equity and foreign direct investment (percent): 1999–2009
1999–2007 1999–2009
EMU OECD EMU OECD
A. Bonds
INTEREST RECEIPTS 12 0 21 5
(5) (4) (3) (4)
INTEREST PAYMENTS -7 -1 -3 -5
(6) (5) (5) (5)
NET INTEREST RECEIPTS 4 1 13 1
(2) (2) (3) (2)
B. Equity
DIVIDEND RECEIPTS -11 -4 -13 -5
(5) (5) (4) (3)
DIVIDEND PAYMENTS 18 10 12 3
(6) (5) (7) (4)
NET DIVIDEND RECEIPTS 7 3 -3 -2
(3) (4) (7) (4)
C. Foreign direct investment (FDI)
RECEIPTS ON FDI RE.E. -1 -2 -1 -2
(4) (3) (5) (3)
PAYMENTS ON FDI RE.E. 6 1 0 0
(5) (4) (6) (4)
NET REC.ON FDI RE.E. 2 -1 -2 -1
(6) (6) (7) (3) Note: The EMU sample includes Austria, Belgium, Finland,
France, Germany, Italy, the Netherlands and Portugal. The
OECD sample includes the EMU countries plus Canada, Japan,
Korea, Norway, Switzerland and the US. FDI RE.E. denotes
FDI REINVESTMENT EARNINGS. Standard errors are in parentheses.
Income smoothing via interest receipts is the slope of the regression of ∆ logGDPi−∆ log(GDP+X)ion ∆ logGDPi, whereX corresponds
Table 4: Smoothing via bonds, equity and foreign direct investment under asymmetric output shocks (percent): 1999–2009
EMU OECD
∆ logGDP+ ∆ logGDP− ∆ logGDP+ ∆ logGDP−
A. Bonds
INTEREST RECEIPTS 6 26 1 15
(12) (6) (14) (5)
INTEREST PAYMENTS 2 -6 3 -6
(11) (6) (14) (6)
NET INTEREST RECEIPTS 0 16 4 6
(8) (4) (6) (2)
B. Equity
DIVIDEND RECEIPTS -19 -11 -13 -7
(9) (6) (8) (4)
DIVIDEND PAYMENTS 25 8 5 -4
(10) (9) (9) (5)
NET DIVIDEND RECEIPTS -2 -6 -2 -2
(13) (8) (11) (9)
C. Foreign direct investment (FDI)
RECEIPTS ON FDI RE.E. 10 -5 1 -4
(11) (7) (9) (5)
PAYMENTS ON FDI RE.E. -3 -3 -7 -2
(12) (7) (11) (6)
NET REC.ON FDI RE.E. 6 -5 -1 -5
(11) (6) (11) (6)
Note: The EMU sample includes Austria, Belgium, Finland, France, Germany,
Italy, the Netherlands and Portugal. The OECD sample includes the EMU
coun-tries plus Canada, Japan, Korea, Norway, Switzerland and the US. FDI RE.E. denotes
FDI REINVESTMENT EARNINGS. Standard errors are in parentheses. Income smoothing
via interest receipts is the slope of the regression of ∆ logGDPi−∆ log(GDP+X)i on
∆ logGDP^+it and ∆ logGDP^−
it, where X corresponds to a specific component reported in
Table 5: Consumption smoothing via net factor income and its subcomponents (percent)
Panel A: EMU
1971–1980 1981–1990 1991–2000 2001–2009 2001-2007
(1−βc) 64 55 59 58 61
(10) (10) (11) (12) (11)
(1−β+
c ) 60 53 62 62 64
(11) (10) (10) (10) (11)
(1−βc−) 60 55 60 66 62
(12) (11) (10) (11) (10)
Panel B: OECD
1971–1980 1981–1990 1991–2000 2001–2009 2001-2007
(1−βc) 61 55 54 58 62
(12) (9) (8) (8) (9)
(1−β+
c ) 60 58 61 64 60
(10) (12) (10) (10) (11)
(1−βc−) 60 59 62 67 63
(11) (11) (12) (10) (12)
The EMUsample includes Austria, Belgium, Finland, France, Germany, Italy,
the Netherlands and Portugal. The OECD sample includes theEMU countries
plus Canada, Japan, Korea, Norway, Switzerland and the US. Percentages describe the shocks absorbed at each level of smoothing. Standard errors are in parentheses. (1−βc) is the amount of consumption smoothing via factor
income flow channel where the coefficientβc is the GLS estimate of the slope in
the regression of ∆ logCeiton ∆ logGDP]it. (1−β+c) is the amount of consumption
smoothing via factor income inflow channel where the coefficientβ+
c is the GLS
estimate of the slope in the regression of ∆ log(C−FACTOR INCOME INFLOW^ )it
on ∆ logGDP]it. (1−β−
c ) is the amount of income smoothing via factor income
outflow channel where the coefficient β−
c is the GLS estimate of the slope in
Table 6: Consumption Smoothing via bonds, equity and foreign direct investment (percent): 1999–2009
1999–2007 1999–2009
EMU OECD EMU OECD
C 46 61 54 64
(10) (8) (2) (6)
A. Bonds
INTEREST RECEIPTS 62 73 70 78
(12) (10) (11) (10)
INTEREST PAYMENTS 46 58 49 63
(11) (8) (8) (11)
NET INTEREST RECEIPTS 55 65 58 72
(10) (9) (10) (12)
B. Equity
DIVIDEND RECEIPTS 46 60 47 60
(12) (9) (11) (10)
DIVIDEND PAYMENTS 51 68 63 72
(9) (7) (7) (10)
NET DIVIDEND RECEIPTS 44 64 60 70
(10) (8) (9) (8)
C. Foreign direct investment (FDI)
RECEIPTS ON FDI RE.E. 47 63 54 65
(10) (5) (11) (10)
PAYMENTS ON FDI RE.E. 49 67 55 71
(10) (5) (9) (11)
NET REC.ON FDI RE.E. 48 66 56 65
(10) (5) (11) (11) Note: The EMUsample includes Austria, Belgium, Finland, France,
Germany, Italy, the Netherlands and Portugal. The OECD sample
includes the EMU countries plus Canada, Japan, Korea, Norway,
Switzerland and the US. Percentages describe the shocks absorbed at each level of smoothing. Standard errors are in parentheses. FDI RE.E.
denotesFDI REINVESTMENT EARNINGS. Standard errors are in
paren-theses. Consumption smoothing via factor income component is the slope of the regression of ∆ log(C−X)ion ∆ logGDPi, whereX
Table 7: Smoothing via net factor income and its subcomponents in new and old EU countries
(percent): 1999–2009
New EU EMU
1999–2007 1999–2009 1999–2007 1999–2009
1−βf 4 4 5 9
(1) (2) (3) (3)
RECEIPTS ON FINANCIAL ASSETS 3 4 0 7
(1) (2) (2) (3)
PAYMENTS ON FINANCIAL LIABILITIES -8 -1 4 2
(1) (3) (3) (2)
INCOME FROM NET FINANCIAL ASSETS 6 3 5 7
(1) (1) (3) (3)
NET COMPENSATION OF EMPLOYEES -4 -3 -1 -1
(1) (1) (1) (1)
Note: TheEMUsample includes Austria, Belgium, Finland, France, Germany, Italy, the Netherlands
and Portugal. The new EU sample includes Bulgaria, Cyprus, Czech Republic, Estonia, Hungary,
Malta, Latvia, Lithuania, Poland, Slovenia and Slovakia. Standard errors are in parentheses. 1−βf is
the GLS estimation of the slope in the regression of ∆ logGDPi−∆ logGNIion ∆ logGDPi. Smoothing
via each sub-channel is calculated as ∆ logGDPi−∆ log(GDP+X)ion ∆ logGDPi, whereXcorresponds
Table 8: Smoothing via net factor income and its subcomponents in new and oldEUcountries under asymmetric output shocks (percent): 1999–2009
1999–2007 1999–2009
∆ logGDP+ ∆ logGDP− ∆ logGDP+ ∆ logGDP− A. NewEU members
1−βf 0 3 1 2
(2) (4) (1) (3)
RECEIPTS ON FINANCIAL ASSETS 3 6 1 5
(4) (3) (3) (2)
PAYMENTS ON FINANCIAL LIABILITIES 10 4 -2 3
(4) (2) (7) (4)
INCOME FROM NET FINANCIAL ASSETS 8 6 1 6
(3) (3) (3) (2)
NET COMPENSATION OF EMPLOYEES -1 -1 -2 0
(1) (1) (1) (1)
B. Old EU members
1−βf 12 4 12 8
(6) (3) (10) (3)
RECEIPTS ON FINANCIAL ASSETS -18 9 15 16
(11) (5) (8) (10)
PAYMENTS ON FINANCIAL LIABILITIES 50 6 -13 11
(22) (14) (9) (13)
INCOME FROM NET FINANCIAL ASSETS 25 10 8 10
(15) (8) (15) (13)
NET COMPENSATION OF EMPLOYEES -1 -1 -3 -3
(9) (13) (3) (12)
Note: TheEMUsample includes Austria, Belgium, Finland, France, Germany, Italy, the Netherlands and Portugal. The new EU sample includes Bulgaria, Cyprus, Czech Republic, Estonia, Hungary, Malta, Latvia, Lithuania, Poland, Slovenia and Slovakia. Standard errors are in parentheses. 1− βf is the GLS estimation of the slope in the regression of ∆ logGDPi −∆ logGNIi on ∆ log^GDP+it
and ∆ logGDP^−
it. Smoothing via each sub-channel is calculated as ∆ logGDPi−∆ log(GDP+X)i on ∆ log^+ and ∆ log^−, whereX corresponds to the various sub-channels reported in the table.
References
Afonso, A., Furceri, D., 2007. Business cycle synchronization and insurance mechanisms in the EU. ECB Working Paper, 844.
Allard, C., 2011. More Europe, not less. Finance & Development 48, 52-54.
Artis, M., Marcellino, M., Proietti, T., 2004. Characterizing the business cycle for accession countries. CEPR Discussion Paper, 4457.
Baele, L., Ferrando, A., H¨ordahl, P., Krylova, E., Monnet, C., 2004. Measuring financial integration in the Euro area. ECB Occasional Paper, 14.
Balli, F., 2009. Spillover effects on government bond yields in Euro zone. Does full finan-cial integration exist in European government bond markets? Journal of Economics and Finance 33, 331-363.
Balli, F., Basher, S.A., Balli, H.O., 2010. From home bias to Euro bias: disentangling the effects of monetary union on the European financial markets. Journal of Economics and Business 62, 347-366.
Balli, F., Basher, S.A., Balli, H.O., 2011. Income insurance and the determinants of income insurance via foreign asset revenues and foreign liability payments. Economic Modelling 28, 2296-2306.
Balli, F., Kalemli-Ozcan, S., Sørensen, B.E., 2012. Risk sharing through capital gains. Cana-dian Journal of Economics 45, 472-492.
Beine, M., Cosma, A., Vermeulen, R., 2010. The dark side of global integration: Increasing tail dependence. Journal of Banking and Finance 34, 184-192.
Bordo, M.D., Eichengreen, B., Irwin, D.A., 1999. Is globalization today really different than globalization a hundred years ago? NBER Working Paper, 7195.
Bracke, T., Schmitz, M., 2011. Channels of international risk-sharing: Capital gain versus income flows. International Economics and Economic Policy 8, 45-78
Cecchetti, S.G., Mohanty, M.S., Zampolli, F., 2011. The real effects of debt. BIS Working Paper, 352.
Christoffersen, P., Errunza, V., Jacobs, K., Hugues, L., 2012. Is the potential for international diversification disappearing? A dynamic copula approach. Review of Financial Studies 25, 3711-3751.
Darvas, Z., Szap´ary, G., 2008. Business cycle synchronization in the enlarged EU. Open Economies Review 19, 1-19.
Davies, M., Ng, T., 2011. The rise of sovereign credit risk: Implications for financial stability. BIS Quarterly Review, September, 59-70.
Demyanyk, J., Ostergaard, C., Sørensen, B.E., 2008. Risk sharing and portfolio allocation in EMU. European Economy Economic Papers, 334.
Deutsche Bundesbank, 2009. Monthly Report. December.
European Commission, 2006. Enlargement two years after: An economic evaluation. European Commission Occasional Papers, 24.
European Commission, 2011. Capital flows to converging European economies – from boom to drought and beyond. European Commission Occasional Papers, 75.
Fratzscher, M., Imbs, J., 2009. Risk sharing, finance and institutions in international portfolio. Journal of Financial Economics 94, 428-447.
Grauwe, P., Schnabl, G., 2011. EMU entry strategies for the new member states. Intereco-nomics 39, 241-246.
Hodrick, R.J., Prescott, E.C., 1997. Postwar U.S. business cycles: An empirical investigation. Journal of Money, Credit, and Banking 29, 1-16.
Ibragimov, R., Jaffee, D., Walden, J., 2011. Diversification disasters. Journal of Financial Economics 99, 333-348.
Jevˇc´ak, A., Setzer, R., Suardi, M., 2010. Determinants of capital flows to the new EU members states before and during the financial crisis. European Commission Economic Papers, 425.
Kahanec, M., Zimmermann, K.F., 2009. Migration in an enlarged EU: A challenging solution? European Commission Economic Papers, 363.
Kose, M.A., Prasad, E.S., Terrones, M.E., 2007. How does financial globalization affect risk sharing? Patterns and channels. IMF Working Paper, 07/228.
Kose, M.A., Prasad, E.S., Terrones, M.E., 2009. Does financial globalization promote risk sharing? Journal of Development Economics 89, 258-270.
Kutan, A.M., Yigit, T., 2004. Nominal and real stochastic convergence of transition economies. Journal of Comparative Economics 32, 23-36.
Lane, P.R., Milessi-Ferreti, G.M., 2007. The external wealth of nations Mark II. Journal of International Economics 73, 223-250.
Lojsch, D.H., Rodriguez-Vives, M., Slavik, M., 2011. The size and composition of government debt in the Euro area. ECB Occasional Paper, 132.
McKinsey Global Institute (McKinsey), 2009. Global capital markets: Entering a new era. September 2009.
McKinsey Global Institute (McKinsey), 2010. Debt and deleveraging: The global credit bubble and its economic consequences. January 2010.
McKinsey Global Institute (McKinsey), 2011. The emerging equity gap: Growth and stability in the new investor landscape. December 2011.
Mendoza, E.G., Quadrini, V., 2010. Financial globalization, financial crises and contagion. Journal of Monetary Economics 57, 24-39.
Pierucci, E., Ventura, L., 2010. Risk sharing: A long run issue? Open Economies Review 21, 705-730.
Schmukler, S.L., 2004. Financial globalization: Gain and pain for developing countries. Eco-nomic Review, Second Quarter, Federal Reserve Bank of Atlanta, 39-66.
Sørensen, B.E., Yosha, O., 1998. International risk sharing and European monetary unification. Journal of International Economics 45, 211-238.
Sørensen, B.E., Wu, Y.T., Yosha, O., Zhu, Y., 2007. Home bias and international risk sharing: Twin puzzles separated at birth. Journal of International Money and Finance 26, 587-605.
Tasca, P., Battiston, S., 2011. Diversification and financial stability. CCSS Working Paper Series, 11-001.