Munich Personal RePEc Archive
The Performance of Plants Inserted in
Global Supply Chains: A Look at
Vertically-Linked Affiliates
Blyde, Juan and Santamaria, Julieth
31 March 2013
Online at
https://mpra.ub.uni-muenchen.de/45750/
The Performance of Plants Inserted in Global Supply Chains:
A Look at Vertically-linked Affiliates
Juan Blyde Julieth Santamaria Inter-American Development Bank Inter-American Development Bank
This version: March, 2013
ABSTRACT
An increasing number of case studies provide evidence that the interaction between global actors and firms in developing countries, particularly within the context of global supply chains, translate into critical knowledge acquisition. Examining vertically-integrated affiliates located in Chile we provide systematic evidence showing that foreign affiliates inserted in global supply chains tend to have larger capabilities in terms of size, skills and productivity, are more export oriented, and produce goods of higher quality, as measured by unit values, than other exporters in the country. We show that the superiority of these establishments increase with the age of the multinational indicating that time is required to accumulate the necessary skills. We also show that the edge of foreign affiliates in terms of the export outcomes decreases but does not disappear completely after these differences in plant capabilities are controlled for, a result that suggests that additional factors, most likely of intangible nature, might be behind the improved export performance and higher quality of goods of these establishments.
JEL No. F10, F23, L25
Key words: global supply chains, learning, knowledge transfer, vertical FDI
The views and interpretations in this paper are strictly those of the authors and should not be attributed to the Inter-American Development Bank, its Board of Directors, or any of its member countries
1
Introduction
Production processes have been increasingly fragmented worldwide. That is, the making of many goods has
become a multi-country process in which different stages are carried out in specialized plants in different
parts of the world. Many developing countries are seeking to join international production networks for
various reasons. For instance, participation in international supply chains is frequently associated with rapid
learning, technology transfers and knowledge spillovers. A literature on global value chains has emphasized
the idea that suppliers in production networks are exposed to learning and knowledge acquisition emanating
from lead firms (Humphrey and Schmitz, 2002; Schmitz and Knorringa, 2000, Schmitz, 2006). Lead firms are
generally willing to transfer knowledge to their suppliers because failing to do so might entail risks for
themselves. For instance, the arrival of a component with the incorrect specifications can have quite
disrupted impacts in the production of a final good as entire production lines might be shut down until all the
correct inputs have been gathered. Accordingly, lead firms expose their suppliers to quality control systems
and prevailing global business standards that tend to exceed those in developing countries. By being “pushed” to possess or acquire higher competencies these suppliers tend to produce goods of higher quality than other
firms in their countries.
There have been an increasing number of case studies showing that access to a global production network is
indeed associated with critical acquisition of capabilities and high quality goods. Analyses can be found in
many sectors, like in apparel (Gereffi, 1999), motorcycle (Fujita, 2011), the agroindustry (Cafaggi, et al., 2012)
or the computer industry (Kawakami, 2011). But more systematic evidence showing that participation in
production networks is associated with superior competencies and higher quality goods is still missing. This
paper seeks to fill this gap in the literature.
In this study we combine a detailed dataset of multinational companies with plant level data from Chile to
compare the performance of vertically-integrated affiliates with that of local plants. If suppliers in global
production networks are required to possess superior capabilities in order to successfully perform in value
chains, this should be particularly true when the supplier is an affiliate of a multinational company.
Accordingly, we examine whether vertically-integrated affiliates located in Chile exhibit an edge over other
exporters in the country in a number of export outcomes and firm characteristics.
It is worth noting that vertical FDI is not the only strategy that production processes can be offshored. Lead
firms fragmenting production internationally can open affiliates in other countries but they can also engage in
foreign outsourcing with independent suppliers if they decide to keep offshoring outside the boundaries of
the firm. Admittedly, this could represent a problem for our exercise because our control group could in
mentioned above, these suppliers could be exposed to higher quality controls and business standards in
similar ways as the affiliates of multinationals. Ideally we would like to separate this type of establishments
from the control group; unfortunately we do not have the required information to do so. Keeping these
plants in the sample could bias the results, but if anything, the direction of the bias should be against the
likelihood of finding a superior performance of the vertically-integrated affiliates over the control group.
The results show that even within narrowly defined sectors, vertically-integrated affiliates tend to be bigger,
exhibit larger shares of skilled workers and have larger productivity levels than the rest of the exporters. The
results also show that these firms are superior in terms of total exports as well as the number of products
exported and have larger export unit values than the other exporters. The findings go in line with increasing
evidence from case studies in the global value chain literature that participation in production networks is
associated with improved capabilities and higher quality of the goods.
The paper is also related to a more general FDI literature showing that foreign affiliates have better
performance than local counterparts. For instance, Barefoot and Mataloni (2011) present evidence for the US
suggesting that labor productivity in the manufacturing sector is higher among multinational parents than
among non-multinationals. Similarly, Mayer and Ottaviano (2007) provide evidence for Belgium, France,
Germany and Norway indicating that multinational parents are generally bigger, more productive and pay
higher wages than firms that are not engaged in multinational activity. More related to our paper, there is an
important literature showing that foreign affiliates tend to perform better than the local plants in their host
countries. For instance, higher productivity levels in foreign affiliates relative to domestic plants has been
found for various countries including Venezuela (Aitken and Harrison, 1999), Lithuania (Javorcik, 2004), the
Czech Republic (Sabirianova et al., 2005) and Turkey (Yasar and Paul, 2007). Antras and Yeaple (2013) show
evidence for a group of OECD countries that affiliates of multinationals tend to be larger, more productive,
more R&D intensive and more export oriented than local firms. Arnold and Javorcik (2009) found that the
acquisition of local plants by multinationals in Indonesia led to significant productivity improvements in the
acquired plants.
Our paper is specially related to a stream of the FDI literature that has found empirical support to the notion
that FDI may promote upgrading and higher quality of export products. For example, using firm level data
for Mexico, Iacovone and Javorcik (2008) show that unit values of new export products introduced by
foreign firms are larger than those of domestic producers. Similarly, Wang and Wei (2008) show that
multinationals in China have systematically higher unit values than local firms, suggesting they produce
higher-end products. Finally, using a cross-country analysis, Harding and Javorcik (2012) show that more FDI
Our results complement this literature in various ways. First, as we focus on vertically-linked affiliates, we are
the first study to explicitly examine the functioning of multinationals relative to local firms in the context of
global supply chains. Second, we provide additional insights regarding the improved performance of these
multinationals. For instance, we investigate whether there are dynamics in the enhanced performance of
affiliates over the local plants. Our results indicate that in general the gaps increases with the age of the
multinational, suggesting that certain skills and capabilities tend to be accumulated only over the years.
Second, we also show that the superiority of foreign affiliates in terms of export outcomes decreases but does
not disappear completely after differences in plant capabilities, like size, productivity and skills, are controlled
for. This last result indicate that well defined plant capacities play an important role behind the improved
outcomes of the foreign affiliates but that there might also be other contributing factors, most likely of
intangible nature.
The rest of this paper is organized as follows. In sector 2 we describe the datasets, basic patterns in the data
and the empirical estimation that we conduct. Section 3 shows the results of the estimation and discusses the
most salient findings. Finally, section 4 concludes.
2
Data description and basic patterns
We merge three datasets in our analysis. First we employ a worldwide dataset of multinationals, the
Worldbase dataset from Dun & Bradstreet (D&B).1 For each establishment in this dataset, there is
information on an array of variables, including: country and city of location, industry codes and ownership
(the firm’s parents). From this dataset we choose the affiliates located in Chile that exhibit corporate linkages2
with multinationals in other countries. In addition, we follow Alfaro and Charlton (2009) in identifying
whether the relationship between the affiliate and its parent company is horizontal (the parent and the
subsidiary produce the same good), vertical (the subsidiary produces an input to the parent) or complex (the
relationship is both horizontal and vertical). The methodology essentially entails comparing the industry
codes (at the 4-digit SIC level) of both parents and subsidiaries to examine whether they produce the same
good and/or whether the subsidiary is a supplier to its parent. The latter is determined using the industry
1 The data have also been used in academic studies for various purposes including the comparison of size and diversification patterns
of foreign investment in North America (Caves, 1975), the development of microdatasets on enterprises (Lipsey, 1978), the effect of bank credit availability and business creation (Black and Strahan, 2002), the relationship between financial development and vertical integration (Acemoglu, Johnson and Mitton, 2009), the patterns of intra-industry and inter-industry FDI (Alfaro and Charlton, 2009) and the relationship between foreign ownership and establishment performance (Alfaro and Chen, 2011).
2 A corporate linkage occurs when one business location has financial and legal responsibility for another business location. In the
codes in combination with an input-output table to identify whether the industry of the subsidiary
corresponds to an upstream industry of the parent’s output. Similarly to Alfaro and Charlton (2009) we use the Bureau of Economic Analysis 1987 benchmark input-output table and employ alternative thresholds of
the input-output total requirements coefficient.3 In this paper we work only with the affiliates that are
vertically-linked to a firm in another country which are identified at the 4-digit SIC level.
The second dataset consists on transaction-level data from the Chilean national customs authority –Servicio National de Aduana- for all the manufacturing firms. Trade transactions in this dataset are identified at the
8-digit HS level and each record includes a firm identifier, the destination country, the export value of the
transaction as well as its unit value in US dollars. These data provides the basis for comparing unit values and
other export performance indicators across establishments. Finally, we employ plant-level data from the
annual manufacturing survey ENIA (Encuesta Nacional Industrial Annual) conducted by the national institute of
statistics, INE. The survey covers all manufacturing establishments in the country with more than 10
employees and provides information on plant characteristics, such as manufacturing industry (4-digit ISIC
rev3), production, employment, and investment. Capital stocks are constructed using the perpetual inventory
method for each plant (see Liu, 1993) and a measure of the plant’s total factor productivity is constructed using multifactor superlative index number as in Bernard, Jensen and Schott (2006). Using this manufacturing
survey allows us to compare vertically-linked affiliates with the other plants in terms of various firm
characteristics.
The combination of these three datasets gives us a rich amount of information to perform the various
comparisons of this study. The ENIA survey encompasses an average of 5,400 plants per year and from this
group around 1,400 plants are exporters. We can analyze in detail the export transactions of these 1,400
plants after merging the ENIA survey with the customs data. Using the Worldbase dataset we identify from
this group of exporters 73 plants that are vertically-linked to multinationals in other countries. We compare
these 73 plants against the other exporters in terms of a number of characteristics and export outcomes. Our
data is available for the 1997-2006 period.
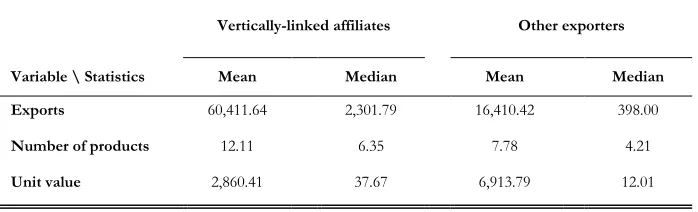
Table 1 provides a preliminary comparison between the vertically-linked affiliates and the rests of the
exporters across various export outcomes. On average, vertically-linked affiliates sell abroad 12.1 products for
60.4 million US dollars while the corresponding figures for the other exporters is 7.8 products for 16.4
million US dollars. When we look at the unit values of exports, the comparison provides mixed results. In
terms of average, affiliates exhibit lower unit values than the rest of the exporters while the opposite is true
when median values are used.
While informative, the results in table 1 are only rough approximations of the true differences between these
two groups of plants. The values in table 1 are averages across different products and across establishments in
different sectors. A proper exercise must compare total export values and total number of products across
firms in similar sectors, and unit values across similar types of goods. To this end we run the following
specifications:
(1)
where is either the log of the total value of exports or the log of the total number of products that plant i
in sector k exports in year t, is a dummy variable that takes the value of 1 if the plant is a vertically-linked
affiliate and zero otherwise, and and are sector and year fixed effects, respectively. The sector in this
specification is defined at the 4-digit ISIC rev 3 level. If foreign affiliates exhibit enhanced outcomes over the
rest of the exporters, we should expect a positive and significant coefficient for .
Additionally, we run the following specification for the unit values:
(2)
where is the log of the unit value of the export of good p by plant i to destination country c in year t,
, and are product, destination country and year fixed effects, respectively, and is defined as before. The product in this specification is at the 8-digit HS level. The specification takes in consideration
that unit values might differ across firms, products, years and destination country. By using the dataset at this
level of disaggregation we avoid having to work with average unit values across any of these dimensions.
3
Econometric results
Table 2 shows the results after estimating equation (1) for the total value of exports and the total number of
products. The results in columns (1) and (3) reveal the stronger export performance of the vertically-linked
affiliates over the rest of the exporters. Foreign affiliates export around 4 times more (e1.6– 1 = 3.9) and sell
abroad about 54% (e0.43 – 1 =0.54) more products than the other exporters. The results in columns (2) and (4)
in which we control for possible changes in sector characteristics across time using sector-year fixed effects,
confirm these findings.
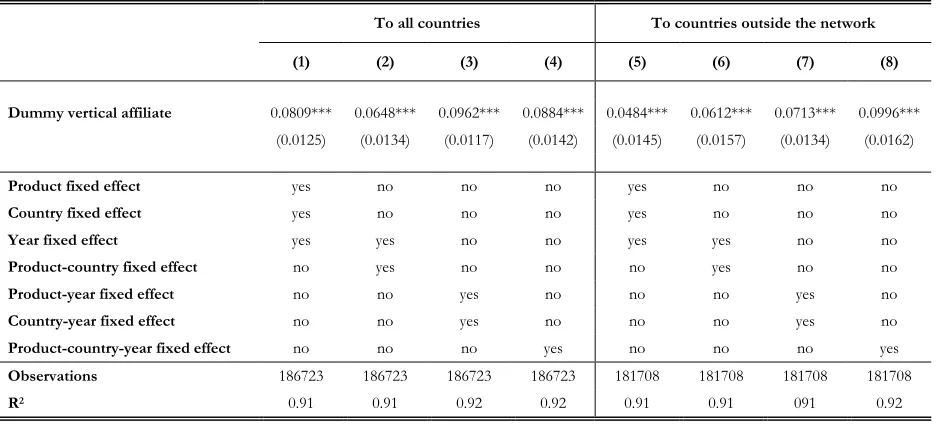
The comparison for unit values is shown in table 3. Column (1) of this table presents the baseline
specification introduced in equation (2). Columns (2)-(4) run alternative combinations of fixed effects to
examine whether the results change in any significant way. The coefficient estimate for the dummy on vertical
across the various specifications. Exports of vertical affiliates exhibit unit values that are on average 8%
higher than the unit values of the rest of the exporters, suggesting that foreign affiliates tent to export higher
quality goods.
One issue of potential concern is the possibility that multinationals are engaging in transfer pricing, the
practice of adjusting charges among related parties to take advantages of differences in tax systems and/or
import duties across locations. Evidence supporting the existence of transfer pricing is shown in Swenson
(2001), Clausing (2003) and Bernard, Jensen and Schott (2006). It is possible then the unit values of the
exports that are sent from the affiliate to its parent company or to other plants that belong the multinational’s family are affected by transfer pricing practices. Unfortunately we do not have a direct way to control for this
factor. What we do in this paper, however, is to test whether the edge that we observe in unit values from the
affiliates is still present when we examine only the exports that they sell in countries outside the
multinational’s network. We argue that if the edge is still present, it is not very likely that transfer pricing activities are the driving factor behind the higher unit values that we observe in the initial results.
We employ the Worldbase dataset to identify for each vertically-linked foreign affiliate in Chile the country of
its parent as well as the countries in which its parent has other affiliates. Then, we re-calculate the unit values
of the foreign affiliate by using only the exports that do not go to any of these countries. The control group
remains the same as before. Columns (5)-(8) show the results. While the coefficient estimates vary slightly
from the previous regressions they remain positive and significant at conventional levels suggesting that the
higher unit values of the exports of foreign affiliates are not likely to be driven by transfer pricing activities.
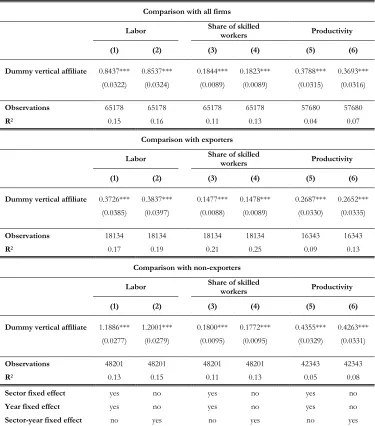
Beyond export outcomes, we also want to analyze whether vertically-linked affiliates show superior
performance in terms of certain firm characteristics. Table 4 shows this exercise. The first panel compares the
foreign affiliates with all the establishments of the ENIA which includes the exporters and the non-exporters
of the survey. The results show that the foreign affiliates tend to be bigger, exhibit larger shares of skilled
workers and possess higher levels of total factor productivity than the rest of the plants. The middle panel
shows that the favorable comparison remains when the control group consists only on the exporters of the
sample, while the bottom panel shows that the superiority is particularly large with respects to the
non-exporters. In short, exporters exhibit larger capabilities than non-exporters and foreign affiliates exhibit larger
capabilities than the exporters.
Now we would like to examine whether there are some dynamics in the superiority of the foreign affiliates. In
section 1 we argue that the suppliers in global supply chains are typically pushed to acquire enhanced
capabilities in order to successfully perform in international production networks. While the results in table 4
plants, it is unclear whether this edge is present from the start or whether it is accumulated over time. To
explore this issue we augment equation (1) in the following way:
(3)
where is equal to 1 if the plant is a vertically-linked affiliate and is less than 5 years old; is equal to 1 if
the plant is a vertically-linked affiliate and is between 5 and 15 years old, and is equal to 1 if the plant is a
vertically-linked affiliate and is older than 15 years. With this specification we employ age cohorts in order to
separate the life cycle of the affiliates in reasonable groups: young (up to 5 years), mid-age (between 6 and 15)
and mature (more than 15), and then check whether the superiority of the affiliate changes across these
cohorts.4 The results for size, share of skilled labor and productivity are shown in figure 1 which plots the
estimates of , and for each of the regressions.5
The first aspect to notice in the three graphs is that the estimated coefficient is already positive and significant
in the first cohort. In principle, this would suggest that foreign affiliates exhibit better capabilities from the
start. However, a word of caution is in order here. While we can establish the age of the affiliate because we
know the year it was founded, it is certainly possible that the plant would have started operations before that
year, for instance, as an independent firm. Since we do not have a way to know whether this is the case or
not, we will not want to jump into any conclusion with respect to this particular result. Rather than focusing
on the point estimate of the first cohort, we will focus on the entire trend.
In general, the trends suggest that the superior capabilities of the foreign affiliates increase with time. The
graphs show that the gaps in terms of size, skills and productivity that the mature affiliates exhibit relative to
the control group are larger than the gaps that the young affiliates exhibit relative to the same group.
Figure 2 show the results for the various export outcomes. The three graphs in the first column depict the
results when we employ all the exports of the foreign affiliate while the three graphs of the second column
present the results when only the exports of the affiliate to the countries outside its network are considered.
In general, the trends indicate that the better performance of the foreign affiliates in terms of total exports
and the number of products increase with time. Interestingly, this does not seem to be the case for unit values
which remain roughly the same between the first two cohorts and then decline in the third cohort. The
comparison between the dynamics observed between the unit values in figure 2 and the variables in figure 1
indicate that the edge of affiliates in terms of firm’s capabilities increases over time while the edge in terms of
4 We also employ slightly different cohorts and the results do not change in any significant way
5 If a coefficient is not statistically significant at 10% level it is plotted with a zero value regardless of its estimated value in the
the quality of the goods does not. This could suggest that the firm capabilities that we are examining (size,
skills and productivity) might not be the only factors behind the better export performance that foreign
affiliates exhibit, particularly for unit values. We take a closer look at this issue next.
First, we run the same regressions as in table 2 but controlling for differences in size, skills and productivity.
The idea is to see whether differences in these capabilities are behind the better performance of the affiliates
in the various export outcomes and whether controlling them eliminates the gaps originally found in the
export outcomes. The results are reported in table 5 which again depicts regressions when all the exports of
the affiliates are employed (columns 1 to 4) and when only the exports to the countries outside the affiliate’s network are considered. A direct comparison of the coefficients for the dummy variable in columns (1) to (4)
with the ones in table 2 shows that all the estimates decrease considerably, around half of the original
estimates. This already indicates that the capabilities included in the regression play a role in the enhanced
export outcomes of the affiliates. Interestingly, however, all the estimates are still positive and significant,
suggesting that there might be still other factors besides those controlled by these firm characteristics that
could be behind the edge of the foreign affiliates. Note also that the coefficients for the dummy variable in
the regressions for the number of products when the affiliate export to the countries outside its network
(columns 7 and 8) are not statistically significant. The result suggests that for this particular export outcome,
the differences in the capabilities examined in these regressions account entirely for superiority of the foreign
affiliate.
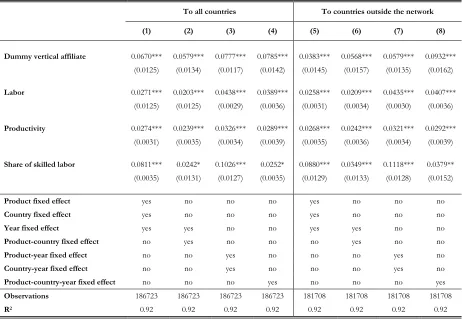
Table 6 presents a similar exercise for the unit values. The results from this table can be compared to those in
table 3. Once again the estimates decline in all the regressions but they are still positive and significant at
conventional levels, suggesting that there might be still other factors behind the higher quality of goods
produced by foreign affiliates.
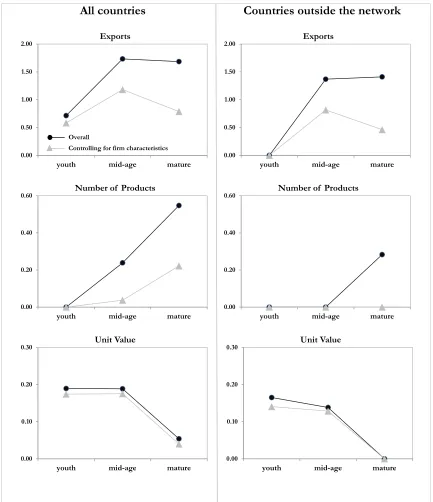
Finally, we re-estimate an augmented version of equation (3) in which the labor, skills and productivity
variables are also included in the regression. Figure 3 shows the point estimates of , and for the
various export outcomes. For comparison, we also include the original point estimates that we presented in
figure 2. Because the new point estimates are always smaller than the original ones, it is clear again that these
firm characteristics play an important role in the superiority of the foreign affiliates over the control group,
particularly for exports and number of products and less so for unit values. It is also clear that these
capabilities do not account completely for the gaps observed because most of the point estimates continue to
be statistically significant. The fact that concrete measures of plant’s characteristics like size, skills or productivity do not exhaust the possible explanations behind the better export outcomes of the foreign
affiliates suggests that other aspects, perhaps more intangible in nature, could be playing additional roles. For
These barriers might be less severe for a multinational group with a large capacity to gather tacit knowledge
and exchange it through its various production units than for a single plant. Exploring in detail the role of this
or other potential factors would be an interesting project for further research.
4
Conclusions
A recent literature on global value chains have emphasized the idea that the interaction between global actors
and firms in developing countries, particularly within the context of global supply chains, is likely to translate
into critical knowledge acquisition. An increasing number of case studies support the notion that lead firms
tend to expose their suppliers to high quality control systems and technical standards and as a result they
produce goods of higher quality than other firms in the country. But more systematic evidence was still
lacking.
In this study we compare vertically-integrated affiliates located in Chile with other exporters in the country to
examine whether participation in production networks is correlated with better performance outcomes. We
show that vertically-integrated affiliates are bigger, exhibit larger shares of skilled workers, have higher
productivity levels, export more and produce goods of higher quality, as measured by unit values, than the
rest of the plants. Our results also indicate that the improved capabilities of foreign affiliates do not arise
overnight. In general, the gaps between the foreign affiliate and the local plants increase with the age of the
multinational, suggesting that superior skills and capabilities require time to accumulate.
We also show that the superiority of foreign affiliates in terms of export outcomes decreases but does not
disappear completely after differences in plant capabilities, like size, productivity and skills, are controlled for,
a result that suggests that additional factors, most likely of intangible nature like lower information barriers,
References
Acemoglu, D., S. Johnson, and T. Mitton, 2009, “Determinants of Vertical Integration: Financial Development and Contracting Costs,” Journal of Finance, 64(3): 1251–90.
Alfaro, L., and A. Charlton, 2009, "Intra-Industry Foreign Direct Investment," American Economic Review 99, no. 5: 2096-2119
Alfaro, L., and M. Chen, 2011, "Surviving the Global Financial Crisis: Foreign Ownership and Establishment Performance," NBER Working Papers 17141, National Bureau of Economic Research
Aitken, B., and A., Harrison, 1999, “Do Domestic Firms Benefit from Direct Foreign Investment? Evidence from Venezuela” American Economic Review v89, n3: 605-618.
Antras, P., and S. R., Yeaple, 2013, “Multinational Firms and the Structure of International Trade” NBER
Working Paper No. 18775.
Arnold, J.M., and B.S., Javorcik, 2009, “Gifted Kids or Pushy Parents? Foreign Acquisitions and Firm Performance in Indonesia” Journal of International Economics 79(1).
Barefoot, K., and R., Mataloni, 2011, “Operations of U.S. Multinational Companies in the United States and Abroad: Preliminary Results from the 2009 Benchmark Survey” Survey of Current Business, November.
Bernard, A., J.B., Jensen, and P. Schott, 2006, “Transfer Pricing by U.S.-Based Multinationals”, Tuck School of Business, mimeo.
Black, S. E., and P.E. Strahan, 2002, “Entrepreneurship and Bank Credit Availability,” Journal of Finance, 57(6): 2807–33.
Cafaggi, F., R., Macedo, L., Swensson, T., Andreotti, C., Piterman, L., de Almeida and T., Alves, 2012,
“Accessing the Global Value Chain in a Changing Institutional Environment: Comparing Aeronautics and Coffee” IDB Working Paper No. 370, Inter-American Development Bank, Washington DC
Caves, R.E., 1975, Diversification, Foreign Investment and Scale in North American Manufacturing Industries. Ottawa: Economic Council of Canada.
Clausing, K., 2003, “Tax-motivated Transfer Pricing and US Intrafirm Trade Prices”, Journal of Public Economics, 87(9-10).
Fujita, M., 2011, “Value Chain Dynamics and Local Supplier’s Capability Building: An Analysis of the Vietnamese Motorcycle Industry” in Kawakami, M., and Sturgeon, T. (eds.) The Dynamics of Local Learning
in Global Value Chains, Experiences from East Asia, Palgrave Macmillan, IDE-Jetro.
Gereffi, G., 1999, “International Trade and Industrial Upgrading in the Apparel Commodity Chain”, Journal of International Economics 48 (1)
Harding, T., and B.S. Javorcik, 2012. “Foreign Direct Investment and Export Upgrading” The Review of Economics and Statistics, MIT Press, vol. 94(4), pages 964-980, November
Humphrey, J., and H., Schmitz, 2002, “Developing Country Firms in the World Economy: Governance and
Iacovone, L., and B.S., Javorcik, 2008, “Multi-product exporters: Diversification and micro-level dynamics” World Bank Policy Research Working Paper 4723
Javorcik, B., 2004, “Does Foreign Direct Investment Increase the Productivity of Domestic Firms? In Search of Spillovers through Backward Linkages” American Economic Review v93, n3: 605-627.
Kawakami, M., 2011, “Inter-firm Dynamics in Notebook PC Value Chains and the Rise of Taiwanese
Original Design Manufacturing Firms” in Kawakami, M., and Sturgeon, T. (eds.) The Dynamics of Local
Learning in Global Value Chains, Experiences from East Asia, Palgrave Macmillan, IDE-Jetro.
Lipsey, R.E., 1978, “The Creation of Microdata Sets for Enterprises and Establishments,” Annales de
l’INSEE, 30-31: 395–422
Mayer, T., and G. Ottaviano, 2007, “The Happy Few: The Internationalisation of European Firms” Bruegel
Blueprint Series, Volume III.
Rauch, J., 1996. “Trade and search: Social capital, Sogo Shosha, and spillovers”. NBER Working Paper 5618. Rauch, J., 1999. “Networks versus markets in international trade” Journal of International, 48(3)
Sabirianova, K., J., Svejnar and K., Terrell, 2005, “Distance to the Efficiency Frontier and FDI Spillovers” Journal of the European Economic Association, Papers and Proceedings v3, n2-3: 576-586.
Schmitz, H., 2006, “Learning and Earning in Global Garment and Footwear Chains”, The European Journal of Development Research, Vol 18(4)
Schmitz, H., and P., Knorringa, 2000, “Learning from Global Buyers”, Journal of Development Studies, 37.
Swenson, D., 2001, “Tax Reforms and Evidence of Transfer Pricing” National Tax Journal, 54(1)
Wang, Z., and S-J, Wei, 2008, “What Accounts for the Rising Sophistication of China’s Exports?” NBER Working Paper 13771
Table 1: Descriptive statistics. Average values for the period 1997-2006
Vertically-linked affiliates Other exporters
Variable \ Statistics Mean Median Mean Median
Exports 60,411.64 2,301.79 16,410.42 398.00
Number of products 12.11 6.35 7.78 4.21
Unit value 2,860.41 37.67 6,913.79 12.01
Table 2: Regressions on total exports and number of products
Exports Number of products
(1) (2) (3) (4)
Dummy vertical affiliate 1.6159*** 1.5998*** 0.4386*** 0.4298*** (0.1197) (0.1245) (0.0498) (0.0515)
Sector fixed effect yes no yes no
Year fixed effect yes no yes no
Sector-year fixed effect no yes no yes
Observations 8000 8000 8002 8002
R2 0.30 0.34 0.14 0.19
Notes: The dependent variable in columns (1) and (2) is the log of exports at the firm, sector and year level; the dependent variable in columns (3) and (4). Sector is defined at the 4-digit ISIC rev3 level.
Table 3: Regressions on unit values
To all countries To countries outside the network
(1) (2) (3) (4) (5) (6) (7) (8)
Dummy vertical affiliate 0.0809*** 0.0648*** 0.0962*** 0.0884*** 0.0484*** 0.0612*** 0.0713*** 0.0996*** (0.0125) (0.0134) (0.0117) (0.0142) (0.0145) (0.0157) (0.0134) (0.0162)
Product fixed effect yes no no no yes no no no
Country fixed effect yes no no no yes no no no
Year fixed effect yes yes no no yes yes no no
Product-country fixed effect no yes no no no yes no no
Product-year fixed effect no no yes no no no yes no
Country-year fixed effect no no yes no no no yes no
Product-country-year fixed effect no no no yes no no no yes
Observations 186723 186723 186723 186723 181708 181708 181708 181708
R2 0.91 0.91 0.92 0.92 0.91 0.91 091 0.92
Notes: The dependent variable in all columns is the log of the average unit value at the firm, product, destination country and year level. In columns (1)-(4) the destination is any country, and in colums (5)-(8) the destination is any country outside the affiliate's network.
Table 4: Regressions on establishment characteristics
Comparison with all firms
Labor Share of skilled
workers Productivity
(1) (2) (3) (4) (5) (6)
Dummy vertical affiliate 0.8437*** 0.8537*** 0.1844*** 0.1823*** 0.3788*** 0.3693***
(0.0322) (0.0324) (0.0089) (0.0089) (0.0315) (0.0316)
Observations 65178 65178 65178 65178 57680 57680
R2 0.15 0.16 0.11 0.13 0.04 0.07
Comparison with exporters
Labor Share of skilled
workers Productivity
(1) (2) (3) (4) (5) (6)
Dummy vertical affiliate 0.3726*** 0.3837*** 0.1477*** 0.1478*** 0.2687*** 0.2652***
(0.0385) (0.0397) (0.0088) (0.0089) (0.0330) (0.0335)
Observations 18134 18134 18134 18134 16343 16343
R2 0.17 0.19 0.21 0.25 0.09 0.13
Comparison with non-exporters
Labor Share of skilled
workers Productivity
(1) (2) (3) (4) (5) (6)
Dummy vertical affiliate 1.1886*** 1.2001*** 0.1800*** 0.1772*** 0.4355*** 0.4263***
(0.0277) (0.0279) (0.0095) (0.0095) (0.0329) (0.0331)
Observations 48201 48201 48201 48201 42343 42343
R2 0.13 0.15 0.11 0.13 0.05 0.08
Sector fixed effect yes no yes no yes no
Year fixed effect yes no yes no yes no
Sector-year fixed effect no yes no yes no yes
Notes: The dependent variable in columns (1) and (2) is the log of the the establishment's labor force; the dependent variable in columns (3) and (4) is the share of skilled workers in total workers; the dependent variable in columns (5) and (6) is a measure of total factor productivity based on the multifactor superlative index number. the sector is defined at the 4-digit ISIC rev3 level.
Table 5: Regressions on exports and number of products, controlling for firm characteristics
To all countries To countries outside the network
Exports Number of products Exports Number of products
(1) (2) (3) (4) (5) (6) (7) (8)
Dummy vertical affiliate 0.8751*** 0.8536*** 0.1680*** 0.1561*** 0.5591*** 0.5285*** -0.0439 -0.0530 (0.1042) (0.1081) (0.0448) (0.0461) (0.1065) (0.1103) (0.0457) (0.0470)
Labor 1.2287*** 1.2256*** 0.4485*** 0.4544*** 1.2261*** 1.2242*** 0.4451*** 0.4510***
(0.0234) (0.0244) (0.0101) (0.0104) (0.0234) (0.0244) (0.0101) (0.0104)
Productivity 0.3518*** 0.3657*** 0.1904*** 0.2121*** 0.3501*** 0.3626*** 0.1878*** 0.2078***
(0.0322) (0.0341) (0.0138) (0.0146) (0.0322) (0.0342) (0.0138) (0.0146)
Share of skilled labor 1.0483*** 1.1259*** 0.3078*** 0.3116*** 1.0274*** 1.1055*** 0.2911*** 0.2912*** (0.1014) (0.1071) (0.0436) (0.0457) (0.1014) (0.1071) (0.0436) (0.0456)
Sector fixed effect yes no yes no yes no yes no
Year fixed effect yes no yes no yes no yes no
Sector-year fixed effect no yes no yes no yes no yes
Observations 8000 8000 8002 8002 7975 7975 7977 7977
R2 0.49 0.52 0.32 0.37 0.48 0.52 0.31 0.37
Notes: The dependent variable in columns (1),(2),(5) and (6) is the log of exports at the firm, sector and year level; the dependent variable in columns (3),(4),(7) and (8) is the log of the number of products at the firm, sector and year level. In columns (1)-(4) the destination is any country, and in colums (5)-(8) the destination is any country outside the affiliate's network. Sector is defined at the 4-digit ISIC rev3 level.
Table 6: Regressions on unit values, controlling for firm characteristics
To all countries To countries outside the network
(1) (2) (3) (4) (5) (6) (7) (8)
Dummy vertical affiliate 0.0670*** 0.0579*** 0.0777*** 0.0785*** 0.0383*** 0.0568*** 0.0579*** 0.0932*** (0.0125) (0.0134) (0.0117) (0.0142) (0.0145) (0.0157) (0.0135) (0.0162)
Labor 0.0271*** 0.0203*** 0.0438*** 0.0389*** 0.0258*** 0.0209*** 0.0435*** 0.0407***
(0.0125) (0.0125) (0.0029) (0.0036) (0.0031) (0.0034) (0.0030) (0.0036)
Productivity 0.0274*** 0.0239*** 0.0326*** 0.0289*** 0.0268*** 0.0242*** 0.0321*** 0.0292***
(0.0031) (0.0035) (0.0034) (0.0039) (0.0035) (0.0036) (0.0034) (0.0039)
Share of skilled labor 0.0811*** 0.0242* 0.1026*** 0.0252* 0.0880*** 0.0349*** 0.1118*** 0.0379** (0.0035) (0.0131) (0.0127) (0.0035) (0.0129) (0.0133) (0.0128) (0.0152)
Product fixed effect yes no no no yes no no no
Country fixed effect yes no no no yes no no no
Year fixed effect yes yes no no yes yes no no
Product-country fixed effect no yes no no no yes no no
Product-year fixed effect no no yes no no no yes no
Country-year fixed effect no no yes no no no yes no
Product-country-year fixed effect no no no yes no no no yes
Observations 186723 186723 186723 186723 181708 181708 181708 181708
R2 0.92 0.92 0.92 0.92 0.92 0.92 0.92 0.92
Notes: The dependent variable in all columns is the log of the average unit value at the firm, product, destination country and year level. In columns (1)-(4) the destination is any country, and in colums (5)-(8) the destination is any country outside the affiliate's network.
Figure 1: Estimated coefficients for the vertical affiliate dummies across cohorts, firm characteristics
Note: the graphs present the point estimates of , and in equation (3) when the dependent variables are the log of labor, the log of the share of skilled labor and the log of productivity
0.75 0.80 0.85 0.90
youth mid-age mature
Labor
0.10 0.15 0.20 0.25
youth mid-age mature
Share of skilled labor
0.10 0.20 0.30 0.40 0.50
youth mid-age mature
Figure 2: Estimated coefficients for the vertical affiliate dummies across cohorts, export variables
Note: the graphs present the point estimates of , and in equation (3) when the dependent variables are the log of total exports, the log of the number of products exported and the log of unit values. The three graphs in the first column depict the results
when all the exports of the foreign affiliate are considered while the three graphs of the second column present the results when only the exports of the affiliate to the countries outside its network are employed
All countries Countries outside the network
0.00 0.50 1.00 1.50 2.00
youth mid-age mature
Exports 0.00 0.50 1.00 1.50 2.00
youth mid-age mature
Exports
0.00 0.20 0.40 0.60
youth mid-age mature
Number of Products
0.00 0.20 0.40 0.60
youth mid-age mature
Number of Products
0.00 0.10 0.20 0.30
youth mid-age mature
Unit Value
0.00 0.10 0.20 0.30
youth mid-age mature
Figure 3: Estimated coefficients for the vertical affiliate dummies across cohorts and controlling for firm characteristics, export variables
Note: the graphs present the point estimates of , and in equation (3) when the dependent variables are the log of total exports, the log of the number of products exported and the log of unit values. The point estimates when no firm characteristics are
controlled for are presented in dark circles while the point estimates after controlling for firm characteristics are presented in light triangles. The three graphs in the first column depict the results when all the exports of the foreign affiliate are considered while the three graphs of the second column present the results when only the exports of the affiliate to the countries outside its network are employed
All countries Countries outside the network
0.00 0.50 1.00 1.50 2.00
youth mid-age mature
Exports
Overall
Controlling for firm characteristics
0.00 0.50 1.00 1.50 2.00
youth mid-age mature
Exports
0.00 0.20 0.40 0.60
youth mid-age mature
Number of Products
0.00 0.20 0.40 0.60
youth mid-age mature
Number of Products
0.00 0.10 0.20 0.30
youth mid-age mature
Unit Value
0.00 0.10 0.20 0.30
youth mid-age mature